
U.S.-China Tariff Clash Intensifies as Bitcoin Dips Below $77K
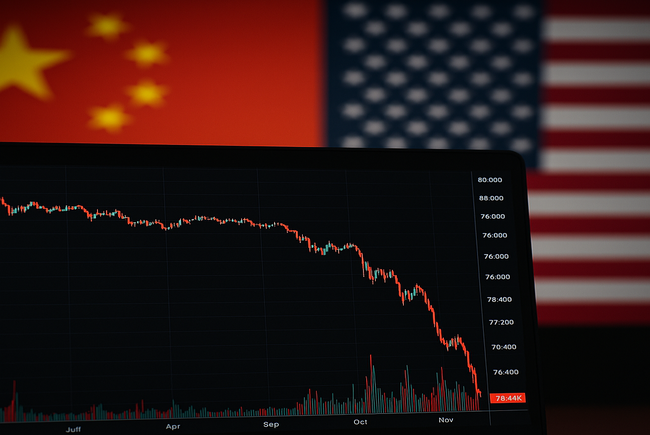
Tensions between the United States and China escalated Today after the Trump administration announced a 104% tariff hike on Chinese imports, set to take effect within hours. The move follows China’s $50 billion sell-off in U.S. Treasuries, an apparent retaliation to prior tariff actions. The latest round of economic measures has rattled global markets. Bitcoin, which had briefly surged to $80,200 earlier in the day, fell sharply by more than 9%, dropping to $76,400 in the hours following the White House announcement. The S&P 500 opened the day with a 4% gain but pared back gains as geopolitical risks rose. China Dumps U.S. Debt Amid Heightened Trade Tensions Beijing’s decision to offload $50 billion in U.S. government bonds marked the most significant single-day sell-off of Treasuries by China in recent memory. Analysts see the move as a direct signal of financial pushback against the escalating tariff dispute. The Treasury Department has not commented on the sell-off, but the market impact was immediate. Yields spiked in early trading, and analysts noted growing concerns about reduced foreign appetite for U.S. debt if the conflict persists. Although the U.S. had initially indicated openness to renegotiation following former President Trump’s “Liberation Day” remarks, talks have since stalled, with no clear diplomatic engagement. Investors Brace for Prolonged Market Volatility Market observers warn that volatility could persist in the absence of a resolution. Despite large price swings, there has been no significant increase in retail short positions or sell-offs by major investors, suggesting hesitation to make directional bets amid deep uncertainty. Cryptocurrency traders are also watching closely. Bitcoin’s sharp dip is being seen not just as a reaction to tariffs but also as a signal that digital assets are increasingly tied to macroeconomic and geopolitical developments. For now, all eyes remain on potential responses from Beijing and the Federal Reserve’s stance on managing yield pressure in the bond market. No public statement has yet been issued by President Biden or top Chinese officials regarding the next steps.
Best Crypto Exchanges in Belgium (2025)

With cryptocurrency prices surging and the excitement of a bull run gripping the market, more and more Belgians are looking to own digital assets. This renewed enthusiasm is fueled by a growing awareness of cryptocurrencies, their potential for lucrative returns, and Belgium‘s increasingly crypto-friendly environment. Whether you’re drawn by the promise of financial gains or the innovative technology behind cryptocurrencies, finding the best crypto exchange in Belgium is your first step towards a successful journey. Read Also: Best Crypto Exchanges in Georgia (2025) That’s why we’ve curated a list of the best crypto exchanges in Belgium to help get you started right away. Key Takeaways Top Crypto Exchanges in Belgium Exchange Trading Fees Best For Max Leverage Available Assets Fiat Support Security Features Unique Features UEEx 0.09% Maker/Taker (spot);0.10% Maker/Taker (margin) Traders looking for a diverse portfolio include crypto and stocks 200x 200+ 15+ Fiat currency support – Distributed cold storage, – Access control with IP and wallet whitelisting, – Proof of Reserve UE Coin MIner App, Copy trading features, and launchpad for new projects Bybit 0.1% Maker/Taker (spot trading); Liquidation Fee: 2% (margin) Active and Derivatives trader 100x 300+ EUR deposits/withdrawals via SATOS 2FA, Cold storage Extensive derivatives offerings, Copy trading, Trading bots Binance 0.1% Maker/Taker (spot and margin); discounts for BNB holders Beginners and experienced traders seeking a wide selection of assets and low fees. – 20x(for accounts less than 3 days)- Varies by asset 500+ Full EUR support 2FA, SAFU fund, Cold storage BNB fee discounts,User friendly interface, Diverse offering (staking, DeFi, NFTs) Launchpad, DeFi integration Kraken 0.25% (Maker), 0.40% (Taker) with volume incentives; 0.02% for all margin trading pairs except BTC (0.01%) Security-focused traders and institutions 5x 210+ Full EUR support 2FA, Cold storage,PGP encryption Highly customizable interface, Advanced order types, margin trading Gate.io 0.1% Maker/Taker; discounts for GT holder Altcoin traders 100x 1,400+ 50+ fiat currencies (deposit only) 2FA, Cold storage, PoR Wide altcoin selection, IEO platform Bitstamp 0.30% (Maker), 0.40% (Taker) Institutional traders 70+ Full EUR support 2FA, Cold storage, Multi-sig wallet MTF license, Strong EU compliance 1. UEEx Overall: UEEx offers a wide range of digital assets, competitive fees, and innovative features for both beginners and experienced traders. UEEx provides a user-friendly platform for buying and selling over 200 cryptocurrencies and stocks. It supports various assets, from Bitcoin and leading altcoins to stablecoins, memecoins, and even privacy coins like DASH. Stock traders can access major US and Hong Kong stocks. UEEx prioritises user security and privacy, offering features like 2,000 unique deposit addresses per user and compliance with regulatory standards. It also has innovative features like the UE Coin miner app and copy trading. Pros Cons Fees 2. Bybit Overall: Bybit, through its partnership with SATOS, is a strong choice for crypto traders in Belgium. Bybit is a popular cryptocurrency exchange catering to both beginners and experienced traders in Belgium. Through a partnership with SATOS, a regulated crypto service provider in Belgium, Bybit offers Belgian users regulatory compliance, fiat support for euro deposits and withdrawals, and access to over 300 cryptocurrencies. Bybit provides several features, including spot trading, derivatives trading with leverage, advanced charting, and various order types. It also offers a mobile app, copy trading, and trading bots. Pros Cons Fees 3. Binance Overall: Binance is a top choice for crypto traders in Belgium. Its extensive selection of cryptocurrencies, especially newer projects, makes it an attractive option for users seeking to diversify their crypto investment. After ceasing operations initially due to being at odds with the FSMA, Binance now operates fully in Belgium. It offers a vast selection of cryptocurrencies and trading pairs, competitive fees with discounts for BNB holders, and an advanced trading platform with charting tools and various order types. Read Also: 10 Largest Crypto Exchange Hacks You Should Know Users can access features like staking, DeFi integration, and NFT offerings. Binance also provides a user-friendly mobile app, educational resources, and a comprehensive knowledge base. Pros Cons Fees 4. Kraken Overall: Kraken is a highly reputable choice for crypto traders in Belgium, offering a secure platform with diverse features and a strong security track record. Kraken operates in Belgium through its European entity, Payward Europe Solutions Limited, ensuring compliance with local regulations. It provides different services, including exchanging crypto and fiat currencies, custodial wallets, and card payments. Kraken’s platform boasts a simple yet highly customisable interface. Users can tailor their trading experience by selecting and arranging the modules they need from a comprehensive list. This allows for a personalised and efficient workflow, all within an all-in-one interface for spot, margin, and staking activities, accessible via a user-friendly mobile app. Pros Cons Fees 5. Gate.io Overall: Gate.io is a solid choice for experienced traders seeking a wide selection of cryptocurrencies, especially lesser-known altcoins. Gate.io offers over 1,300 cryptocurrencies, providing access to a diverse range of digital assets, including many that are unavailable on other platforms. It also provides advanced trading features like margin trading, futures contracts, and an IEO platform. While Gate.io accepts around 50 fiat currencies, it does not currently offer fiat withdrawals. The platform boasts reasonable trading fees, but deposit fees can be high. Although Gate.io has implemented robust security measures, its interface can be complex and less user-friendly for beginners. Pros Cons Fees 6. Bitstamp Overall: Bitstamp is a reliable choice for Belgian traders seeking a secure and compliant platform with access to more sophisticated financial products Bitstamp was acquired in 2018 by NXMH, a Belgium-based investment company. This acquisition, along with Bitstamp’s recent MiFID Multilateral Trading Facility (MTF) license, demonstrates its commitment to the European and Belgian markets. The license enables Bitstamp to offer a wider range of financial products, including crypto derivatives like perpetual swaps, and potentially stocks, commodities, and bonds in the future. Bitstamp differentiates itself through its strong ties to Belgium and expansion into regulated derivatives trading. It also offers a user-friendly interface with advanced charting and order types, making it suitable for beginners and experienced traders. Pros Cons Fees Why Use a Crypto Exchange in
Neural Network: A New Era In Crypto Technical Analysis
Cryptocurrency markets are known to be volatile. For traders, this volatility presents both opportunities and risks, making accurate predictions essential for success. Traditional technical analysis tools, such as moving averages or relative strength index (RSI), have been used to analyze these price movements, but they often fall short of predicting complex patterns in an unpredictable market. This is where neural networks, a subset of artificial intelligence (AI), come into play. Neural networks can process vast amounts of historical price data, detect intricate patterns, and improve prediction accuracy. In this article, we’ll explore how neural networks can transform crypto technical analysis. We’ll analyze the mechanics of neural networks and their applications in cryptocurrency trading. Key takeaway The Role of Technical Analysis in Cryptocurrency Trading(overview) Source:One trading Technical analysis is a popular way to predict price changes in both traditional finance and cryptocurrency markets by looking at past data. The main idea is that prices tend to move in patterns that can be spotted and repeated over time. Traders use tools like trend lines, moving averages, and indicators like the Relative Strength Index (RSI) to make informed guesses about where prices might go next. In cryptocurrency, this method is especially useful because trading happens 24/7, causing prices to change quickly. Many traders use this method a lot because it’s based on easy-to-find information—charts and past prices—that anyone can access, no matter their skill level. However, even though it’s widely used, traditional technical analysis makes a few assumptions that might not always work in the fast-moving and unpredictable world of cryptocurrency Limitations of Traditional Technical Analysis Technical analysis has been a key strategy in trading for decades, and its limitations include The Need for Advanced Methods As cryptocurrency markets grow, it’s becoming clear that traditional technical analysis might not be enough anymore. Newer methods like neural networks and machine learning are changing how we look at crypto analysis. These methods use past price data, news, and even social media to make more accurate predictions about price changes. The same limitations do not bind these advanced tools as is the case with traditional technical analysis. They adapt to new data in real-time, making them ideal for the 24/7 nature of cryptocurrency trading. This allows traders to make more informed decisions, reducing the risk of relying on outdated models in a rapidly evolving market. Traditional technical analysis has worked well for traders in the past, but the fast-changing and unpredictable crypto markets now need more advanced tools. Neural networks and AI-based methods are becoming important for the future of crypto analysis, helping traders deal with the uncertainty in this ever-changing market. What Are Neural Networks? Source: Treton system Neural networks, inspired by the structure and function of the human brain, are a key component of artificial intelligence (AI) and machine learning (ML). These networks consist of interconnected layers of nodes, called neurons, which process and analyze data to make predictions or decisions. Neural networks, first used in areas like image and speech recognition, are now being used in financial markets, including cryptocurrency trading, to find hidden patterns in large amounts of data. Since crypto markets run 24/7, fast and smart systems like neural networks are very important. They can look at past data, spot trends, and learn from how the market behaves, making them a helpful tool for traders to make better decisions and predict future prices. Basic Concepts of Neural Networks At their core, neural networks consist of three types of layers: an input layer, one or more hidden layers, and an output layer. The neurons in these layers are connected by weights, which represent the importance of signals traveling from one neuron to another. During training, the network adjusts its weights to reduce errors and improve accuracy. This is usually done through a process called backpropagation, which helps the network learn by updating the weights to make better predictions. Once the network is trained, it can be used to make real-time decisions, like predicting price trends or spotting unusual patterns in trading. How Neural Networks Mimic the Human Brain Neural networks mimic the structure and function of the human brain, particularly the way biological neurons communicate. Just as neurons in the brain transmit signals across synapses, artificial neurons (nodes) transmit information through connections (weights). When enough input signals (data) are processed, the neuron “fires” and transmits a signal to the next layer. The most striking resemblance between artificial and biological neural networks is their ability to learn from experience. In humans, learning is driven by experience, and over time, the brain adjusts its neural pathways to optimize performance. Similarly, artificial neural networks “learn” by being trained on historical data. Through a series of adjustments to their weights, neural networks become better at tasks like prediction or classification, refining their internal processes much like the brain does. This capacity for learning and adaptation makes neural networks highly effective at handling the complexities of cryptocurrency markets. Types of Neural Networks There are several types of neural networks, each designed for specific tasks and structured differently to address particular types of problems. Feedforward Neural Networks (FNNs) Feedforward neural networks are the most basic type of artificial neural network. In FNNs, information moves in one direction—from the input layer to the output layer—without looping back. Each neuron in a layer is connected to every neuron in the next layer, and data flows sequentially. These networks are often used for tasks where a fixed input size is mapped to a specific output, such as price prediction or classification problems. In cryptocurrency trading, FNNs can be employed to predict short-term price movements by analyzing historical price data. However, FNNs are limited when it comes to sequential data or data that relies heavily on context, as they don’t have memory capabilities. Recurrent Neural Networks (RNNs) Recurrent Neural Networks (RNNs) are built to work with data that follows a sequence, making them great for tasks that need time-based information. Unlike other types of networks, RNNs have loops that let past
Best Crypto Exchanges in Guatemala (2025)

Not many people trade cryptocurrency in Guatemala, but things are starting to change. The number of people getting into crypto is growing slowly but surely. In 2025, it’s expected that around 442,000 people in the country will be using cryptocurrency. This shift is a sign that more and more Guatemalans are discovering the opportunities the digital currency market offers. With this in mind, choosing the proper exchange is key if you consider jumping into crypto. We know you have preferences regarding what matters most in your trading experience. Consider prioritizing security or finding an exchange that offers the lowest fees. Whatever it is, we’ve covered you with the best options. Key Takeaway Top Crypto Exchanges in Guatemala (2025) Exchange Trading Fees Best For Max Leverage Available Assets Fiat Support – Guatemalan Quetzal (GTQ) Security Features Unique Features UEEx Spot Trading: 0.09% Futures Trading: 0.05%Margin Trading: 0.08 % – 0.10% Stock Trading: 1.50% Best Overall 200x 300+ No $100 risk mitigation funds2000 unique wallet addresses93% of users’ assets in cold storageProof of Reserve Supports US & HK-listed stocksFee discounts and staking rewards through its native token, $UE.Copy trading and auto-invest SpectroCoin Charged when you fill an order. Wide Variety of Payment Methods N/A 50+ Yes KYCTwo-factor authenticationSecure multi-currency wallet Blockchain and Multicurrency WalletFeature to link assets to a dedicated IBAN Crypto-backed loans Bitget Spot Fees: 0.100% / 0.100% maker/taker fee Futures Trading: 0.020% / 0.060% maker/taker fee High Liquidity and Seamless Trading 125x 450+ Yes Protection Fund1:1 proof of reservesoffline cold storage Bitget’s copy trading options for spot, futures, and bots.Web3 wallet, cross-chain swap, and NFT marketplace Kraken Spot Trading Fees: 0.25% / 0.40% maker/taker (lower fees for higher trading volumes)Futures Trading: 0.0200% / 0.0500% maker/taker (lower fees for higher trading volumes) Crypto and NFT 50x 200+ No Utilizes cold storage and two-factor authentication (2FA) Automated staking (up to 12% APR)Dedicated Kraken wallet Changelly 0.25% for crypto exchanges Great Exchange Rate 10x 700+ Yes KYC Better rates and discounts for first-time usersChangelly PayIntegrates with trusted wallets like Exodus, Ledger, and Trezor for secure transactions. Bit2Me 0.60% / 0.50% taker/maker Safest, Easiest, and Most Complete Cryptocurrency N/A 340+ Yes ISO 22301 and ISO 27001 security certificationsCold Storage Bit2Me wallet, which secures assets.Pro trading toolsCrypto-backed loans UEEx – Best Overall Crypto Exchange UEEx makes trading easy for you, whether you’re just starting or have some experience in the crypto world. With over 300 cryptocurrencies and 230+ trading pairs, you’ll have plenty of options to explore. You can trade spots or use perpetual futures with deep liquidity for more advanced strategies. Plus, you can access U.S. and HKEx-listed stocks, giving you even more investment opportunities. UEEx also offers crypto loans, copy trading, and strategy trading, making it a flexible platform for all users. Their app, with 24/7 customer support, ensures you’re always taken care of. With low fees, a strong focus on privacy, and 93% of user funds stored in cold storage, UEEx is a top choice for Guatemalans looking for a reliable, secure exchange. Pros Cons Fees and Deposits SpectroCoin – Best Exchange With Wide Variety of Payment Methods SpectroCoin is one of the best options for cryptocurrency trading in Guatemala in 2025, offering various payment methods to suit your needs. Whether you prefer bank transfers, credit or debit cards, or even mobile top-ups, SpectroCoin makes buying Bitcoin and other cryptocurrencies easy. Plus, you can store your digital assets securely with their blockchain wallet or manage multiple currencies through their multicurrency wallet. For those looking for more flexibility, SpectroCoin offers a dedicated IBAN to help you withdraw and receive funds in your name. Read Also: 10 Largest Crypto Exchange Hacks You Should Know You can also exchange your crypto for euros and use a Visa debit card to make payments worldwide. With low loan minimums and crypto loans available, SpectroCoin truly caters to a wide range of needs for users in Guatemala. Pros Cons Fees and Deposits Bitget – Best for High Liquidity and Seamless Trading Founded in 2018, Bitget has grown into one of the largest crypto copy trading platforms, with over 45 million registered users worldwide. If you’re in Guatemala and looking for an exchange with high liquidity and multiple trading options, Bitget is a solid choice. It supports over 450 assets and over 140 fiat currencies, making it easy to buy and sell crypto using USD, credit or debit cards, and P2P trading. For traders who want flexibility, Bitget offers spot, margin, and futures trading with USDT, USDC, and cryptocurrency settlements. You can also automate trades using grid bots or copy experienced traders. If you’re into long-term investing, Bitget provides savings, crypto loans, and other financial tools to grow your holdings. With strong asset protection and proof of reserves, Bitget ensures your funds are secure while you trade. Pros Cons Fees and Deposits Kraken – Best Exchange for Crypto and NFT Kraken is a great choice if you’re looking for a reliable crypto exchange in Guatemala. With over 10 million users worldwide, it offers access to more than 200 cryptocurrencies, including Bitcoin, Ethereum, Dogecoin, and Cardano. You can fund your account using cash, cards, or crypto, making it easier to start trading. Security is a priority, with features like cold storage and two-factor authentication (2FA) to keep your funds safe. Kraken also supports NFT trading, provides 24/7 customer support, and offers staking rewards of up to 12% APR, making it a solid option in 2025. Pros Cons Fees and Deposits Changelly – Best Crypto Exchange With a Great Exchange Rate Changelly is a great option if you’re looking for a fast and cost-effective way to buy Bitcoin and other cryptocurrencies in Guatemala. Launched in 2015, it supports over 500 cryptocurrencies and connects to over 20 trading platforms to offer competitive exchange rates. Transactions are quick, often taking less than 10 minutes, and you can start buying Bitcoin with as little as $5 using your credit or debit card. You can also access 20+ payment methods, including Visa, MasterCard, SEPA transfers, and Apple Pay.
Beyond Candlesticks: Point and Figure Charting in Crypto
Long before computers and real-time data, traders analyzed markets with a simple yet powerful tool called point and figure charting. This simple technique distills price action into Xs and Os and has proved its value over the centuries. This simplicity makes the chart appealing to crypto traders who work in a highly volatile environment. By focusing on significant price movements alone, point and figure charts reveal the true essence of market trends. With such clarity, traders are empowered to make more confident decisions, identify key support and resistance levels, and anticipate potential breakouts or reversals. What exactly is the point and figure charting technique and how does it work? How can crypto traders use it to predict market movements more accurately and make more profit? This article will reveal the answers. Read Also: Mastering Crypto Chart Patterns for Profitable Trading Key Takeaways What is Point and Figure Charting? Image by IncredibleCharts Point and figure charting, often shortened to P&F charting, is a unique charting method that differs from traditional time-based charts like candlestick or bar charts. Unlike these charts, P&F charting doesn’t consider the passage of time; instead, it focuses exclusively on price changes. It’s a minimalist approach that filters out unnecessary noise, allowing traders to concentrate on price action. For example, if the box size is set at $100, each “X” would represent a $100 increase in price, and each “O” would denote a $100 decrease. The chart evolves as the price fluctuates. A new column of X’s is created when the price rises by the reversal amount (a predetermined threshold, often three times the box size). Conversely, a new column of Os is formed when the price drops by the reversal amount. This creates a visual representation of price action that highlights significant movements while filtering out minor fluctuations. This unique approach offers a clear and uncluttered view of price trends, support and resistance levels, and potential breakouts or reversals. By focusing solely on price, P&F charting can help traders cut through the noise and identify key turning points in the market. How Will Point and Figure Charting in Crypto Work? Image by Trading View Point and figure charting in crypto may seem a bit unusual at first glance, but its construction and interpretation are surprisingly straightforward. Let’s look at the key elements and understand how these charts work Key Elements of the P&F Charting The fundamental units of a point and figure chart are boxes and reversal points. Boxes Each box on the chart represents a price movement of a specific magnitude, determined by the chosen box size. For example, if the box size is set at $75 for Bitcoin, each box on the chart would represent a $75 change in price. Reversal Points The reversal amount or reversal point is another important parameter in P&F charting. It defines the threshold at which the price needs to change direction to trigger the creation of a new column of Xs or Os. The reversal amount is typically set at a multiple of the box size, often three times. So, in our Bitcoin example with a $75 box size, the reversal amount would be $225. Constructing the Chart Image by Commodity.com Now, let’s see how these boxes and reversal points come together to form a point and figure chart. Rising Prices, Rising Xs When the price of the asset increases by at least one box size, an “X” is plotted in the current column. If the price continues to rise, more Xs are added to the same column. Falling Prices, Falling Os When the price decreases by at least one box size, an “O” is plotted in a new column to the right of the previous one. If the price keeps falling, more Os are added to this new column. The Reversal Rule A new column is created only when the price reverses direction by the reversal amount. For example, if the price is rising and forming a column of Xs, a new column of Os will only be created if the price drops by at least three box sizes (the reversal amount). This process continues as the price fluctuates, creating a chart that visually tracks significant price movements while filtering out minor noise. Identifying Key Patterns and Signals Image by Julie Bang at Investopedia Once the chart is constructed, traders can analyze the patterns and formations to identify potential trading opportunities. Some common point and figure chart patterns include; Double Top and Double Bottom These patterns signal potential trend reversals. A double top, formed by two consecutive columns of Xs with a column of Os in between, suggests a potential price decline. Trend Lines Trend lines can be drawn on P&F charts to identify the prevailing trend and potential support and resistance levels. Breakouts A breakout occurs when the price moves beyond a previously established support or resistance level. In P&F charting, breakouts are often accompanied by a surge in volume, adding conviction to the move. How Does Point and Figure Charting Differ from Other Charting Types? Point and figure charting in crypto focuses on price action in a way that no other popular charting methods, such as candlestick or bar charts, can. There are a few distinctive features that make P&F charting invaluable for crypto traders. Time vs. Price Focus Traditional time-based charts, like candlestick or bar charts, plot price data along a horizontal time axis. Each candlestick or bar represents a specific period, such as a day, hour, or minute. A new column is only created when the price moves by the reversal amount, filtering out insignificant price movements and providing a cleaner, more focused view of the market. This can be particularly beneficial in the volatile crypto market, where prices can fluctuate rapidly and create a sense of confusion on traditional charts. Clarity and Simplicity The minimalist nature of point and figure charts contributes to their clarity and simplicity. Using Xs and Os to represent price movements and the absence of time-based elements creates
A Full Guide to Head and Shoulders Pattern for Traders

Technical analysts employ a wide range of techniques to identify turning points on charts, utilizing indicators, patterns, and historical support and resistance levels. While indicators are widely favored, chart patterns offer an added advantage due to their direct correlation with price movements. These patterns not only provide insight into potential future price direction but also offer valuable guidance on key elements like stop-loss placement and target levels for trades. The head and shoulders pattern is one of the most well-known chart formations in technical analysis. It helps traders to identify potential reversals in the trend of a stock, currency, or cryptocurrency. In this guide, we’ll explore the Head and Shoulders pattern, how to recognize it, its significance in the market, and how traders can effectively use it in their strategies. Key Takeaways What is the Head and Shoulders Pattern? Source: Pinterest This is a reversal chart pattern that signals a change in the direction of a trend, typically from bullish to bearish or vice versa. This pattern is characterized by a baseline with three peaks, where the two outer peaks are similar in height, and the middle peak is the highest. This head and shoulder forms when a digital asset’s price ascends to a peak (the first shoulder) and then falls back to the base of the previous upward movement. The price then climbs higher to form the “head,” surpassing the initial peak, before declining again to the baseline. Lastly, the price rises again, reaching approximately the same level as the first peak, creating the second shoulder, before descending. The head and shoulders pattern has long been recognized as a dependable indicator of trend reversal. However, it’s important to note that this pattern is not flawless as it also has some limitations. According to a Grand View Research study, the global market is projected to expand at a compound annual growth rate (CAGR) of 12.5% by 2030. This means understanding this pattern puts you in a ripe position to profit from your trades. Types of Head and Shoulders Patterns There are two primary types of head and shoulders patterns: Bearish Head and Shoulders Pattern (standard) Source: Pinterest This image above effectively illustrates the three distinct components of the head and shoulders pattern: two shoulder areas and a head, through which the price moves, indicating a potential market reversal. The first “shoulder” forms after a significant bullish phase, where the price rises and then dips into a trough. The “head” is created when the price rises again, forming a peak exceeding the first shoulder. Following this, the price declines, forming the second shoulder, which typically mirrors the appearance of the first. Notably, the decline at this stage does not usually dip significantly below the level of the first shoulder before experiencing a minor retracement or a sideways movement in the price. The completion of the pattern, signaling a potential market reversal, occurs when the price declines again, breaking below the neckline. The neckline, as shown in the image, is the horizontal line that connects the two troughs from the first and second shoulder formations. Traders use this pattern to identify opportunities to short the market or take profits. For example, in 2021, Bitcoin exhibited a clear Head and Shoulders pattern after its meteoric rise to $64,000. The left shoulder formed in February, followed by the head in April, and the right shoulder in May. When the price broke below the $30,000 neckline, Bitcoin saw a dramatic price drop, confirming the bearish reversal. Inverse Head and Shoulders Pattern Source: Pinterest These patterns can also develop in the opposite direction, indicating a reversal from a bearish to a bullish trend. This variation is known as an inverse head and shoulders pattern, which is essentially the same concept flipped upside down. The inverse pattern signals a shift from a downtrend to an uptrend. In an inverse head and shoulders formation, stock prices decline into three troughs, with brief rallies separating each low. The middle trough, which represents the “head,” is the deepest, while the two “shoulders” are shallower. Once the second shoulder forms, the price typically rallies again, breaking through the neckline, which suggests that the downtrend has reversed and bulls may be gaining control of the market. For example, in early 2023, Ethereum formed an inverse Head and Shoulders pattern. After months of bearish price action, the pattern was confirmed in June when the price broke above the $1,800 neckline. Ethereum then surged, reaching new yearly highs of $2,281 by the end of the year. Key Components of the Head and Shoulders Pattern Source: Pinterest The pattern is widely regarded as the most popular reversal pattern among traders. It gets its name because it resembles a baseline with three peaks, where the middle peak is the tallest, forming what looks like a “left shoulder,” “head,” and “right shoulder.” Both the standard head and shoulders pattern and the inverse head and shoulders pattern are reversal formations that signal a change in trend direction. These patterns are characterized by these key components: Head: In the traditional pattern, the head is the highest peak, while in the inverse version, it’s the lowest trough. The head should stand above (or below, in the inverse case) the two surrounding peaks. Shoulders: These are the two smaller peaks that sit on either side of the head, referred to as the left and right shoulders. The left shoulder formation is the first peak, which is followed by a price decline. On the other hand, the right shoulder peak is lower than the head and is followed by a final decline. Ideally, the shoulders should be symmetrical, meaning they are at roughly the same price level. However, since perfectly symmetrical patterns are rare, slight variations in height between the two shoulders are acceptable, as long as the difference isn’t too large. Neckline: This is the trendline that connects the bottoms of the two shoulders. It’s considered the most critical aspect of the pattern because a break of the neckline confirms
A Simple Guide to Understanding Volume Rate of Change (VROC)
You might not know this but the broader trading market can see price fluctuations as high as 25% within a single day. This intense volatility presents both a challenge and an opportunity for traders aiming to take advantage of swift market shifts. However, one technical tool that traders can rely on is the Volume Rate of Change (VROC). This technical analysis tool helps traders assess market momentum by measuring the percentage change in trading volume over a specified period. Essentially, understanding VROC can help traders anticipate potential price reversals, breakouts, or the continuation of trends, giving them a competitive edge in decision-making. In this article, we’ll explore how VROC works, its calculation, key use cases, and strategies for incorporating VROC into a trading plan. Read Also: How to Use On-Balance-Volume (OBV) in Crypto Trading Key takeaways What is Volume Rate of Change (VROC)? In trading, the Volume Rate of Change (VROC or Volume ROC) is a momentum indicator that tracks the rate of volume change over a specific period. According to various studies and industry observations, it is estimated that around 80% to 90% of day traders eventually quit within their first year. One of the major reasons is the lack of clear trading strategies. However, this doesn’t have to be your case as the knowledge of VROC can be a game changer. The technical indicator helps traders identify shifts in market sentiment and evaluate the strength or weakness of price movements through fluctuations in trading volume. Additionally, VROC functions as a momentum oscillator, fluctuating around a zero line. Positive values indicate an increase in volume compared to the previous period, while negative values suggest a decrease. Furthermore, this indicator is valuable for predicting price movements and confirming price trends, as it is closely linked to the Price Rate of Change (ROC), which measures the rate at which an asset’s closing price changes. By analyzing the volume shifts alongside price changes, traders can gain deeper insights into the strength of a trend or anticipate potential reversals. Moreover, unlike the price rate of change (Price ROC), VROC focuses on volume rather than price. By highlighting volume trends in either an upward or downward direction, traders can use this information to better analyze price action. How to Calculate VROC The Volume Rate of Change (VROC) indicator is generated by comparing the change in trading volume over a given period to the volume from a specified earlier trading session. To calculate the Volume Rate of Change (VROC), follow these steps: 1. Select a specific time period for analysis (e.g., 10 periods, 20 periods, etc.). 2. Subtract the trading volume from the chosen period ago from the current trading volume. 3. Divide the result by the trading volume from the same selected period ago. 4. Multiply the result by 100 to express the VROC as a percentage. Formula: VROC (%) = [(Current Volume – Volume n periods ago) / Volume n periods ago] * 100 This will give you the VROC, which indicates the percentage change in volume over the chosen period. For example, let’s assume you want to calculate the Volume Rate of Change (VROC) for a 5-period analysis, with the following data: Now, using the VROC formula: VROC = [(Current Volume – Volume 5 periods ago) / Volume 5 periods ago] * 100 = [(150,000 – 100,000) / 100,000] * 100 VROC = [50,000 / 100,000] * 100 = 0.5 * 100 VROC = 50% In this example, the Volume Rate of Change is 50%, indicating that trading volume has increased by 50% compared to the volume 5 periods ago. Furthermore, when plotting the Rate of Change (ROC) of volume on a chart, two lines are displayed. For example, in the chart above, number 1 (green) represents the Volume ROC line, while number 2 (red) represents the Average of the Volume ROC line. If the Volume ROC line is above the average line, it signifies an increasing volume trend, indicating a strong trend. Basically, a bullish price trend is indicated when the Volume ROC line is above its average line, while a bearish trend is identified when the price trend is downward but the Volume ROC line remains above its average line. Optimal VROC Settings Choosing the right period for VROC calculations is essential to balance sensitivity and reliability. Common settings include: While shorter VROC settings are more sensitive, they are also prone to noise and false signals. Conversely, longer settings provide more stable signals but may lag behind rapid market changes. Importance of Volume in Trading Volume is one of the most critical aspects of technical analysis. While price movements indicate market direction, volume confirms the strength of that movement. A price move supported by high volume is often considered more significant and likely to continue, whereas a move on low volume may lack momentum and could reverse. For instance, many breakouts from key moving average indicators, such as the death cross, often come with a significant increase in trading volume. This is because crossing such a critical technical level prompts many traders to adjust their positions at the same time. However, if a death cross or similar price-based indicator is not accompanied by a sharp increase in volume, it suggests that a breakout in price is less likely to occur. On the other hand, periods of low trading volume can still lead to sharp price movements, as even small trade orders can significantly impact the price due to limited liquidity. As a result, many trading strategies incorporate one or more volume indicators alongside price indicators to confirm or invalidate a trading signal derived from price analysis. High Volume: Suggests strong buying or selling pressure, often accompanying major price shifts. Low Volume: Implies market indecision or consolidation. By focusing on the VROC, traders can better gauge whether a trend is likely to continue or reverse based on the changing level of market participation. How VROC Enhances Trading Strategies VROC helps traders assess whether volume trends align with price trends, offering