Citi Forecasts $BTC at $143,000 Over the Next 12 Months, Citing Rising Adoption and Easing Crypto Regulation

Bitcoin could be heading for a fresh all-time high over the next year, according to a new forecast from Wall Street giant Citi, as institutional adoption deepens and regulatory clarity improves in the United States. In a 12-month outlook released this week, Citi analysts set a base-case price target of $143,000 for Bitcoin, representing a significant upside from its current market level. The bank also outlined a wide range of possible outcomes, with a bullish scenario placing BTC above $189,000, while a bearish case sees prices retreating to around $78,500. As of Friday, Bitcoin was trading near $89,000, roughly 30% below its late-October peak. The pullback followed heavy outflows from spot Bitcoin exchange-traded funds (ETFs), although Citi notes that ETF flows have stabilized in recent weeks. ETFs and Regulation Drive Citi’s Bitcoin Thesis Citi’s forecast is anchored on the continued institutionalization of Bitcoin, particularly through ETFs, which have become a major gateway for traditional investors. “Our forecasts, in particular for bitcoin, rest on an assumption that investor adoption continues with flows into ETFs of $15 billion boosting token prices,” the analysts wrote, led by Alex Saunders, Citi’s head of global quant macro strategy. Beyond capital flows, regulatory developments are also playing a central role in the bank’s outlook. Citi highlighted ongoing discussions in the U.S. Senate around its version of the Clarity Act, legislation that would formally place Bitcoin under the oversight of the Commodity Futures Trading Commission (CFTC). Such a move, the analysts argue, could reduce regulatory uncertainty and encourage broader participation from institutional investors. The downside scenario, however, reflects broader macroeconomic risks. Citi said its bear case is driven by “recessionary macro-factors,” which could weigh on risk assets, including cryptocurrencies. Ethereum Seen With Limited Upside While Bitcoin received a largely optimistic assessment, Citi struck a more cautious tone on Ethereum. The bank set a $4,300 base-case target for ETH, which suggests more limited upside compared to Bitcoin’s projected gains. At the time of the report, Ethereum was trading around $2,959. Citi attributed its more conservative outlook to weakening network activity and Ethereum’s reliance on usage rather than scarcity. “ETH is sensitive to activity given its potential use as programmable money rather than Bitcoin’s ‘store-of-value’ narrative,” the analysts noted, adding that on-chain activity has “declined significantly.” Market Implications Citi’s projections arrive at a time when crypto markets are reassessing momentum following a strong rally earlier in the year. While near-term volatility remains, the bank’s outlook underscores a growing belief among major financial institutions that Bitcoin’s role within traditional portfolios is strengthening, especially as regulatory guardrails begin to take shape. If ETF inflows and regulatory progress continue as Citi expects, Bitcoin’s next major move may be driven less by retail speculation and more by institutional conviction.
BTC Has Become Less Volatile Than Nvidia Stock in 2025, With Bitwise Citing BTC’s Market Maturation
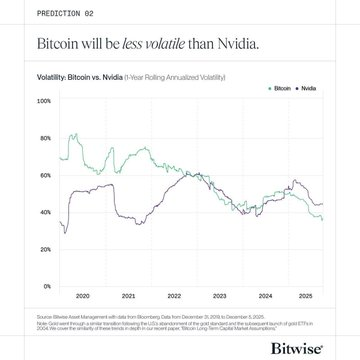
Bitcoin is showing signs of something few investors would have predicted just a few years ago: calmer price behavior than one of the world’s most actively traded technology stocks. According to a new report released Wednesday by asset manager Bitwise, Bitcoin (BTC) has become less volatile than Nvidia (NVDA) in 2025, a development the firm attributes to the cryptocurrency’s growing maturity and a broadening investor base. Bitwise expects this trend to persist through 2026, marking what it describes as a structural shift in how Bitcoin trades. Key Takeaways Bitcoin Volatility Falls Below Nvidia’s Volatility has long been one of Bitcoin’s defining traits, often exceeding that of equities and even high-growth technology stocks. That relationship has now flipped. Bitwise data shows Bitcoin’s price moved roughly 68% between its 2025 low near $75,000 in April and its all-time high of $126,000 in early October. Over the same period, Nvidia shares recorded a far sharper swing of about 120%, climbing from around $94 to a peak near $207. Bitwise says this crossover is not a short-term anomaly. “Bitcoin’s volatility has steadily declined over the past ten years,” the firm noted, describing the trend as a clear sign of “derisking” as the asset integrates more deeply into traditional financial markets. Despite Nvidia’s higher volatility, its stock has delivered stronger performance this year, rising roughly 27% year-to-date. Bitcoin, by contrast, is down about 8% since the start of 2025, reflecting a period in which crypto markets have increasingly decoupled from equities. Institutional Access Is Changing How Bitcoin Trades At the center of Bitcoin’s calmer price action is institutional adoption. Bitwise argues that regulated investment vehicles, particularly spot Bitcoin exchange-traded funds, have reshaped market dynamics by bringing in a different class of investor. “The rise of ETFs and other traditional vehicles has expanded Bitcoin’s investor base beyond retail traders and crypto-native funds,” Bitwise said. This diversification has helped absorb large buy and sell orders that once caused sharp price dislocations. Instead of reacting violently to leverage-driven speculation or narrative shocks, Bitcoin is increasingly influenced by longer-term capital allocations and portfolio strategies. Bitwise added that traditional drivers of extreme crypto cycles, including heavy leverage and abrupt reactions to halving events, are becoming less dominant as institutional liquidity deepens. Long-Term Holder Selling Nearing Exhaustion Supporting the view of a stabilizing market, separate research from K33 suggests that a major source of sell-side pressure may be close to running its course. According to the research and brokerage firm, long-term Bitcoin holders have sold approximately 1.6 million BTC over the past two years, worth an estimated $138 billion. K33 head of research Vetle Lunde said the scale of these movements points to intentional profit-taking rather than technical factors such as wallet restructuring or ETF-related transfers. The firm noted that both 2024 and 2025 rank among the largest years on record for long-term supply reactivation. Crucially, this selling has been absorbed by what K33 describes as “deeper institutional liquidity,” suggesting that the market’s capacity to handle large distributions has improved significantly. Looking Ahead to 2026 Bitwise views Bitcoin’s reduced volatility as a foundation for its next phase rather than a ceiling on upside. The firm expects Bitcoin to reach a new all-time high and move beyond the historical four-year boom-and-bust cycle that has defined previous market phases. It also forecasts further institutional participation in 2026, naming major financial institutions such as Citigroup, Morgan Stanley, Wells Fargo, and Merrill Lynch as potential entrants into the crypto space. “This is a structural shift, not a temporary phase,” Bitwise said, emphasizing that Bitcoin’s changing behavior reflects who owns it and how it is traded. For a market once defined by extreme swings and speculative excess, Bitcoin becoming less volatile than Nvidia marks a notable turning point. Whether that stability attracts even more conservative capital may shape the asset’s trajectory heading into 2026.
Ethereum’s Exchange Supply Has Fallen to Its Lowest Level Since 2016
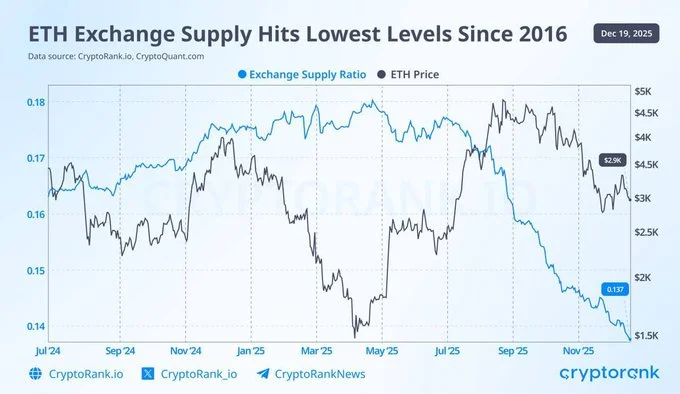
Ethereum is experiencing one of its most significant supply contractions in nearly a decade. Data from on-chain analytics platforms shows that the amount of ETH held on centralized exchanges has fallen to its lowest point since 2016, a period when Ethereum was still in its early growth phase. The decline points to reduced short-term sell pressure as more holders move ETH into long-term storage, staking contracts, and institutional treasuries. According to CryptoQuant, Ethereum’s exchange balance ratio has dropped to approximately 0.137, underscoring how much of the circulating supply is now sitting off exchanges. This shift reflects growing caution among traders and rising conviction among long-term holders who appear increasingly unwilling to sell at current prices. “Ethereum’s exchange supply has fallen to levels not seen since 2016, signaling a significant tightening in the available ETH for trading.” Structural Supply Shift Driven by Staking and Institutions A major contributor to this supply squeeze is Ethereum’s staking ecosystem. More than 37 million ETH is now locked in staking, effectively removing a large portion of supply from active circulation. Staked ETH cannot be sold instantly, which limits immediate liquidity and amplifies price sensitivity when demand increases. At the same time, institutional and corporate accumulation has accelerated. Public data shows that 27 public entities now collectively hold an estimated $17.7 billion worth of ETH, equivalent to roughly 5.96 million ETH. These holdings are typically long-term strategic positions rather than short-term trades, further reducing sell-side pressure. “Over 37 million ETH is locked in staking, while 27 public entities hold $17.7 billion in ETH, signaling a structural shift in Ethereum’s supply dynamics.” One of the most notable recent accumulations came from BitMine Immersion, which reportedly added more than 400,000 ETH to its balance in the last 30 days. Moves of this scale highlight how corporate treasuries are increasingly viewing ETH as a long-term asset rather than a speculative trade. Liquidity Tightening Raises Volatility Risk While shrinking exchange balances often support price appreciation, they can also increase volatility. With less ETH readily available for trading, even modest changes in demand can lead to sharper price movements in either direction. This dynamic has appeared in previous market cycles, where similar supply contractions were followed by explosive rallies once demand picked up. Historical data suggests that Ethereum’s past exchange supply drawdowns often preceded strong upside moves, especially when accompanied by rising institutional participation. Analysts note that today’s environment differs from earlier cycles, as staking, ETFs, and corporate holdings now play a much larger role in shaping supply behavior. Layer-2 networks such as Base and Arbitrum are also absorbing ETH liquidity. As ETH is bridged and locked into scaling solutions, it becomes less accessible for spot trading, reinforcing the broader trend of declining liquid supply. Market Structure and Technical Outlook As of December 2025, Ethereum is consolidating around the $3,090 level. Despite short-term volatility, the broader market structure remains intact, with ETH still forming higher lows compared to its 2022 cycle bottom. Trading volume has remained robust, hovering around $11.5 billion, suggesting that market participation remains strong even as liquid supply tightens. Technical indicators present a mixed picture. Momentum signals such as the MACD and RSI point to ongoing consolidation, while price action shows ETH trading below some key daily moving averages. A sustained move above the $3,000–$3,100 range could strengthen the short-term outlook, while holding former resistance near the $3,800–$4,000 zone would reinforce the longer-term uptrend. Some analysts continue to project higher price targets based on historical impulse patterns, arguing that reduced supply combined with renewed demand could push ETH significantly higher over time. What the Supply Squeeze Means Going Forward Ethereum’s declining exchange supply reflects more than just short-term market behavior. It signals a deeper transformation in how ETH is held and used. With over 30% of total supply staked and a growing share locked in institutional treasuries, Ethereum is becoming structurally less liquid than in previous cycles. “This surge in institutional accumulation adds a new layer of demand not seen in earlier cycles, reducing the likelihood of sudden sell-offs.” For investors, this environment creates both opportunity and risk. Lower liquidity can magnify upside during demand surges, but it can also intensify drawdowns if sentiment turns negative. Monitoring institutional flows, ETF activity, and staking trends will be crucial in assessing Ethereum’s next major move. While short-term technical signals remain mixed, the underlying supply dynamics suggest Ethereum is entering a phase where scarcity, rather than speculation alone, may increasingly drive price action.