
Bitcoin just recorded one of its most severe momentum breaks of the current cycle, with on-chain indicators now flashing levels of stress and capitulation not seen since the 2022 FTX meltdown.
The sudden shock in market structure has left traders rattled, liquidity thin, and sentiment on edge as BTC struggles to stabilize above the mid $80,000 range.
A Breakdown Few Expected This Cycle
Bitcoin’s sudden fall to $80,524 on Friday stunned a market that had grown accustomed to a steady, if sometimes choppy, uptrend. The drop erased all year-to-date gains and pushed BTC more than 35% below its all-time high, reawakening fears of a deeper correction.
The bounce to $84,000–$85,000 since then has offered some relief, but volatility remains elevated and the market’s tone has shifted dramatically.
Several traders describe the environment as “fragile,” with BTC trading more than 3.5 standard deviations below its 200-day moving average—a deviation seen only during:
- The late-2018 capitulation
- The March 2020 pandemic crash
- The June 2022 Three Arrows/ Luna breakdown
Each of those episodes followed extreme fear, forced unwinding, and exhaustion. This week’s behavior fits that pattern almost perfectly.
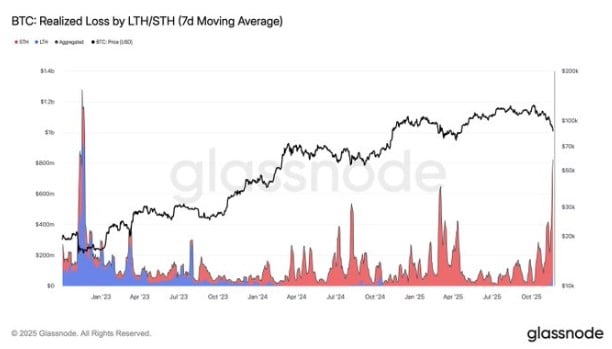
Realized Losses Surge to FTX-Era Levels
On-chain data confirms the chaos. Glassnode shows realized losses—coins being sold at a loss compared to their last on-chain movement—spiking to levels last recorded during the November 2022 FTX collapse.
Short-term holders (STHs), meaning wallets that bought within the last 90 days, are driving nearly all of this. They are exiting aggressively as BTC trades below major trend levels. Their realized-loss dominance has surged into a zone typically seen during outright panic.
This capitulation-like behavior is what pushed Bitcoin so sharply under its trendline support.
Momentum Traders Step Aside
The market’s internal structure deteriorated rapidly:
- Funding rates collapsed across futures markets.
- Spot sellers became the dominant force.
- Momentum traders—those who typically buy strength—simply evaporated.
- Liquidity vanished around key levels, accelerating the decline.
Independent analysts noted that the marginal buyer, who previously supported rallies, is no longer present. Without them, the market has been unable to generate sustained rebounds.
Questions Over What Triggered the Flush
Two competing explanations dominate trader conversations.
Macro Pressure Crushed Risk Assets
Hopes of imminent U.S. rate cuts faded this month. At the same time, AI stocks—leaders of the broader market—broke down sharply. Volatility jumped across equities and bonds. In that environment, highly leveraged markets like crypto were exposed.
The October 10 “Mechanical Glitch” Aftershock
Some analysts point to the October 10 event, when a so-called “mechanical glitch” involving a stablecoin price feed caused cascading liquidations. Nearly two million accounts were wiped out before platforms identified the error.
Tom Lee argued that the market has been “limping along” since that episode, with liquidity thin and traders on edge.
Adding to that, the October crash coincided with a surprise U.S. tariff announcement that sent shockwaves through global markets. More than $19 billion in leveraged positions evaporated within hours—one of the largest single-day liquidations in crypto history. The system has not fully recovered.
Claims of Deliberate Downward Pressure
Mike Alfred accused large players of pushing Bitcoin lower via derivatives. Lee publicly agreed. While difficult to prove, the nature of the move—fast, deep, and liquidity-driven—resembles prior episodes of aggressive positioning by whales and market-makers.
Approaching a Historically Meaningful Zone
Despite the chaos, some analysts see structural reasons for cautious optimism.
Bitcoin’s drop brought it into the $78,000–$82,000 zone of Giovanni Santostasi’s Bitcoin power-law model, a region that has historically produced mid-cycle bounces, not full-cycle bottoms. BTC has touched this zone multiple times in 2024, and each instance has attracted buyers.
However, analysts warn that without a macro catalyst—such as clearer rate-cut expectations or a surge in demand from ETFs—the market may remain unstable around these levels.
Supply Signals Show More Unwinding Ahead
Other on-chain supply indicators paint a cautious picture:
- The VDD Multiple is rising while price falls, showing that experienced holders are distributing, not accumulating.
- Long-term holder (LTH) supply is declining, indicating that even patient investors are taking chips off the table.
- Derivative markets have not hit classic “capitulation” extremes, suggesting the market may not be fully flushed out.
These signs imply the unwind is still in progress.
ing closes, they argue that dip-buying is no longer a reliable strategy.
Where the Market Stands Now
At the time of writing, Bitcoin trades around $84,977—well off the lows but still far below key trend levels. The structure remains damaged, sentiment remains fearful, and traders are preparing for more volatility.
Market positioning is approaching conditions historically associated with short-term bottoms, but structural recovery requires more than a bounce. The market needs returning liquidity, stronger demand, and a clear macro environment.
For now, Bitcoin sits at the intersection of washed-out short-term holders, stressed derivatives markets, and one of the deepest momentum breaks of this cycle. It could stabilize here—but until major levels are reclaimed, caution remains the dominant stance.


