Bitcoin is once again at the center of a high-stakes macro test, and early data suggests it is holding up better than many expected.
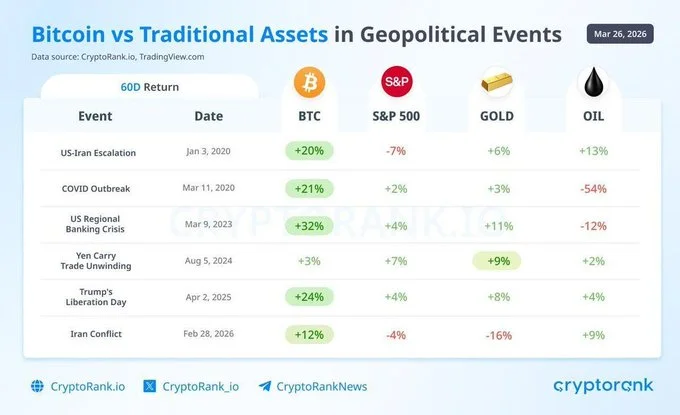
Fresh figures from CryptoRank indicate that across nearly every major geopolitical crisis in the past six years, Bitcoin’s 60-day returns have consistently outpaced traditional assets like equities, gold, and oil.
The latest conflict, which escalated on February 28 under what has been referred to as Operation Epic Fury, is following a similar pattern—though the underlying dynamics are more complex than the headline suggests.
Since the conflict began, Bitcoin has gained roughly 7%, while the S&P 500 has slipped, gold has declined by about 5%, and the MSCI World Index has dropped around 4%. On the surface, this appears to reinforce the long-debated “digital safe haven” narrative. But a closer look reveals that timing—not just resilience—is playing a crucial role.
Key Takeaways
Bitcoin has outperformed major traditional assets during recent geopolitical turmoil, but much of that strength stems from its earlier correction.
A 45% pre-war drawdown reset Bitcoin’s market structure, leaving it less vulnerable to immediate downside during the conflict.
Rapid recovery after initial sell-offs suggests strong demand or reduced selling pressure compared to equities.
Traditional safe havens like gold and the S&P 500 have underperformed due to elevated pre-crisis valuations and shifting macro conditions.
Oil prices and the Strait of Hormuz situation remain the dominant factors shaping near-term direction across all major asset classes.
A Different Starting Point
Bitcoin did not enter this crisis on equal footing with traditional markets. In fact, much of its correction had already taken place.
“Bitcoin fell from $126,000 in October to the mid-$60,000s by late February, a 45% drawdown over five months… the speculative excess… was flushed out before the first missile hit.”
That pre-war decline effectively reset the market. Excess leverage was unwound, weaker participants exited, and valuations normalized. By the time geopolitical tensions escalated, Bitcoin had already absorbed a significant portion of downside pressure.
Contrast that with the S&P 500 and gold. Both were trading near record highs before the conflict began, leaving them more exposed to sudden repricing. As a result, their recent declines may reflect delayed adjustment rather than outright weakness.
Resilience Under Pressure
Even after accounting for its earlier drawdown, Bitcoin’s behavior during the conflict has been notable.
The asset briefly dipped to around $63,000 in the immediate aftermath of the escalation but rebounded within 48 hours. Despite over $1 billion in crypto liquidations triggered by political developments in late March, Bitcoin has managed to hold above its pre-war lows.
“Bitcoin briefly dipped to $63,000 and recovered within 48 hours… it still has not taken out its pre-war lows.”
This rapid recovery contrasts sharply with equity markets, where the S&P 500 continues to trend lower, forming a pattern of lower highs. While Bitcoin still shows strong correlation with equities during sharp sell-offs—reaching as high as 89% during peak panic on March 19—its rebound profile suggests a different kind of market participation.
There are two possible explanations. One is simple exhaustion: sellers have already acted, leaving limited downside pressure. The other is more structural—new buyers entering the market with a longer-term view, potentially driven by concerns around monetary policy and currency debasement.
Traditional Safe Havens Underperform
Gold’s performance has been particularly surprising. Historically viewed as the go-to hedge during geopolitical instability, it has struggled in this environment.
Rising real yields appear to be diverting capital away from gold, weakening its appeal despite heightened global uncertainty. This shift highlights a broader change in how investors are positioning during crises, with some capital potentially rotating into alternative stores of value—including Bitcoin.
Meanwhile, the S&P 500 has entered a more technically fragile position.
“The S&P 500’s break below its 200-DMA after 214 sessions is a structural shift.”
Key resistance levels have formed in the 6,731 to 6,782 range, with major financial institutions projecting further downside in the event of sustained energy shocks. JPMorgan has flagged 6,000 as a near-term risk, while more severe scenarios could push the index significantly lower.
Oil: The Critical Variable
At the center of the current macro landscape is oil.
Brent crude has surged from around $70 to above $112, driven largely by disruptions linked to the Strait of Hormuz. The waterway remains a crucial chokepoint for global energy supply, and its status is shaping expectations across all major asset classes.
“Oil remains the key variable for all three assets, with the Strait of Hormuz dictating the Q2 outlook.”
The implications are straightforward. If supply constraints ease and oil prices retreat toward the $80–$85 range, risk assets could stabilize. In that scenario, the S&P 500 may attempt a recovery toward its previous resistance zone, Bitcoin could push above $75,000, and gold may regain momentum.
However, a prolonged disruption would reinforce stagflation concerns—slower growth combined with persistent inflation. That environment would likely pressure equities further and complicate the outlook for Bitcoin, particularly if expectations for interest rate cuts begin to fade.
A Question of Timing, Not Just Strength
Bitcoin’s outperformance in the current crisis is real, but it is not purely a story of strength.
“The outperformance… may say less about Bitcoin’s resilience and more about where each asset sat in its own cycle when the shock arrived.”
This distinction matters. Bitcoin had already undergone a significant correction, while traditional markets were still priced for stability. As a result, the same geopolitical shock produced very different outcomes across asset classes.
For traders and investors, this shifts the focus away from simple directional bets. Instead, the emphasis is increasingly on sequencing—understanding which markets have already priced in risk and which are still adjusting.
Divergence Creates Opportunity
The divergence between Bitcoin, equities, and commodities is becoming one of the defining features of the current market environment.
Bitcoin’s earlier repricing has positioned it differently from equities, which are now undergoing their own adjustment phase. At the same time, oil continues to act as the primary transmission mechanism, influencing inflation expectations, monetary policy outlooks, and overall risk sentiment.
This interconnected structure is creating opportunities that go beyond single-asset trades. Movements in oil feed directly into equities and indirectly into Bitcoin through liquidity conditions and policy expectations.
In that context, Bitcoin’s recent performance is not just a headline about outperformance—it is a signal about how market cycles, timing, and macro forces are interacting in real time.
The coming weeks will test whether this relative strength can hold. But one thing is already clear: Bitcoin is no longer behaving like a fringe asset during global crises. It is moving alongside, and sometimes ahead of, the world’s most established markets.
Akindele T. Francis is a versatile content writer with extensive experience spanning various sectors. Specializing in blog posts, website content, service pages, compelling sales copy, etc., Akindele has collaborated with numerous agencies to deliver engaging and effective written material. With a keen eye for detail and a passion for crafting impactful narratives, Akindele consistently exceeds client expectations, driving results and enhancing brand messaging across diverse platforms.
Disclaimer: This article is intended solely for informational purposes and should not be considered trading or investment advice. Nothing herein should be construed as financial, legal, or tax advice. Trading or investing in cryptocurrencies carries a considerable risk of financial loss. Always conduct due diligence before making any trading or investment decisions.