A green candle represents a period in which the price of a cryptocurrency has increased. It is commonly used in candlestick charts, which track price movements over specific time frames. Each candle consists of a vertical line and two horizontal lines. The vertical line shows the price range, while the horizontal lines indicate the opening and closing prices. In a green candle, the closing price is higher than the opening price, indicating positive market sentiment.Traders often analyze green candles to identify potential upward trends. A series of consecutive green candles can signal strong bullish momentum. Conversely, a single green candle in a downtrend may suggest a potential reversal.Overall, green candles help traders gauge market activity and make informed decisions based on price movements. Understanding these indicators can be crucial for effective trading strategies.
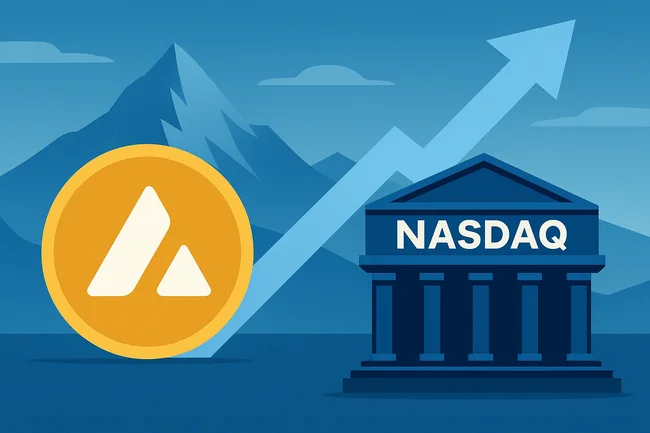
Avalanche Treasury Co. to Go Public in $675M Deal With Mountain Lake Acquisition
Avalanche Treasury Co. (AVAT), a digital asset treasury company aligned with the Avalanche Foundation, said Wednesday it has agreed to