Crypto volume analysis is the examination of trading volume data (the total quantity of cryptocurrency bought and sold in a defined period) to assess the strength, direction, and credibility of price movements. Volume reveals whether price action has genuine market participation behind it or whether a move lacks conviction. It is one of the oldest and most reliable forms of technical analysis, applied to crypto markets 24 hours a day, seven days a week across both spot and derivatives exchanges.
Key Takeaways
Volume is the confirmation layer for price action high volume validates a move, low volume questions it. Never analyse volume in isolation from price direction.
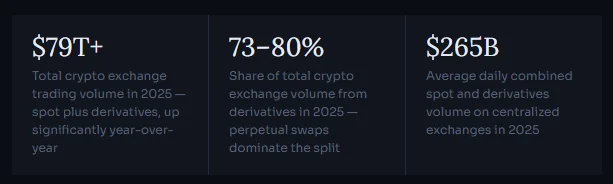
In 2025, derivatives accounted for 73–80% of total crypto exchange volume; overall crypto exchange trading exceeded $79 trillion for the year. This split matters: derivatives volume reflects leveraged speculation, not underlying spot demand.
The six core volume indicators; OBV, VWAP, Chaikin Money Flow, MFI, Accumulation/Distribution, and Volume Profile, each answer a different question. Using them in combination produces far more reliable signals than any single indicator.
On-chain volume (blockchain data) is much harder to fake than exchange-reported volume. Cross-referencing both is the most reliable way to separate genuine market moves from wash-traded noise.
Volume divergence, where price and volume move in opposite directions is one of the most actionable leading indicators for trend reversals. Learn to spot it before price confirms the turn.
Volume cycles faster in crypto than in any other asset class: cross-validating trends using order books, open interest data, and on-chain activity has become more essential than ever as of 2026.
What Does Trading Volume Actually Measure?
Trading volume measures the total number of cryptocurrency units (or the USD equivalent of those units) bought and sold on an exchange within a chosen time period. A daily volume figure represents the aggregate of every trade that executed in the past 24 hours. A one-hour bar shows all trades in that hour. Volume can be displayed in coin terms (2,500 BTC traded) or in USD value ($200 million in BTC traded) the latter being more useful when comparing volume across different price levels or time periods.
Think of volume as the market’s heartbeat. A strong, consistent heartbeat (sustained high volume) signals a healthy trend with broad participation many traders and investors are voting with their money in the same direction. A faint heartbeat (low volume) warns that a price move lacks real support and may not last. Volume is the only raw market data point that is not derived from price itself, making it an independent confirming or disconfirming signal for what the price chart shows.
Volume figures across exchanges are not always directly comparable. A volume bar on Binance, which processes nearly five times the spot volume of the second-largest exchange, means something very different than the same number on a smaller venue. Always contextualize volume against the specific exchange and asset you are analysing, and against its own historical average for that coin during that time of day.
Why Does Volume Matter for Crypto Traders?
Volume serves five distinct purposes in crypto market analysis, each addressing a different dimension of trading decisions.
Trend Confirmation: Volume validates whether a trending price move has genuine support. An uptrend accompanied by rising volume on up-days and declining volume on pullbacks is a healthy, sustained trend. An uptrend where volume declines as price rises is a weakening trend, fewer participants are driving price higher with each successive move, often a precursor to a reversal or consolidation. The same logic applies inverted to downtrends.
Breakout Validation: One of volume’s most important roles is distinguishing genuine breakouts from false ones. When a cryptocurrency breaks above a key resistance level on unusually high volume, broad participation in the move makes it far more likely to hold and continue. The same breakout on tepid volume, what traders call a “low-volume breakout” is significantly more prone to failing and reversing. Volume often begins building before the actual price breakout, giving alert traders a heads-up that something is developing.
Liquidity Assessment: High volume means higher liquidity: the ability to enter or exit a position without significantly moving the price against yourself. For traders managing position sizes of any consequence, understanding volume helps avoid the costly slippage that comes from trading illiquid assets. Low-volume conditions, common in smaller altcoins, during weekend hours, or during bear market stretches, produce wider bid-ask spreads and less predictable price movement.
Reversal Detection: Volume climax events, sudden, extreme volume spikes at trend extremes, often mark turning points. A massive volume surge at the peak of an extended rally may signal that large players are distributing (selling) into retail enthusiasm, exhausting buying demand. A volume climax in a downtrend often represents capitulation, a final wave of panic selling that clears the market and sets up the next accumulation phase. These volume climaxes are visible on charts as towering bars that dwarf surrounding activity.
Smart Money Tracking: Large institutional participants “whales” in crypto terminology, accumulate and distribute positions in ways that leave volume fingerprints, even when they work to minimize price impact. Rising on-chain volume from large wallets while exchange price stagnates, or OBV diverging upward from a flat or declining price, are signals that smart money is positioning ahead of a move. Volume analysis is one of the few tools that gives retail traders visibility into what larger participants are doing.
“Volume often precedes price: you might see volume start to pick up even before a major price swing, hinting that something is cooking.”
What Are the Different Types of Crypto Volume?
Exchange Volume (Spot and Derivatives)
Exchange volume is the most commonly cited figure, the total trading activity on centralized exchanges like Binance, Coinbase, or OKX. It includes spot trading (immediate purchase or sale of actual cryptocurrency) and derivatives trading (futures, perpetual swaps, options, contracts based on the future price of an asset.
In 2025, this distinction matters more than ever. Perpetual swap contracts alone represent approximately 78% of crypto derivatives trading volume; overall derivatives account for 73–80% of total exchange volume. A large derivatives volume surge does not necessarily reflect increased demand for the underlying asset, it reflects increased leveraged speculation, which can amplify price moves in either direction. When evaluating volume signals, knowing whether you’re looking at spot or derivatives volume changes the interpretation.
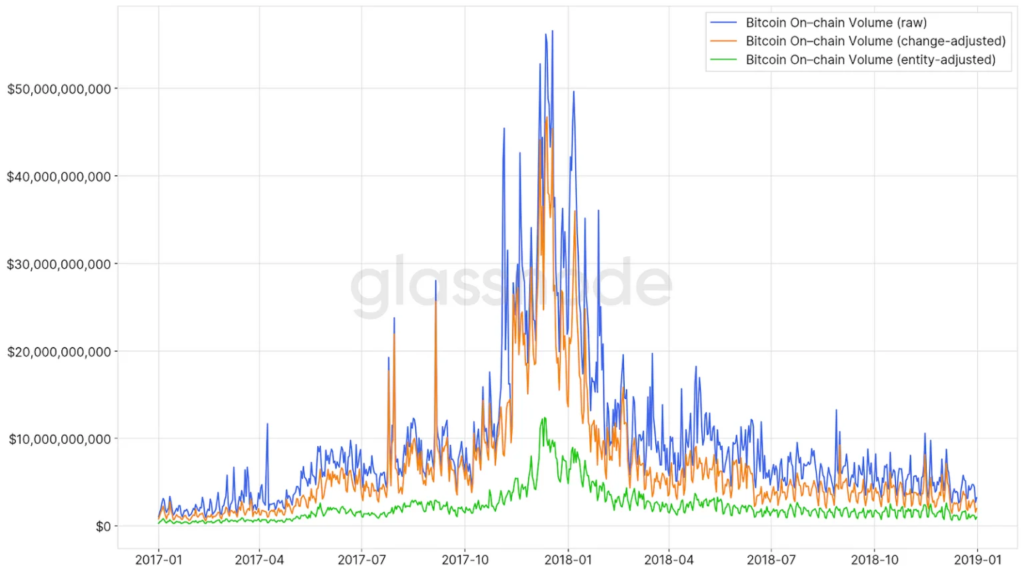
On-chain volume tracks the actual movement of cryptocurrency recorded on the blockchain itself, transfers between wallets, deposits to exchanges, withdrawals from exchanges. Because blockchain data is public, immutable, and verifiable, on-chain volume is much harder to fabricate than exchange-reported volume. A surge in on-chain volume, particularly large wallet movements into or out of exchanges, often signals institutional positioning ahead of major moves.
The key ratio used by analysts is the trade-to-on-chain volume ratio: how much trading activity occurs on an exchange relative to the actual cryptocurrency flowing in from outside. Exchanges with legitimate volume show a reasonable ratio; exchanges engaged in wash trading show an impossibly high ratio because most of their “trading” never touched the blockchain.
DEX Volume
Decentralized exchange volume has grown significantly, decentralized perp DEX volume grew 346% in 2025 to approximately $6.7 trillion. DEX volume is recorded on-chain and is therefore more verifiable than centralized exchange volume, though it is also susceptible to bot-driven manipulation in certain market conditions. DEX volume is particularly useful for tracking DeFi activity and altcoin trading that may not be represented on major centralised platforms.
Join UEEx
Experience the World’s Leading Digital Wealth Management Platform
The core of volume analysis is the relationship between price direction and volume magnitude. These relationships are not arbitrary, they reflect the psychology of supply and demand playing out in real time. The table below maps the four fundamental price-volume states and their interpretations.
Price Direction
Volume Level
Interpretation
Signal
Rising
High / Increasing
Strong buying conviction; many participants entering. Trend likely sustainable.
Bullish
Rising
Low / Declining
Price rising but fewer participants. Buying exhaustion may be near; rally lacks support.
Caution
Falling
High / Increasing
Strong selling conviction; broad distribution. Downtrend likely to continue.
Bearish
Falling
Low / Declining
Price declining but sellers are losing conviction. Potential bottom forming; possible reversal.
Watch for Reversal
One practical addition: compare each volume bar against a moving average of volume (typically 20-period). Bars significantly above the average indicate above-normal participation; bars below indicate subdued interest. This relative framing prevents the error of calling Bitcoin’s normal weekend volume “low” without contextualising it against its own typical weekend baseline.
Time-of-day context matters in 24/7 crypto markets: Volume consistently peaks during US market hours (8 AM–4 PM EST) and Asian trading hours. A volume spike during a quiet Sunday morning UTC requires far less absolute volume to be “significant” than the same spike during peak US hours. Factor in the time window when interpreting whether a volume reading is genuinely above average for that period.
What Are the Six Essential Volume Indicators?
Raw volume bars show intensity but not direction. Volume indicators translate raw data into momentum signals that reveal whether volume is accumulating (bullish) or distributing (bearish), and whether current volume supports or contradicts price movement. Each of the six indicators below answers a different question, using several together produces more reliable signals than any one alone.
On-Balance Volume (OBV)
OBV adds total volume on up-close days and subtracts total volume on down-close days, creating a cumulative running total. It measures net accumulation versus distribution over time. The primary use is divergence analysis: if price is making new highs but OBV is making lower highs, smart money is distributing into retail buying a bearish warning. If price is falling but OBV is flat or rising, accumulation is underway, a bullish setup. OBV is particularly effective for detecting whale accumulation before price moves.Best for: Swing trading, spotting institutional positioning. Available on all major platforms including TradingView and TradingView-compatible tools.
Volume Weighted Average Price (VWAP)
VWAP calculates the average price weighted by volume at each transaction, heavier volume transactions pull it more than light-volume ones. It represents the “fair value” price at which the market has actually traded. Price above VWAP is bullish; below is bearish. VWAP acts as dynamic support during uptrends and resistance during downtrends. Institutional traders use it to benchmark execution quality. Day traders use it as an intraday trend filter. Deviations from VWAP signal overbought or oversold conditions relative to where genuine market consensus lies.Best for: Day trading, institutional execution, intraday trend identification. See also: VWAP guide on UEEx.
Chaikin Money Flow (CMF)
CMF measures net money flow over a set period (typically 20–21 candles) by examining where price closes within each candle’s high-low range, weighted by volume. Closing near the top of the candle with high volume = accumulation; closing near the bottom = distribution. CMF oscillates between -1 and +1 (displayed as -100 to +100 on some platforms), with 0 as the baseline. Above 0 signals net inflows (bullish); below 0 signals net outflows (bearish). A CMF cross of the zero line can signal trend continuation or reversal. Pairs excellently with RSI (which identifies stretched conditions) and VWAP (which shows where institutions agree on value).Best for: Confirming breakouts, assessing whether institutional money supports a trend. Default setting: 20- or 21-period.
Money Flow Index (MFI)
MFI is a volume-weighted RSI, it measures buying and selling pressure by incorporating both price momentum and volume into a single oscillator ranging from 0 to 100. Readings above 80 signal overbought conditions; below 20 signals oversold. Because it weights by volume, MFI is more sensitive than RSI and can signal divergences and reversals earlier. A bearish MFI divergence (price making new highs but MFI making lower highs) is a more powerful reversal warning than price-only RSI divergence because it captures the dwindling volume behind the price move.Best for: Overbought/oversold signals, divergence trading. Recommended settings: 14-period default; 7–10 for faster signals.
Accumulation/Distribution (A/D) Line
The A/D line, developed by Marc Chaikin, is a cumulative indicator that reads deeper into each candle than OBV. While OBV is binary (up day adds all volume; down day subtracts all), A/D weights volume by where price closes within the candle’s full high-low range. A close in the upper half of the range is positive regardless of whether the candle closes higher or lower than the previous session. This makes A/D more sensitive to within-session buying and selling behaviour. Divergences between A/D and price are powerful: during Bitcoin’s 46% decline from its October 2025 ATH, A/D remained relatively flat while OBV fell steeply suggesting large buyers were absorbing the selling at each close, even as OBV flagged every red day identically.Best for: Long-term accumulation/distribution trend, detecting institutional behaviour across extended periods.
Volume Profile (VPVR)
Volume Profile fundamentally differs from the other indicators: instead of plotting volume against time, it plots volume against price levels, displayed as a horizontal histogram. The Point of Control (POC); the price level with the most volume is often a magnetic support or resistance zone. The Value Area (where approximately 70% of volume traded) defines the range of fair value. Low-volume areas between high-volume nodes represent price levels where few agreed, price tends to move through these quickly. Volume Profile is the preferred tool for identifying where support and resistance are most likely to hold, and where breakouts will accelerate most violently.
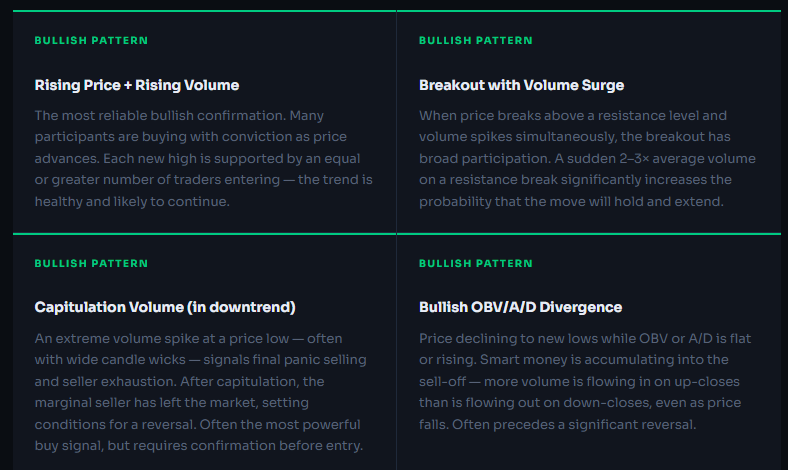
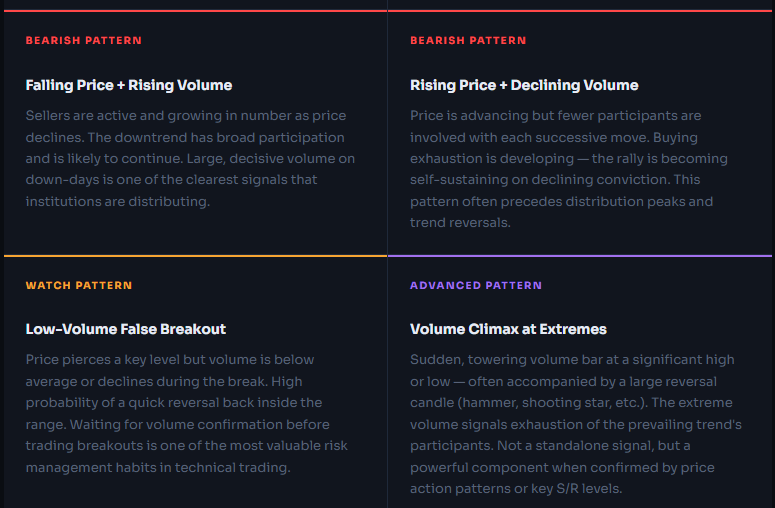
Volume analysis goes beyond individual indicator readings — there are recurring patterns that appear across crypto market cycles and carry consistent predictive value when paired with price action.
How Do You Detect Fake or Wash-Traded Volume?
Wash trading, where an entity simultaneously buys and sells to create the appearance of trading activity, is a documented problem across crypto exchanges. The incentive is significant: high reported volume attracts new users, enables higher token listing fees, and creates an illusion of liquidity that can draw in retail capital. Historically, the scale of fake volume on smaller exchanges has been substantial, with some industry analyses suggesting that a material portion of reported volume across the broader exchange landscape has been inflated.
In 2025, over 97% of crypto derivatives volume was processed by unregulated exchanges. The unregulated environment gives bad actors both the motive and the opportunity to inflate reported figures. Always cross-reference volume data against on-chain metrics and order book depth before trusting any single exchange’s self-reported numbers.
What Are the Red Flags for Fake Volume?
The trade-to-on-chain ratio. Genuine exchanges show a reasonable ratio of reported trade volume to verified on-chain inflows. If an exchange reports 10× the trading volume of a comparable platform but shows only a fraction of the blockchain activity, wash trading is the most likely explanation.
Spread anomalies. In genuinely liquid markets, high volume produces tight bid-ask spreads, many buyers and sellers are present, so the gap between what buyers will pay and sellers will accept is small. Artificially inflated volume often coexists with suspiciously wide spreads because the “trades” are not real, and genuine liquidity is absent.
Trade pattern analysis. Legitimate volume shows clustering, consecutive buys or consecutive sells as informed participants react to information. Wash-traded volume shows an eerily even alternation of buys and sells at identical sizes and intervals. Benford’s Law analysis (examining the distribution of leading digits in trade sizes) reliably distinguishes real from fabricated trading in academic research.
Cross-exchange comparison. A volume spike on one obscure exchange that isn’t echoed on major platforms is a strong warning sign. Real market events affect all venues simultaneously, if only one exchange is showing the surge, that exchange’s data is the anomaly.
The practical solution: build your volume analysis on data from major regulated exchanges (Binance, Coinbase, Kraken, OKX) or from aggregated data providers that apply trusted exchange frameworks, such as those used by Coin Metrics or CoinDesk Data, which filter out exchanges with documented manipulation patterns.
What Are the Most Common Volume Analysis Mistakes?
Reading Volume Without Price Context: Volume is a confirming indicator, not a standalone one. High volume on its own is neither bullish nor bearish, it becomes meaningful only when paired with price direction. A volume spike during a sharp decline is bearish confirmation, not a buy signal. Always establish price direction first, then use volume to assess whether that direction has genuine support.
Ignoring Relative Context: Volume is always relative. What counts as “high” volume for a small-cap altcoin is trivially low for Bitcoin. What counts as “high” for Bitcoin at 3 AM UTC is normal for Bitcoin at 2 PM UTC. Compare each volume reading against the same asset’s own 20-period volume moving average, and filter for the time of day. Never apply absolute thresholds across different assets or time windows.
Treating One Indicator as Sufficient: OBV, CMF, MFI, A/D, VWAP, and Volume Profile each capture different dimensions of volume behaviour. OBV is binary by design; A/D reads within-candle positioning. CMF shows recent net flow; MFI weights by volume like RSI. No single indicator captures everything. The most reliable volume signals occur when multiple indicators align for example, when OBV divergence, CMF crossing below zero, and a low-volume breakdown all occur together
Acting on Low-Volume Moves: Low-volume price moves are the least reliable in crypto. Weekend market hours, thin altcoin markets, and quiet macro periods all produce price fluctuations driven by small imbalances in order flow rather than genuine sentiment shifts. Low-volume moves are far more prone to reversal and can be easily manipulated by a single large order. The discipline of waiting for volume confirmation before committing to a position is one of the most valuable risk management habits in technical trading.
Confusing Exchange Volume with On-Chain Volume: These measure different things and should not be used interchangeably. Exchange volume shows speculative trading activity between users on a platform. On-chain volume shows actual cryptocurrency movement between wallets on the blockchain. A significant on-chain volume spike, especially from large addresses, is generally a more reliable signal than an equivalent exchange volume spike, because blockchain data cannot be fabricated the way self-reported exchange data can.
Join UEEx
Experience the World’s Leading Digital Wealth Management Platform
Crypto volume analysis, while a powerful tool, requires a nuanced understanding of its strengths and limitations.
By combining volume analysis with other technical indicators, fundamental analysis, and a healthy dose of skepticism, you can gain valuable insights into market sentiment and make more informed trading decisions in the ever-evolving world of cryptocurrency.
Remember, crypto markets are complex and influenced by various factors. Volume analysis is a powerful tool but should be used with other technical indicators and fundamental analysis to create a well-rounded trading strategy.
Frequently Asked Questions
What is crypto volume analysis?
Crypto volume analysis is the study of trading volume data; the total quantity of cryptocurrency bought and sold in a given period, to assess the strength, credibility, and direction of price movements. Volume confirms or questions whether a price move has genuine market participation behind it. Rising price on high volume signals a strong, sustainable trend; rising price on low volume warns of a weak move that may reverse. Volume is also used to detect breakouts, reversals, accumulation and distribution by large players, and potential price manipulation.
What does high trading volume mean in crypto?
High trading volume means many participants are actively buying or selling a cryptocurrency over the measured period. It signals strong market interest, conviction behind the current price direction, and good liquidity. High volume during a price increase suggests bullish conviction; high volume during a price decline confirms selling pressure. Always compare volume to the asset’s own historical average for that time period, not against other assets or different times of day.
What is On-Balance Volume (OBV) and how do I use it?
OBV is a cumulative volume indicator that adds all volume on up-close days and subtracts it on down-close days, creating a running total of net accumulation. The key use is divergence: if price is rising but OBV is falling, smart money is distributing into retail buying, a bearish warning. If price is falling but OBV is rising, accumulation is underway, a bullish setup. OBV is particularly effective for detecting whale activity before major price moves, and is available on all major charting platforms. See our guide to OBV in crypto trading.
What is VWAP and how do crypto traders use it?
VWAP (Volume Weighted Average Price) is the average price at which a cryptocurrency has traded throughout a session, weighted by the volume at each price level. It represents the market’s “fair value” consensus at a given time. Price above VWAP is considered bullish; below is bearish. Institutional traders use VWAP to benchmark execution quality. Day traders use it as an intraday trend filter and dynamic support/resistance level. VWAP pairs well with CMF (which shows if institutional money agrees) and RSI (which shows if the move is stretched). Full guide: VWAP on UEEx.
How do you spot fake or wash-traded crypto volume?
Key signals: (1) Compare exchange-reported volume against on-chain blockchain data, genuine trading produces corresponding blockchain activity that wash trading doesn’t; (2) Check bid-ask spreads, real high-volume markets have tight spreads; artificially inflated volumes often have wide spreads; (3) Look for abnormal trade patterns, genuine volume clusters in buys or sells; wash trading shows an even alternating buy/sell distribution; (4) Cross-reference across major exchanges, a spike only on one obscure exchange is suspicious; (5) Use Benford’s Law analysis if available. Stick to data from regulated exchanges and trusted data providers with fake-volume filtering frameworks.
What is the difference between on-chain volume and exchange volume?
Exchange volume measures speculative trading activity on centralised platforms, buying and selling between users. On-chain volume tracks actual cryptocurrency movements recorded on the blockchain,, transfers between wallets. On-chain volume is verifiable, immutable, and much harder to fake. A spike in on-chain volume, especially from large wallets, is often a more reliable signal than an equivalent exchange volume spike. In 2025, derivatives accounted for 73–80% of total crypto exchange volume, making on-chain analysis increasingly important for identifying genuine underlying demand, since most derivatives volume reflects leveraged speculation rather than spot demand.
What is Volume Profile in crypto trading?
Volume Profile plots trading volume against price levels (horizontally) rather than against time. It shows exactly where the most volume traded at each price, identifying the Point of Control (POC; highest volume price level) and Value Area (where ~70% of volume occurred). These become significant support and resistance zones. Low-volume areas between high-volume nodes are price levels where few agreed, price tends to move through them quickly. Volume Profile is the preferred tool for identifying where price is most likely to stall, react, or accelerate. Full guide: Volume Profile on UEEx.
What are the most common mistakes in crypto volume analysis?
Seven common mistakes: (1) Analysing volume without price context, always read both together; (2) Ignoring relative context compare volume against the asset’s own average, not other assets; (3) Trusting reported exchange volume without verification; (4) Relying on a single indicator when OBV, CMF, MFI, A/D, and Volume Profile each capture different dimensions; (5) Ignoring time-of-day patterns crypto volume peaks during US and Asian hours; (6) Conflating on-chain volume with exchange volume; (7) Acting on low-volume moves the lowest-conviction price moves happen on low volume and reverse most often.
Orebiyi Eniola is a writer whose soul work is content marketing with a focus on the cryptocurrency industry. Equipped as a marketing storyteller and driven by a passion for crafting impactful stories, she helps businesses connect with their audiences via strategic and thought-provoking writing. Orebiyi assists businesses in projecting their stories and actualizing their ambitions through the force of words. She likes to settle in with her favorite fiction novels when not pounding on her keyboard.
Disclaimer: This article is intended solely for informational purposes and should not be considered trading or investment advice. Nothing herein should be construed as financial, legal, or tax advice. Trading or investing in cryptocurrencies carries a considerable risk of financial loss. Always conduct due diligence before making any trading or investment decisions.


")


")


