Fibonacci extensions are a technical analysis tool used by crypto traders to project where a price might move after completing a retracement specifically, how far it might travel beyond the prior swing high or low once a trend resumes.
Unlike Fibonacci retracements, which map potential pullback zones, extensions point forward.
They give traders objective, mathematically-derived levels for setting profit targets and identifying likely resistance or support in uncharted price territory.
Join UEEx
Experience the World’s Leading Digital Wealth Management Platform
What Is the Fibonacci Sequence and Why Does It Matter in Trading?
The Fibonacci sequence begins 1, 1, 2, 3, 5, 8, 13, 21, 34, and so on, where every number is the sum of the two before it.
Italian mathematician Leonardo Fibonacci popularised this pattern in the 13th century, though its origins trace back further through Islamic and Indian mathematics.
The sequence itself is not what traders use directly what matters are the ratios that emerge from it.
Divide any number in the sequence by the one that follows it and you get approximately 0.618. Divide it by the number two places ahead and you get 0.382.
These ratios repeat so consistently through the sequence and appear so frequently in natural systems from spiral galaxies to plant growth, that traders began observing the same proportions in the rhythms of financial markets.
The premise is not mystical. It is grounded in market psychology: large numbers of traders watching the same levels creates self-fulfilling behaviour at those price points.
In crypto specifically, where 24-hour markets move continuously and algorithmic trading systems are programmed to respond to Fibonacci levels, the tool carries additional weight.
Algorithms and institutional trading desks watch these levels in real time, which amplifies the reactions seen when price approaches them.
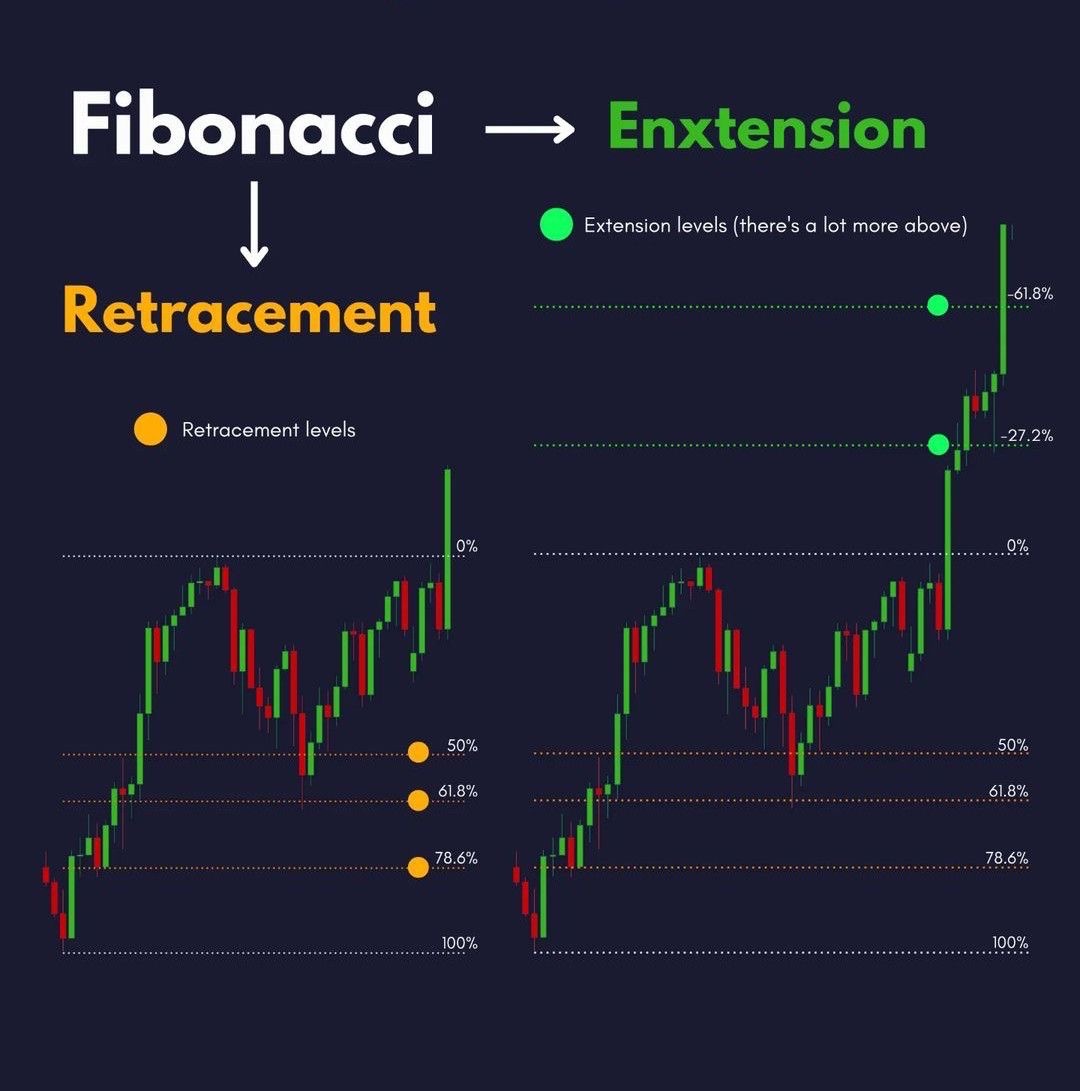
What Is the Difference Between Fibonacci Extension and Fibonacci Retracements?
These two tools are closely related but serve opposite purposes, and confusing them is one of the most common mistakes newer traders make.
How far price might pull back within an existing trend before continuing
23.6%, 38.2%, 50%, 61.8%, 78.6%
Identifying entry points during corrections
Fibonacci Extension
How far price might travel beyond the prior swing point once a trend resumes
127.2%, 161.8%, 200%, 261.8%
Setting profit targets and spotting resistance in trending markets
See retracements as answering where might price dip before going higher? and extensions as answering if price keeps going higher, where might it stop?
Used together, entering at a retracement level and exiting at an extension level, they form a complete trade plan built on objective mathematical structure rather than guesswork.
A practical example from 2025 illustrates this well. Using Bitcoin’s 2020 COVID lows as the base and the 2021 bull-run highs as the ceiling of the Fibonacci tool, the 161.8% extension level mapped precisely to the level where the 2025 bull run stalled giving traders who planned ahead a clear exit zone before Bitcoin began its retreat from above $126,000.
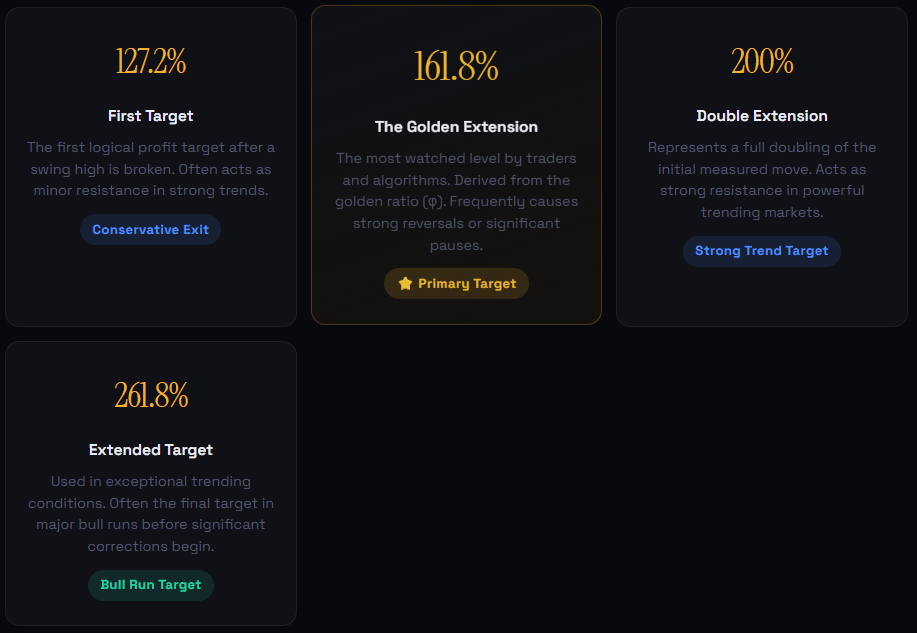
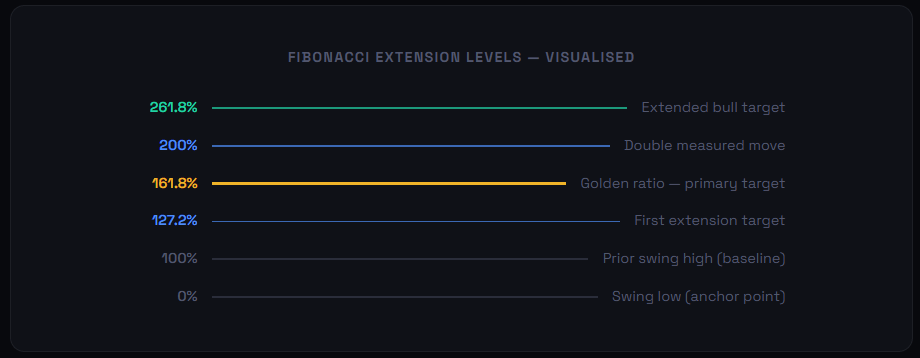
What Are the Key Extension Levels and What Do They Mean?
Not all extension levels carry equal weight. Knowing which ones to prioritise sharpens your trading considerably.
The 161.8% level deserves special attention. In a documented 2025 example on the S&P 500, the 161.8% extension from a May 2025 swing high and low provided the exact level where the market’s corrective downtrend halted.
The same dynamic plays out repeatedly in Bitcoin and Ethereum charts. When multiple time frames converge on the same extension level, for example, the 161.8% on a daily chart aligning with the 161.8% on a weekly chart, the significance of that level multiplies considerably.
How Do You Plot Fibonacci Extension Step by Step?
Plotting extensions correctly requires three anchor points rather than the two used for retracements.
Join UEEx
Experience the World’s Leading Digital Wealth Management Platform
Most professional charting platforms including TradingView, which is used by the majority of active crypto traders provide the Fibonacci extension tool directly alongside the retracement option.
1. Identify the Trend Direction
Determine whether the market is in an uptrend or downtrend. Fibonacci extensions are most reliable in clearly trending markets, not sideways consolidation.
Look for a series of higher highs and higher lows in an uptrend, or lower highs and lower lows in a downtrend.
2. Identify Your Three Anchor Points
For an uptrend, you need: Point A (the swing low before the trend began), Point B (the swing high where the trend peaked before retracing), and Point C (the swing low of the retracement).
These three points define the measured move that will project the extensions.
3. Apply the Tool on Your Chart
In TradingView, open the Fibonacci extension tool. Click Point A, drag to Point B, then extend to Point C.
The platform automatically plots the extension levels above the swing high.
For a downtrend, the process is reversed: from the swing high down to the swing low and back up to the retracement high.
4. Focus on the Most Significant Levels
Do not attempt to trade every extension line. Focus on 127.2% for a conservative first target, 161.8% as your primary target, and 200% or 261.8% only in genuinely strong trending conditions where momentum indicators confirm continued buyer dominance.
5. Confirm With Additional Indicators
Fibonacci extensions should never be traded in isolation. Confluence with a key moving average, a trendline, a volume spike, or an RSI reading amplifies the significance of the level.
A 161.8% extension that also aligns with the 200-day moving average creates a much stronger area of probable resistance than the extension alone.
Strategic Confluence with Fibonacci Extensions
The Power of Confluence
Fibonacci extensions are most effective when they align with independent technical signals at the same price level, a concept known as confluence.
Top Indicator Pairings
Moving Averages: Clusters of orders often form when extension levels (like the 161.8%) align with major MAs (50-day or 200-day).
RSI Divergence: A price hitting an extension level while the RSI shows divergence is a high-probability reversal signal.
Volume Analysis: Reaching an extension on low volume suggests exhaustion, while a high-volume breakout signals momentum toward the next level.
Elliott Wave Theory: These systems integrate naturally, as Wave 3 often targets the 161.8% extension and Wave 5 targets the 261.8% level.
Common Pitfalls to Avoid
Ignoring Market Context: Extensions lose reliability in sideways or choppy markets; they require a clear trending impulse to work.
Treating Levels as Guarantees: The 161.8% level is a probability zone, not a certainty. Prices can reverse early or blow through levels during high volatility.
Poor Anchor Point Selection: Using minor swing points creates noisy data. The most reliable extensions are anchored to prominent highs and lows on higher timeframes.
Join UEEx
Experience the World’s Leading Digital Wealth Management Platform
What charting platform should I use for Fibonacci extensions?
TradingView is the most widely used platform among retail and professional crypto traders in 2025, and it includes a built-in Fibonacci extension tool that is easy to configure
How does Elliott Wave Theory relate to Fibonacci extensions?
The two frameworks are deeply interconnected.
Elliott Wave Theory identifies the rhythmic wave patterns that markets move in, while Fibonacci ratios define the proportional relationships between those waves.
Conclusion
Fibonacci extensions are an essential tool for traders looking to maximize profits and minimize risks by predicting future price movements beyond standard retracements.
While they should not be used in isolation, the extension provide valuable insights into potential support and resistance levels, especially when combined with other technical indicators.
Their versatility and ease of use make them a must-have in any trader’s toolkit.
Join UEEx
Experience the World’s Leading Digital Wealth Management Platform
Incorporating the extension into your trading strategy can enhance your ability to forecast market movements, allowing you to make more informed and profitable decisions.
Abeeb is a goal-oriented content writer with over 4 years of experience in crafting compelling and insightful content across various genres, including tech, news, entertainment, and blockchain. Known for building strong connections with clients and stakeholders, Abeeb is dedicated to delivering clear, concise, and impactful writing that captivates audiences.
Disclaimer: This article is intended solely for informational purposes and should not be considered trading or investment advice. Nothing herein should be construed as financial, legal, or tax advice. Trading or investing in cryptocurrencies carries a considerable risk of financial loss. Always conduct due diligence before making any trading or investment decisions.