Overbought and oversold indicators are momentum oscillators that signal when an asset’s price has moved too far, too fast in one direction and may be due for a reversal.
If you have spent any time reading a crypto chart, you have encountered overbought and oversold indicators.
These are among the most misunderstood tools in technical analysis, frequently treated as simple buy and sell signals when they are actually probability-shifting lenses that require context to use correctly.
This guide covers every major overbought and oversold indicator, how they work, what its signals actually mean in crypto’s unique market structure, and how to layer them together for significantly higher-probability trade setups.
How They Work?
Overbought and oversold indicators belong to a class of technical analysis tools called oscillators indicators that fluctuate within a fixed numerical range.
Unlike trend indicators that follow price directionally, oscillators measure the speed and intensity of price movement.
They answer a specific question: has this asset moved so far, so fast, that a reversal or pause becomes statistically likely?
An overbought condition occurs when price has risen sharply over a short period and buying pressure has become potentially overextended. Sellers may soon step in to take profits, and new buyers may hesitate at elevated prices, creating the conditions for a pullback.
An oversold condition is the inverse: price has fallen sharply, selling pressure may be exhausted, and buyers may step in to capitalise on what appears to be an undervalued level.
Join UEEx
Experience the World’s Leading Digital Wealth Management Platform
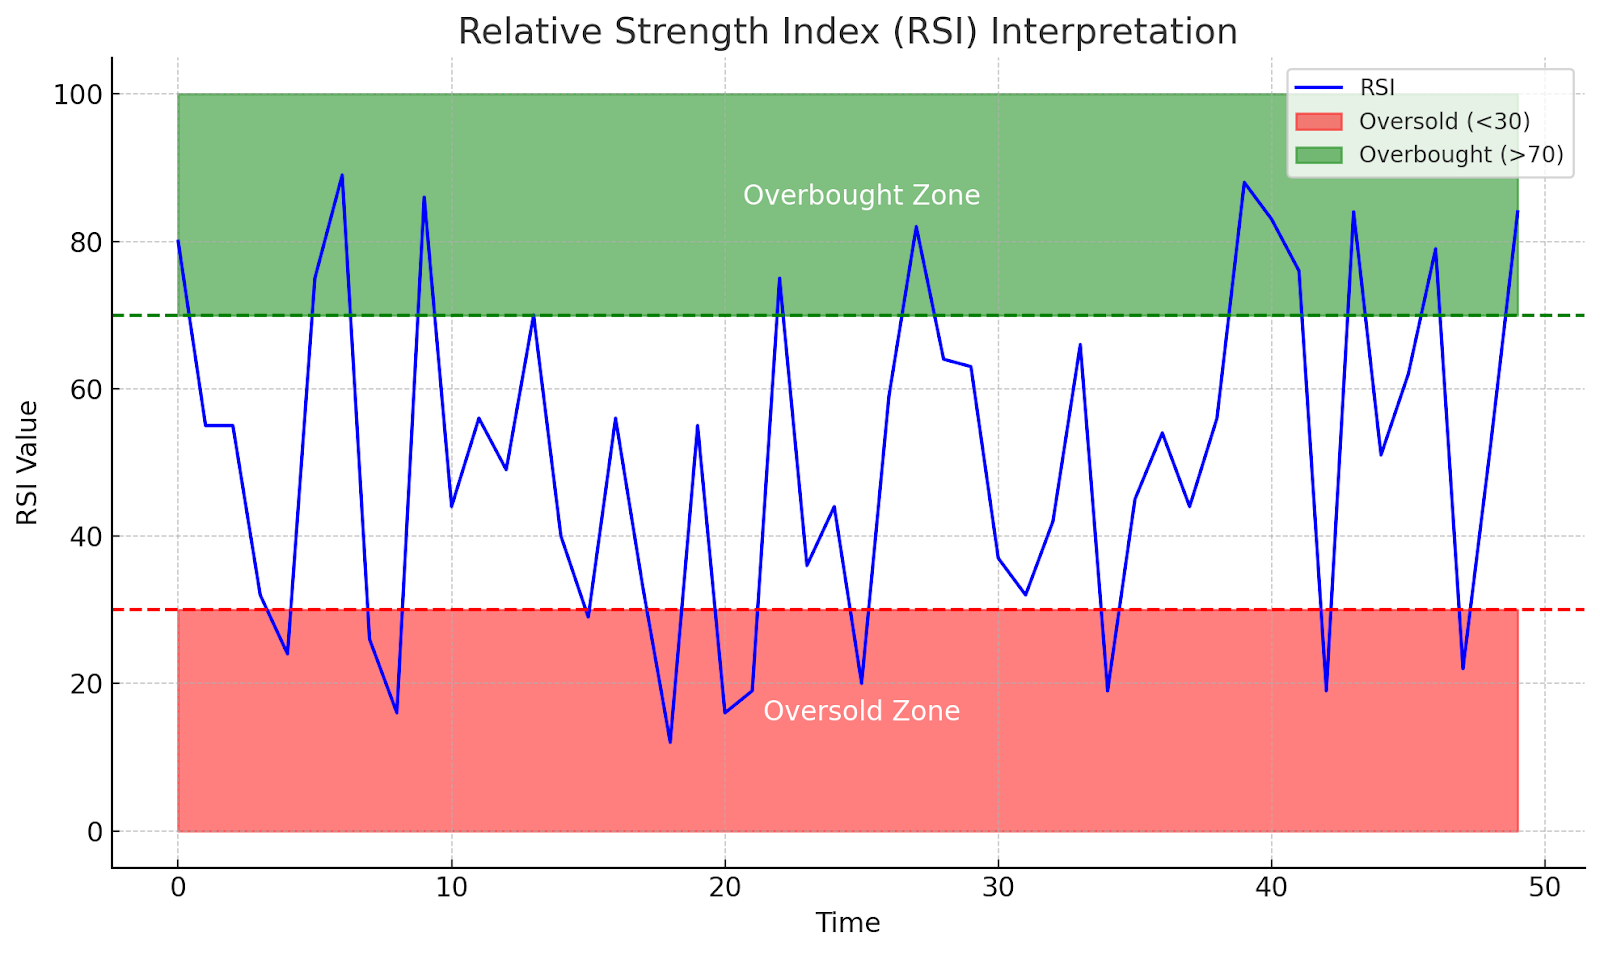
The Relative Strength Index (RSI) is a momentum oscillator that measures the speed and change of price movements. It’s used to identify overbought and oversold conditions in a market.
The RSI is a scale from 0 to 100, where a value above 70 typically indicates an overbought condition, and a value below 30 indicates an oversold condition.
Calculation
The RSI is calculated using the following steps:
Calculate the average gain and average loss over a specified period, typically 14 periods.
Calculate the relative strength (RS), which is the average gain divided by the average loss.
Calculate the RSI using the formula:
RSI = 100 – (100 / (1 + RS)).
RSI Values
Overbought Condition: An RSI value over 70 indicates that an asset may be overbought, suggesting a possible sell-off or price pullback.
Oversold Condition: Conversely, an RSI value below 30 suggests an asset may be oversold, potentially indicating a buying opportunity.
Join UEEx
Experience the World’s Leading Digital Wealth Management Platform
Identifying Reversal Points: Traders use RSI to spot potential price reversals. An asset’s move into the overbought or oversold territory can signal a forthcoming reversal.
Divergence: A divergence occurs when the price of an asset makes a new high or low that isn’t mirrored in the RSI. This can be a strong indicator of a potential price direction change.
Trend Confirmation: The RSI can also help confirm the strength of a trend. For instance, during an uptrend, the RSI tends to stay above 30 and frequently hits above 70.
2. Stochastic Oscillator
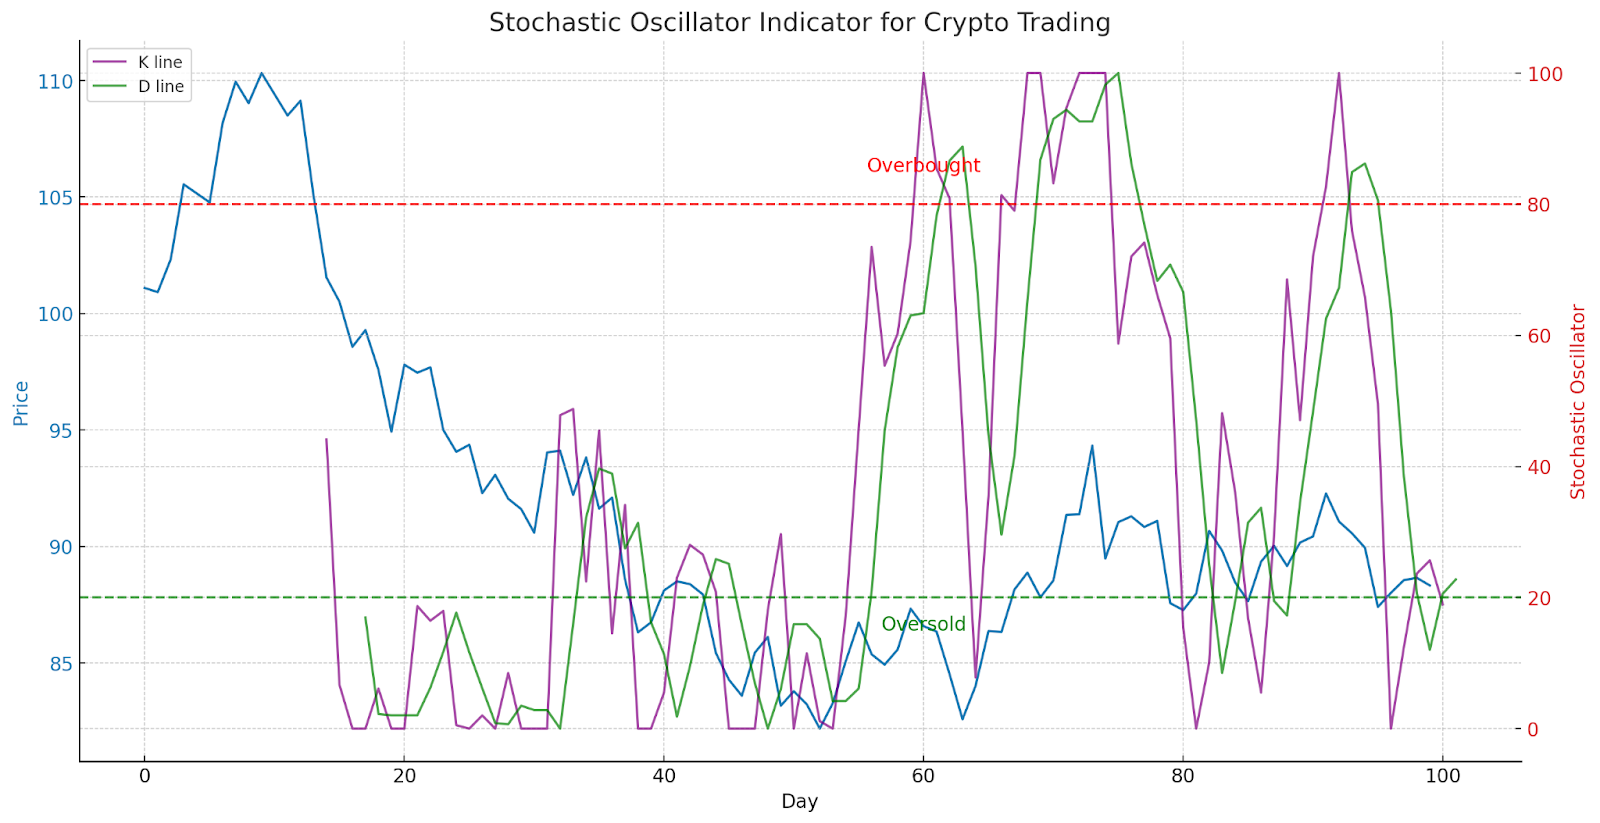
The Stochastic Oscillator is a momentum indicator that compares a particular closing price of an asset to a range of its prices over a certain period of time.
The theory behind the indicator is that in an upward trending market, prices tend to close near their high, and during a downward trending market, prices close near their low.
The oscillator moves between 0 and 100 and is composed of two lines: the %K line (the main line) and the %D line (the signal line).
Calculation
The Stochastic Oscillator is calculated using the following steps:
%K Line: This is the main line and is calculated based on the most recent closing price, the lowest price, and the highest price over a given period (typically 14 days).
%K = ((Current Close – Lowest Low) / (Highest High – Lowest Low)) * 100
%D Line: The %D line is the simple moving average (SMA) of the %K line, usually over the last three periods i.e:
%D = 3-day Simple Moving Average of %K
Stochastic Oscillator Values
Overbought and Oversold Conditions: Similar to RSI, the Stochastic Oscillator indicates overbought conditions when the value is above 80 and oversold conditions when below 20.
These thresholds suggest potential reversal points.
Crossovers: A key signal generated by the Stochastic Oscillator is the crossover between the %K and %D lines.
When the %K line crosses above the %D line in the oversold area (below 20), it suggests a buy signal. Conversely, a sell signal is suggested when the %K line crosses below the %D line in the overbought area (above 80).
Join UEEx
Experience the World’s Leading Digital Wealth Management Platform
How to Use Stochastic Oscillator in Crypto Trading
Timing Entries and Exits: The oscillator’s overbought and oversold signals can help traders time their entry and exit points, aiming to buy low and sell high.
Spotting Divergences: Divergence occurs when the price of an asset moves in the opposite direction of the Stochastic Oscillator, indicating a potential reversal.
For example, if the price makes a new high but the oscillator does not, it may suggest the upward momentum is waning.
Confirming Trend Strength: The position of the %K and %D lines relative to the overbought and oversold levels can also indicate the strength of a trend.
For instance, during a strong uptrend, the lines may remain in the overbought area for an extended period.
3. Bollinger Bands
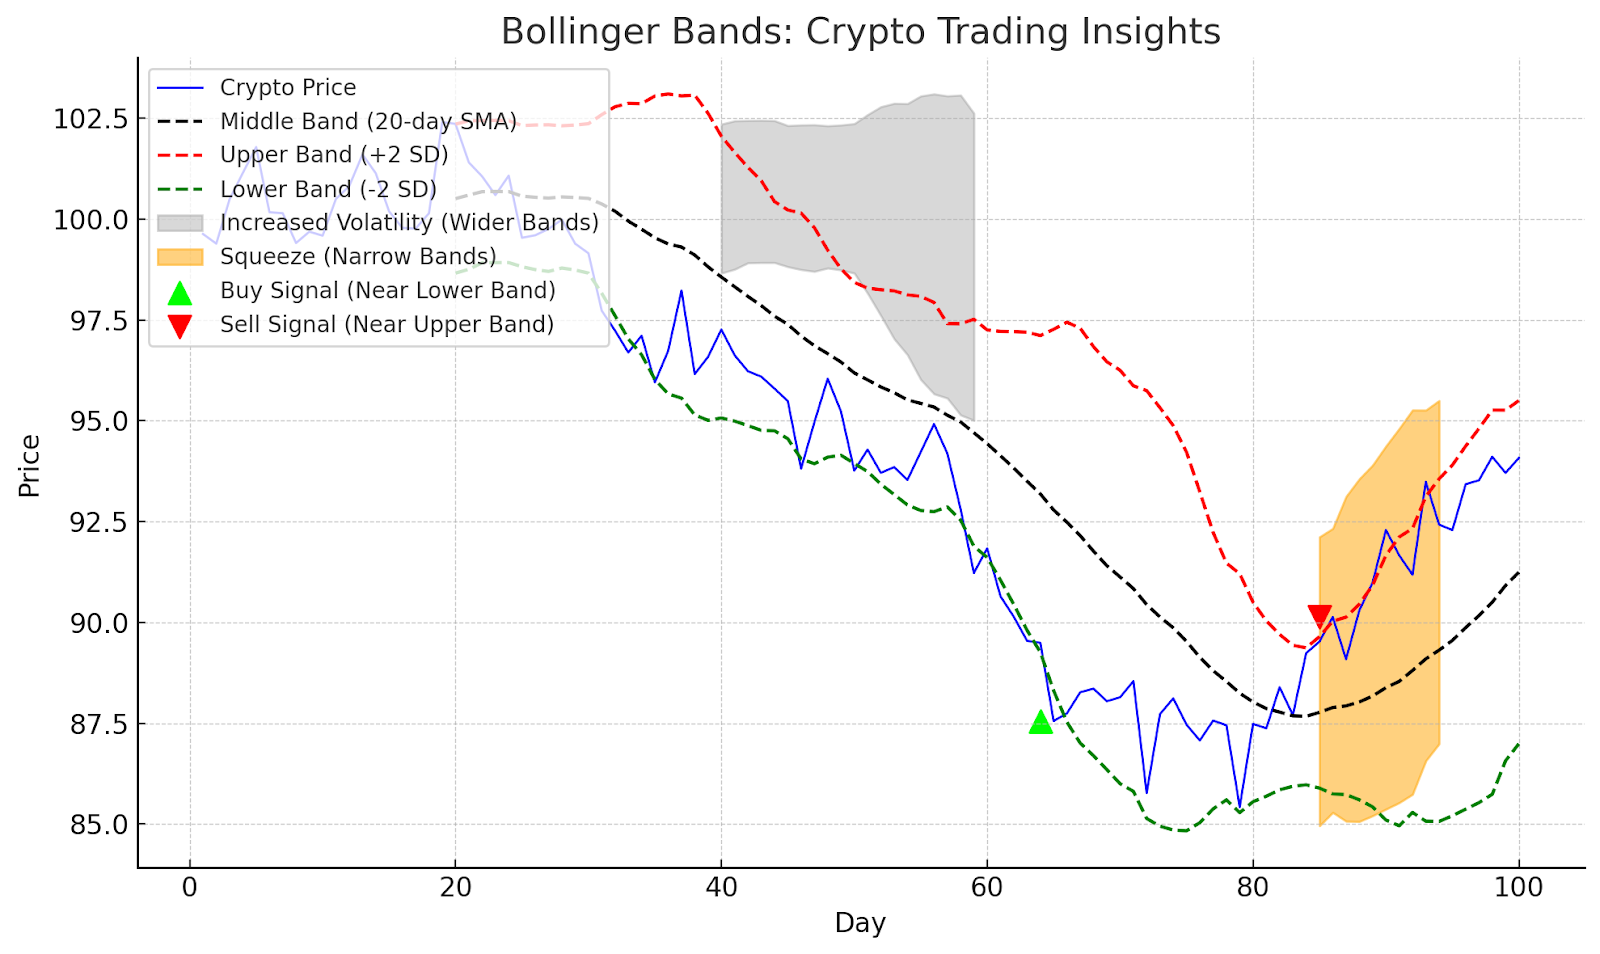
Bollinger Bands (often referred to simply as Bollinger Bands) are a technical analysis tool that utilizes bands around a moving average to visualize price volatility.
Unlike the RSI and Stochastic Oscillator, which directly indicate overbought or oversold conditions, Bollinger Bands focus on volatility and potential breakouts.
Bollinger Bands consist of three lines:
Middle Band: A simple moving average (SMA) of the closing price over a chosen period (commonly 20 days). This line represents the average price movement.
Upper Band: Placed a certain number of standard deviations (typically two) above the middle band. The upper band reflects areas of potentially higher prices based on recent volatility.
Lower Band: Positioned a certain number of standard deviations (typically two) below the middle band. The lower band indicates areas of potentially lower prices based on recent volatility.
The width of the bands is a key aspect of Bollinger Bands. As volatility increases, the bands widen, indicating a larger range for price movements.
Conversely, during periods of low volatility, the bands contract, suggesting a tighter price range.
How to Use Bollinger Bands in Crypto Trading
While Bollinger Bands aren’t a direct overbought/oversold indicator, they offer valuable insights for traders:
Price Movements and Volatility: Expanding Bollinger Bands suggest increasing volatility, potentially leading to breakouts (price moving decisively above the upper band or below the lower band).
Also, contracting Bollinger Bands indicate lower volatility, which might precede a breakout or a period of consolidation.
Potential Breakouts: A price consistently reaching the upper Bollinger Band could suggest overbought conditions and a potential price pullback.
However, a breakout above the upper band can signal a significant upward move.
Conversely, a price repeatedly touching the lower Bollinger Band might indicate oversold conditions and a possible price bounce. A breakout below the lower band could signal a strong downtrend.
False Signals: Bollinger Bands can generate false breakout signals, especially in volatile markets. Confirmation from other technical indicators or price action patterns is crucial.
Squeeze: A period of Bollinger Band contraction (squeezing) can precede a breakout in either direction, so watch for follow-through price movement after the squeeze.
4. Moving Average Convergence Divergence (MACD)
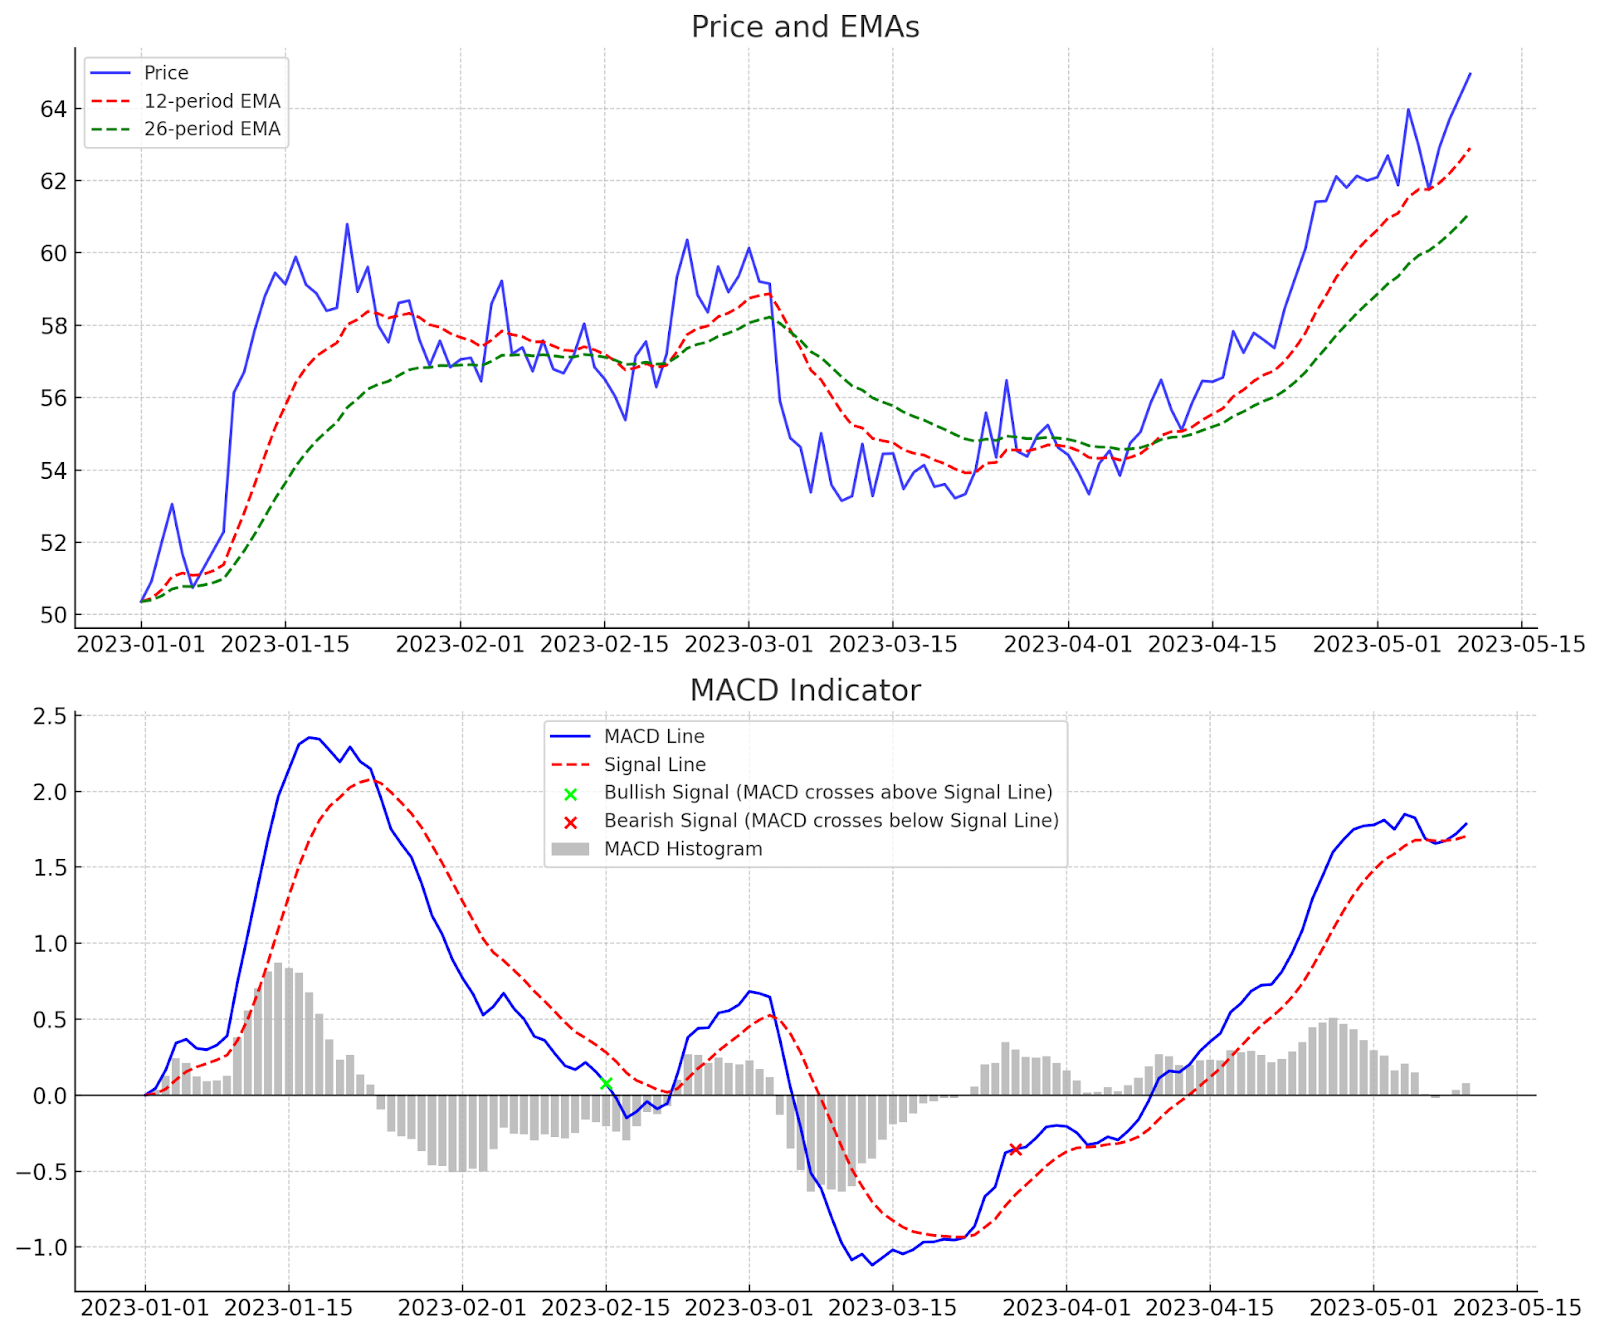
Moving Average Convergence Divergence, or MACD, is a momentum-based trend-following indicator. It illustrates the relationship between two moving averages of an asset’s price, providing insights into the strength, direction, momentum, and duration of a trend.
MACD is composed of three elements:
MACD Line: The MACD line is the difference between the 12-period Exponential Moving Average (EMA) and the 26-period EMA.
Signal Line: This is the 9-day EMA of the MACD line.
MACD Histogram: This is the difference between the MACD line and the signal line, visually representing when the two lines cross over.
When the MACD line crosses above the signal line, it’s a bullish signal, suggesting a good time to buy. Conversely, when the MACD line crosses below the signal line, it’s a bearish signal, indicating a good time to sell.
Join UEEx
Experience the World’s Leading Digital Wealth Management Platform
The calculation of MACD involves the following steps:
Compute the 12-period EMA of the closing price.
EMA = (Close – Previous EMA) * (2/(N+1)) + Previous EMA (where N is the period)
Compute the 26-period EMA of the closing price using the same formula.
Subtract the 26-period EMA from the 12-period EMA to obtain the MACD line
MACD Line = 12-period EMA – 26-period EMA
Compute the 9-period EMA of the MACD line to get the signal line.
Signal Line = 9-period EMA of MACD Line
Subtract the signal line from the MACD line to obtain the MACD histogram.
The formula is MACD Histogram = MACD Line – Signal Line.
How to Use MACD in Crypto Trading
MACD is a versatile tool with several uses:
Identifying Potential Buy and Sell Signals: When the MACD line crosses above the signal line, it might be a good time to buy. Conversely, when the MACD line crosses below the signal line, it might be a good time to sell.
Recognizing Bullish and Bearish Divergences: If the price of an asset is making a new high, but the MACD line is not, it’s a bearish divergence, indicating that the upward momentum might be waning.
Conversely, if the price is making a new low, but the MACD line is not, it’s a bullish divergence, suggesting that the downward momentum might be slowing.
Assessing the Strength of a Trend: The MACD can also help assess the strength of a trend. A high MACD value suggests a strong trend, while a low MACD value indicates a weak trend.
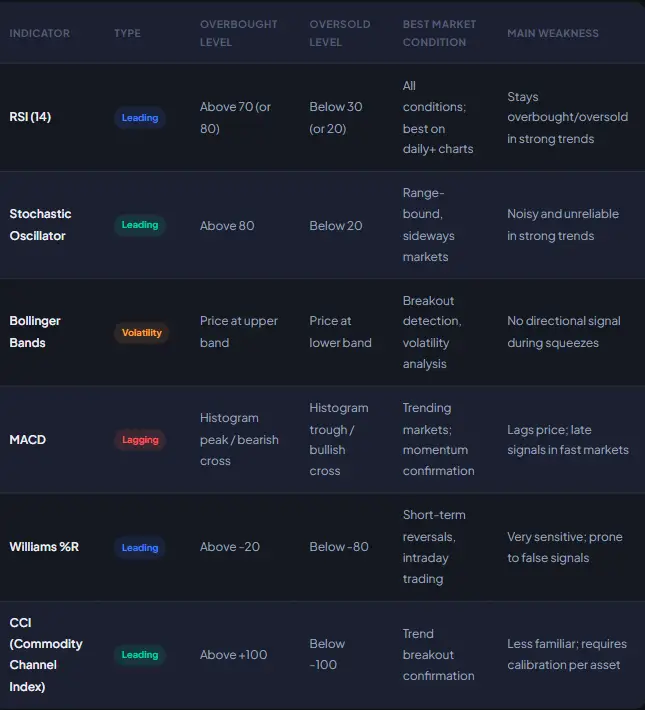
How Do the Main Overbought and Oversold Indicators Compare Against Each Other?
Common Mistakes Traders Make When Using These Indicators
Here are some common mistakes traders make when using these indicators:
1. Overreliance on a Single Indicator
One of the most common mistakes traders make is relying too heavily on a single indicator for buy or sell signals without considering the broader market context.
No indicator is foolproof, and using them in isolation can lead to misinterpretation of market conditions.
Instead, combine indicators for a more comprehensive view. For instance, use RSI in conjunction with Bollinger Bands to validate overbought or oversold conditions with market volatility.
2. Disregarding Overall Market Trends
Indicators might signal an oversold condition, tempting a buy in a downtrending market. However, without considering the overall market trend, this could lead to buying into a falling market with no immediate recovery in sight.
To avoid this, always contextualize indicator signals within the larger market trend. Use trend analysis tools alongside overbought and oversold indicators to gauge whether the market is in an uptrend, downtrend, or range-bound.
Join UEEx
Experience the World’s Leading Digital Wealth Management Platform
3. Misinterpreting the Duration of Overbought/Oversold Conditions
Just because an asset enters overbought or oversold territory doesn’t mean it will immediately reverse. Cryptocurrencies can remain in these conditions longer than anticipated, leading to premature trading decisions.
Patience is key. Wait for additional confirmation signals before acting. For example, look for a reversal pattern on the price chart or a crossover in the Stochastic Oscillator to confirm the reversal.
4. Overlooking Volume and Other Confirmatory Signals
Volume is a crucial factor that can confirm or negate the signals provided by overbought and oversold indicators. A buy signal with increasing volume can lend more credibility to the potential for a reversal.
Do incorporate volume analysis into your trading decisions. An increase in volume along with an indicator signal can provide a stronger basis for a trade.
5. Falling for False Signals During High Volatility
Cryptocurrency markets are known for their high volatility, which can lead to false signals from overbought and oversold indicators. Acting on these without further validation can result in poor trading decisions.
Always utilize a filter or a secondary indicator to validate signals. For instance, applying a moving average filter can help smooth out the price data and reduce the likelihood of acting on a false signal.
6. Failure to Adjust Indicator Settings
The default settings of indicators like the 14-period RSI or 20-period SMA for Bollinger Bands might not suit all market conditions or the specific asset being traded.
Customize the indicator settings based on the asset’s volatility and your trading timeframe. Experiment in a demo account to find the settings that best align with your strategy.
7. Neglecting Risk Management
Even with the best indicators, not every trade will be successful. Some traders make the mistake of neglecting risk management, putting too much capital at risk based on the signals from these indicators.
It’s crucial to have a solid risk management strategy in place, which includes setting stop losses and only risking a small percentage of your trading capital on each trade.
Join UEEx
Experience the World’s Leading Digital Wealth Management Platform
Trading isn’t a game of luck, it is a game of alignment.
Look, figuring out overbought and oversold indicators like RSI or Stochastic isn’t about jumping at every little price jump. It’s really about developing the intuition to see when a trend is finally losing steam. Y
Disclaimer: This article is intended solely for informational purposes and should not be considered trading or investment advice. Nothing herein should be construed as financial, legal, or tax advice. Trading or investing in cryptocurrencies carries a considerable risk of financial loss. Always conduct due diligence before making any trading or investment decisions.


")


")


