

As per the “90-90-90 rule,” 90% of new traders lose 90% of their initial capital within their first 90 days of trading. However, understanding volume and price divergence can help ensure your trading journey doesn’t follow this path.
Volume and price divergence occur when there’s a discrepancy between an asset’s price movement and its trading volume. Typically, price and volume are positively correlated — when the price rises, the volume should also increase as investor interest grows.
In this article, we’ll explore the significance of volume and price divergence in cryptocurrency trading, its types, and interpretation methods.
Key Takeaways
- Volume and price divergence occur when an asset’s price movement does not align with its trading volume, signaling potential trend reversals or weakening trends.
- Bullish divergence suggests a potential price rise, while bearish divergence signals a potential price drop.
- Tools like On-Balance-Volume (OBV), Chaikin Money Flow (CMF), and VWAP help identify divergences and assess market trends.
- Combine volume divergence analysis with other indicators and apply it across multiple time frames to reduce false signals and improve trading decisions in cryptocurrency markets.
What is Volume and Price Divergence?
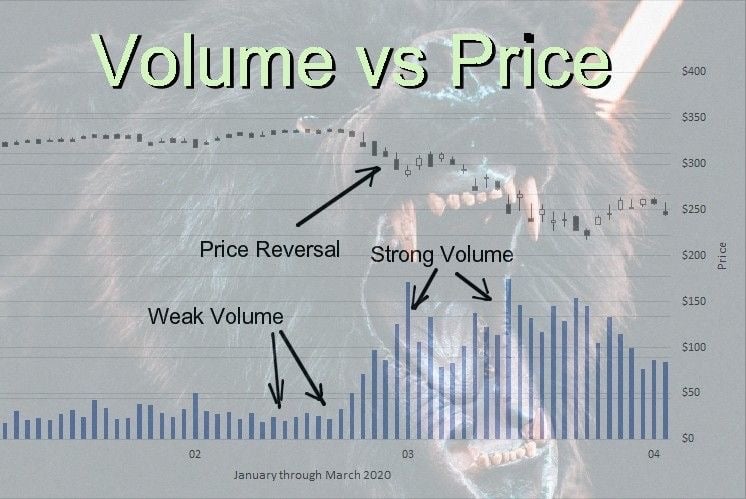
Source: Pinterest
In highly volatile crypto markets, analyzing volume and price divergence (VPD) proves invaluable for identifying trend reversals and assessing market strength. This method provides a more comprehensive understanding of market dynamics, improving decision-making and trading strategies.
Volume and price divergence occur when there is a discrepancy between an asset’s price movement and its trading volume. Typically, price and volume share a positive correlation, that is as prices rise, trading volumes increase due to heightened investor interest.
However, when this relationship diverges, it often signals a potential shift in the asset’s trend. Recognizing and understanding these divergences equips traders to make more accurate predictions about upcoming market movements.
How Does Volume and Price Divergence Work?
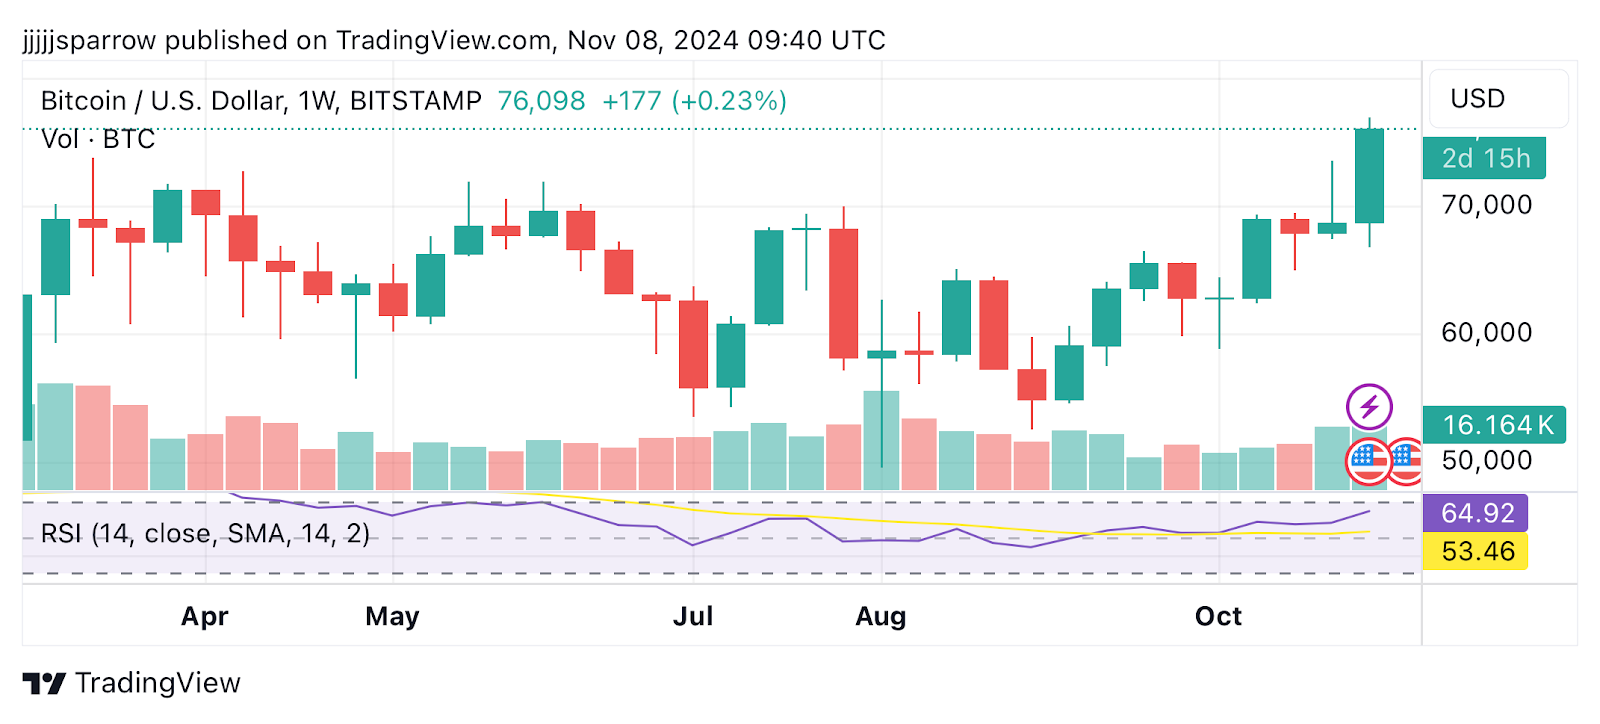
Source: TradingView
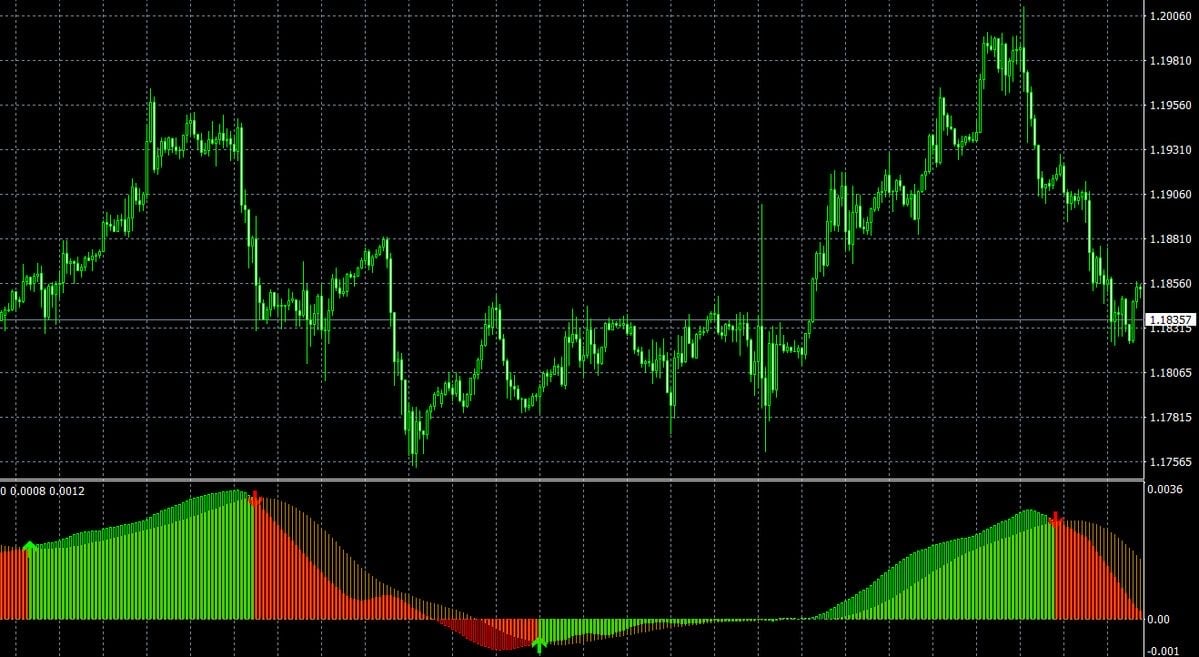
The volume and price divergence indicator is designed to assess the relationship between volume and price movements in financial markets, helping traders identify divergences that may signal a shift in market trends.
Key Components
Below is an overview of how volume and price divergence works:
1. Volume Calculation:
- Buying Volume: This is determined by calculating the relationship between the closing price and high/low range. If the closing price is closer to the low, more volume is attributed to buying.
- Selling Volume: If the closing price is closer to the high, the volume is considered selling.
Formulas:
buyVolume = high == low ? 0 : volume * (close – low) / (high – low)
sellVolume = high == low ? 0 : volume * (high – close) / (high – low)
2. Visualizing Volume:
The indicator plots total volume in red and buying volume in green, allowing traders to visually differentiate the volume dynamics during price changes.
3. Rate of Change (ROC):
ROC measures the percentage change between the current price and the price from a specific number of periods in the past. The ROC for both volume and price is calculated over a set period, showing how they evolve relative to each other.
ROC = source / source[length]
ROC2 = source2 / source2[length2]
4. Volume/Price Divergence (VPD):
The VPD is the ratio of the ROC of volume to the ROC of price.
Key insights include:
- High VPD (above 10): Indicates a strong divergence, suggesting price changes are not supported by volume.
- VPD around 1: Implies that volume and price are moving in sync.
5. Guidance Lines:
- Horizontal lines at levels 10 (indicating high divergence) and 1 (indicating alignment) are included to assist in assessing market conditions.
Interpretation
Identifying Divergence: If the price reaches a new high without a corresponding increase in volume (or vice versa), it could signal a potential reversal or trend weakness.
Understanding Market Sentiment: Analyzing buying vs. selling volume gives insight into market sentiment, helping traders make informed choices.
Anticipating Strong Moves: A high VPD during a breakout suggests volume is building without significant price movement, which could precede a strong price action.
Exercise Caution: When volume surges without significant price changes, it may foreshadow an impending spike in volatility, leading to rapid price movement in either direction.
On the whole, the VPD indicator provides valuable insights into the strength of price trends and can help traders identify potential reversals or upcoming breakouts based on volume analysis.
“As the stock trades lower each day, what is the volume doing? Right! It is increasing. The volume is confirming the trend. We always check the volume. If a stock is advancing and the volume is declining, then it is not confirming the trend.” —
Types of Volume and Price Divergence
There are two primary types of volume and price divergence: bullish divergence and bearish divergence. Each offers insights into potential shifts in market sentiment and trend direction.
Bullish Divergence
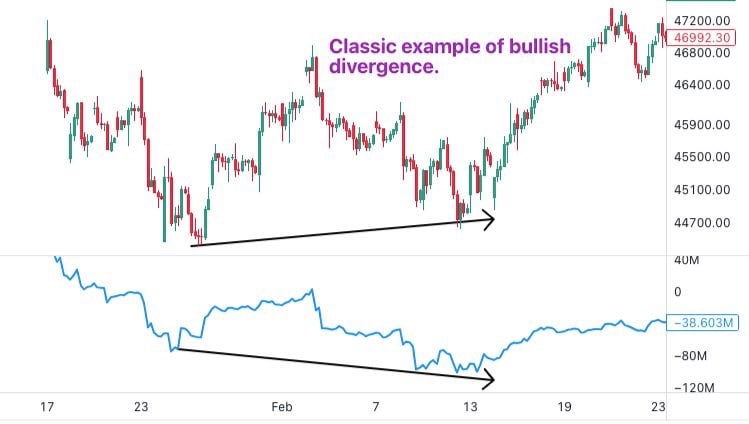
A bullish divergence happens when the price of an asset makes lower lows ( the lowest point drops below the prior low, indicating a downward trend), but volume or another momentum indicator, like the Relative Strength Index (RSI), makes higher lows (when the price reaches a trough that is above the previous low, suggesting a strengthening upward momentum).
This often suggests that buying pressure is increasing, despite the price decline. Bullish divergences can signal a potential reversal to the upside.
For example, in a downtrend, an asset’s price makes consecutive lower lows, but the volume or RSI starts trending upward. This pattern may hint that the selling momentum is losing strength, and buyers could soon step in, pushing the price higher.
Bearish Divergence
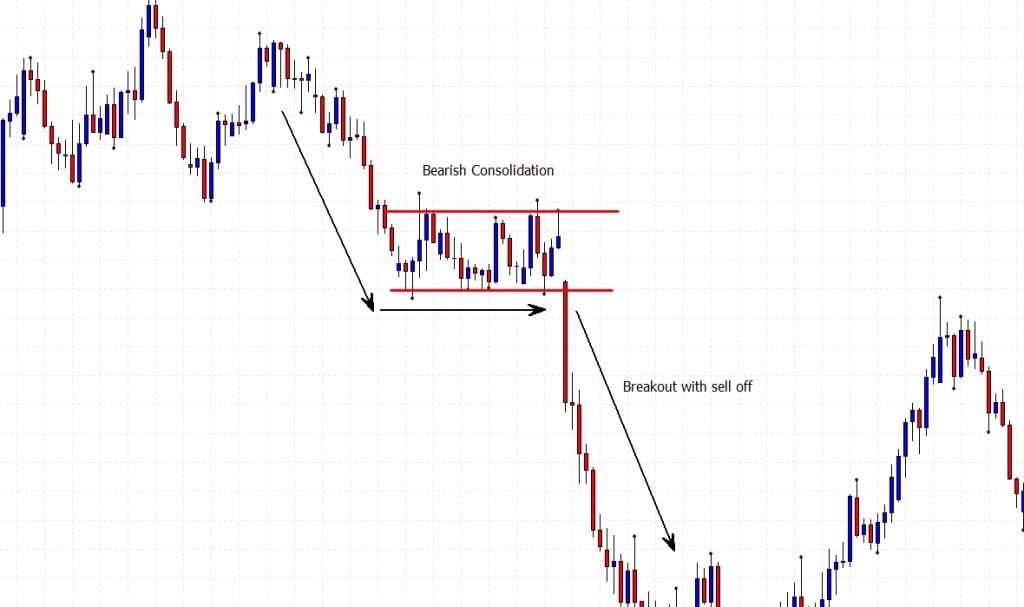
Source: Pinterest
A bearish divergence occurs when an asset’s price makes higher highs (when the highest point reached by an asset’s price surpasses the previous peak), but volume or momentum indicators make lower highs (when the price peaks at a level lower than the previous high). This divergence indicates waning buying interest, even as the price rises, potentially warning traders of an impending downtrend.
For example, in an uptrend, an asset’s price continues to make new highs, but the trading volume or RSI is decreasing. This pattern could suggest that buyers are losing momentum, increasing the likelihood of a price pullback or reversal.
How to Trade Volume and Price Divergence
Source: Pinterest
Volume and price divergence can be applied to various trading strategies, including swing trading, day trading, and even long-term investing. Below are a few strategies for using divergence in your trading:
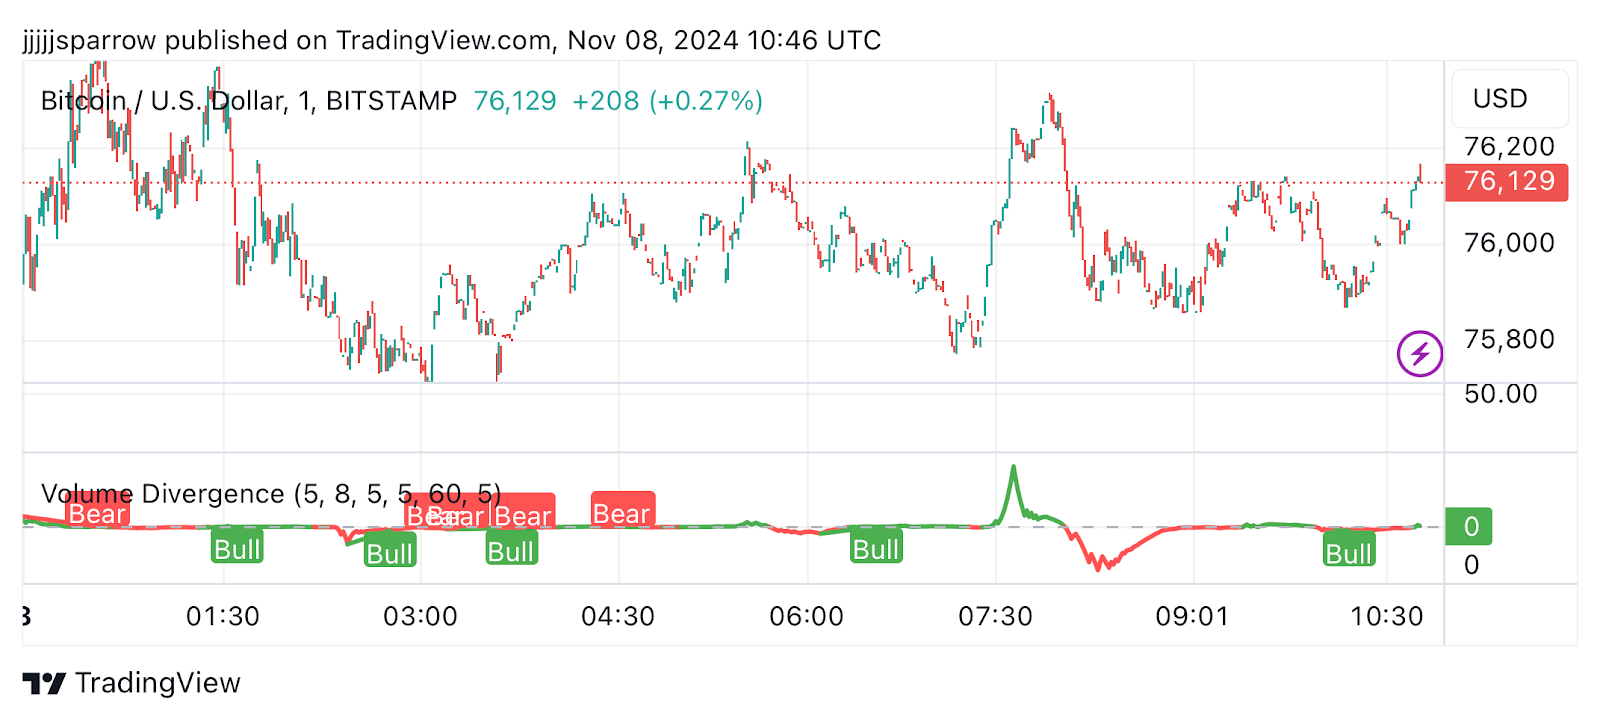
Identify Overbought and Oversold Conditions

Source: TradingView
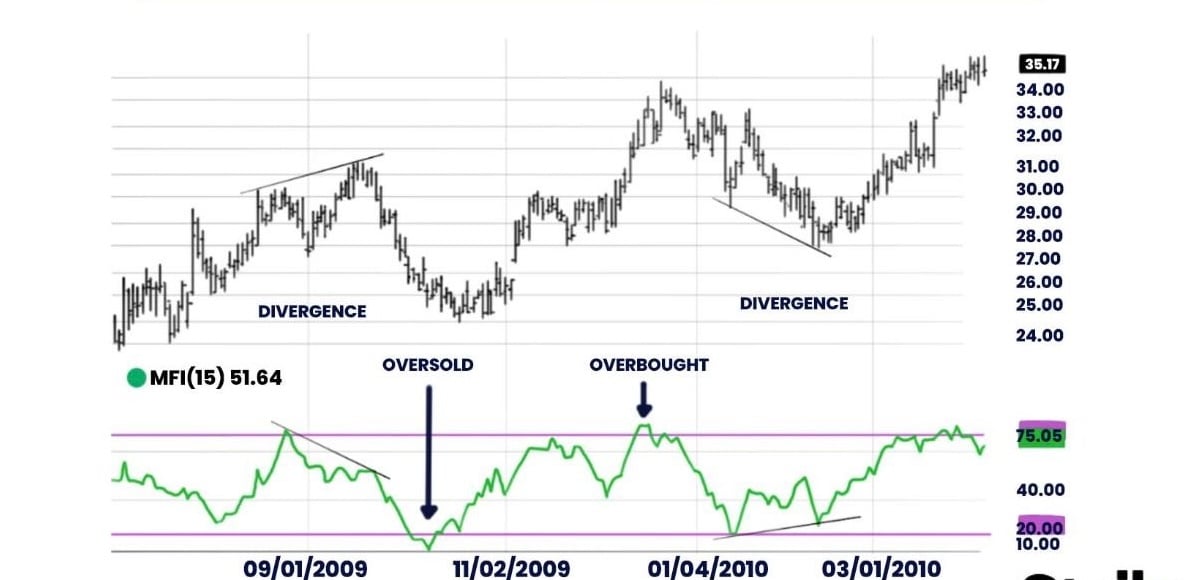
When volume diverges from price, it can indicate that an asset is overbought or oversold. If price continues to rise but volume declines, it could signal an overbought condition, suggesting a potential sell opportunity. Conversely, if price declines but volume rises, the asset might be oversold, presenting a buy opportunity.
Confirmation with Other Indicators
Source: TradingView
Volume and price divergence should ideally be used alongside other technical indicators like RSI, Moving Averages, or MACD. For example, if both volume divergence and RSI indicate oversold conditions, it strengthens the likelihood of a reversal.
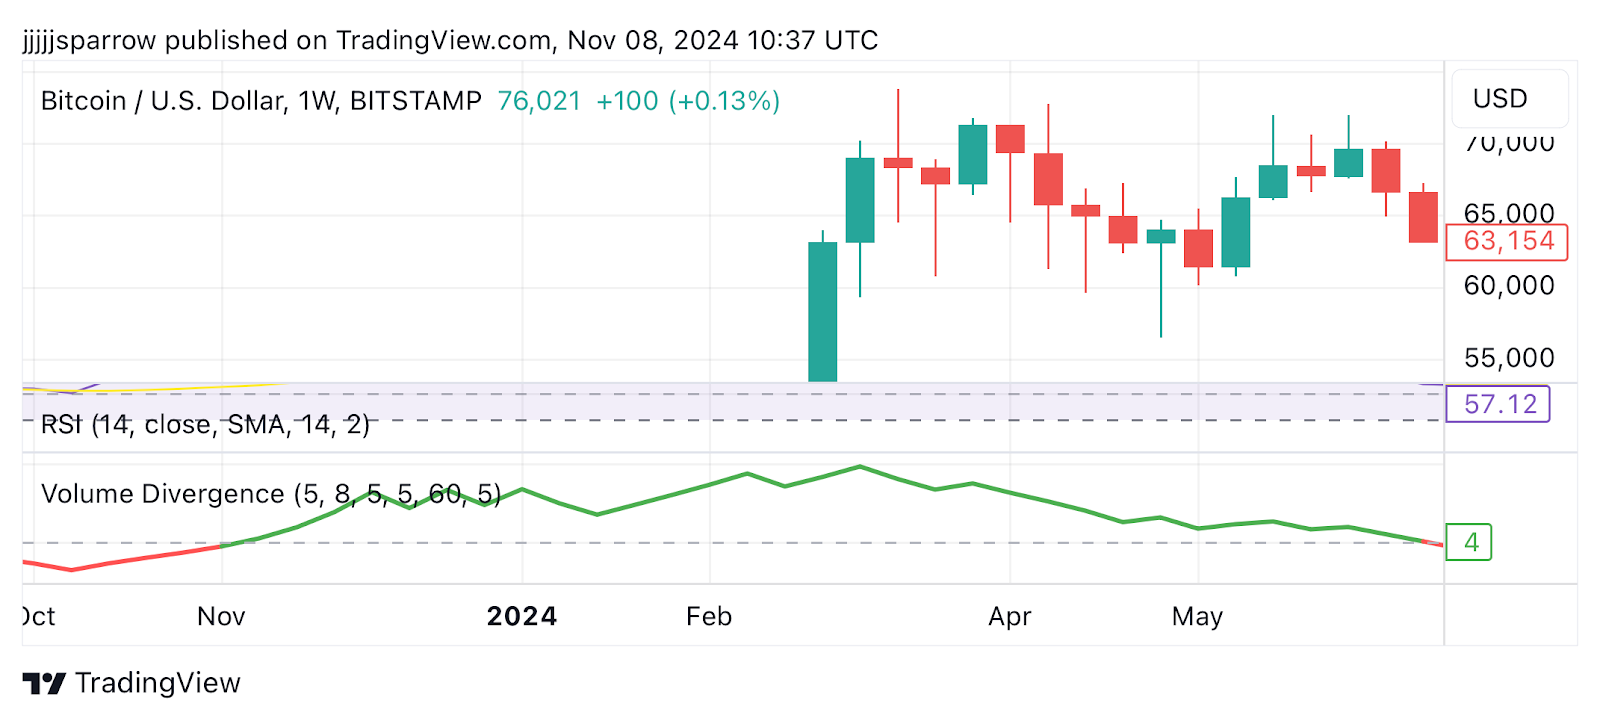
Apply Divergence to Multiple Time Frames
Source: TradingView
Analyzing volume and price divergence across different time frames can provide a broader view of market sentiment. For instance, a daily bullish divergence supported by weekly data can offer a more confident entry signal for a long position.
Volume and Price Divergence in Crypto Markets
In cryptocurrency markets, volume and divergence can be a particularly powerful tool due to high volatility and the influence of market sentiment. Several factors make volume divergence an effective tool for crypto trading:
Market Manipulation Awareness
Cryptocurrencies are highly susceptible to manipulation by large investors or “whales.” As of August 2024, four Bitcoin wallets collectively owned 3.56% of the total circulating Bitcoin supply, according to BitInfoCharts. Additionally, the top 113 wallets accounted for over 15.4% of all Bitcoin. Beyond these, there are thousands of accounts holding less than 10,000 BTC each, which can still be classified as whales.
The significant influence of these holders, often referred to as whales, allows them to impact Bitcoin’s supply and demand dynamics, leading to price fluctuations. When whales accumulate more Bitcoin, prices typically rise, whereas selling portions of their holdings can cause declines.
Due to the public nature of blockchain transactions, these whales’ wallets are closely monitored by the broader trading community. Consequently, their actions or anticipated moves often trigger major price movements as traders react accordingly.
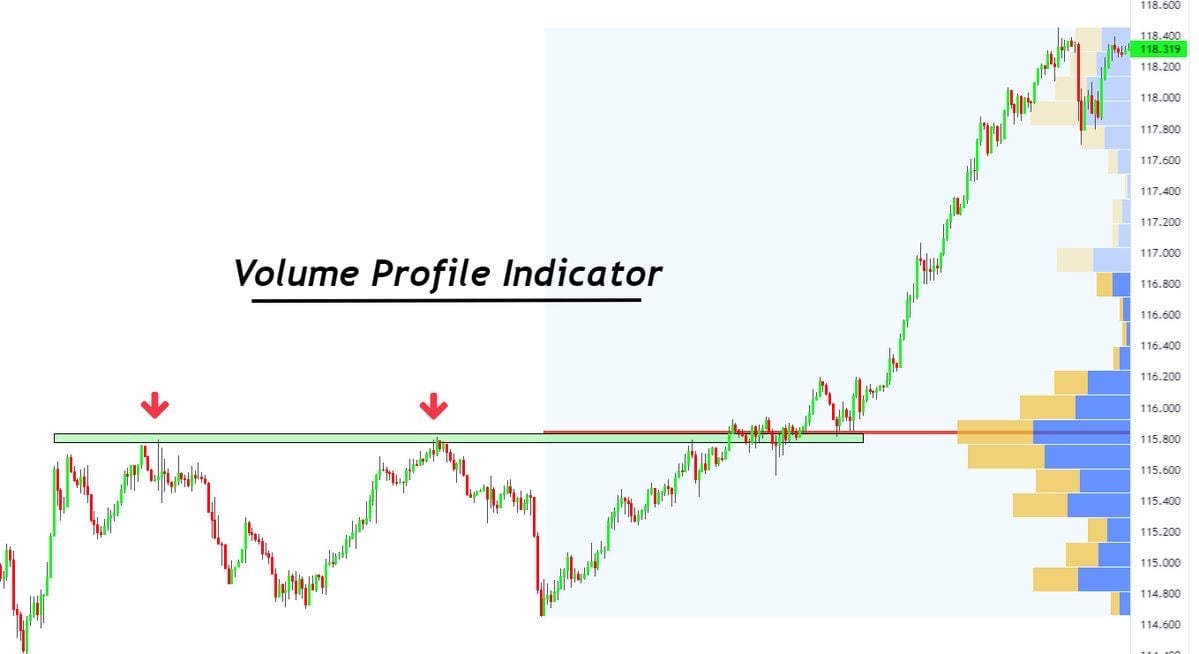
Support and Resistance Levels
By studying volume around key support and resistance levels, traders can gauge the strength of these levels. For instance, a bearish divergence near resistance could signal a price reversal.
“Entry and Exit points are vital parts of Trading and Investing. Whether you are Day Trading, Swing Trading, or are a Long Term Investor.”
—- Fred McAllen, Charting and Technical Analysis
Limitations of Volume and Price Divergence
While volume and price divergence can be insightful, it’s important to recognize its limitations:
False Signals
Divergence alone doesn’t guarantee a reversal. Therefore, combining divergence analysis with other indicators such as Relative Strength Index (RSI) can reduce the risk of false signals.
Market Sentiment Shifts
Major news or economic events can disrupt divergence patterns. This could be in the form of regulatory announcements or large-scale adoptions of a cryptocurrency, which can impact its volume and price relationship.
For example, Cardano (ADA) recovered from its mid-year downturn, hitting a bullish uptrend of 268% in the past month after founder Charles Hoskinson announced plans to collaborate with Donald Trump’s administration in 2025 to drive favorable crypto regulations.
Why is Volume Important in Trading?
Source: Pinterest
As estimated by Grand View Research, the global market is projected to expand at a compound annual growth rate (CAGR) of 12.5% by 2030. Therefore a good understanding of volume in trading could be a game-changer for a trader.
Volume reflects the number of cryptocurrency units traded within a given time frame. High trading volume suggests strong interest and participation, which is generally seen as a healthy sign for a trend’s continuation.
Volume divergence, on the other hand, can serve as a warning sign. For instance, if the price of a cryptocurrency rises but the volume declines, it could indicate a lack of interest or momentum, possibly signaling an upcoming reversal.
Key Points to Remember:
- High volume typically supports price movement, whether upward or downward.
- Low volume or declining volume may indicate weak trend momentum.
- Divergences between volume and price can signal potential market reversals.
How to Use Trading Volume to Enhance Your Trading Strategy

Source: Pinterest
Trading volume can play a key role in formulating an effective trading strategy. Here’s how you can leverage trade volume data to improve your strategy and potentially boost trading outcomes:
Trend Confirmation
Source: Pinterest
Trading volume can help confirm both the direction and strength of a current price movement. An increase in volume during a price rise or a decrease during a short pullback indicates a strong uptrend. Similarly, if volume rises during a price decline and falls during temporary rallies, it signals that the downtrend is likely to persist.
Identifying Reversals

Source: Pinterest
While high trading volume typically confirms a strong trend, unusually high volume—especially when it occurs suddenly—can signal a potential trend reversal. For instance, if an asset is in a downtrend but experiences a spike in volume paired with a small price rally, this may indicate that buyers are entering the market and driving the price upward.
Breakouts and Breakdowns

Source: Pinterest
Trading volume is crucial when developing strategies around price breakouts or breakdowns. A breakout happens when the price breaks above a resistance level and moves upward, while a breakdown occurs when the price falls below a support level and moves downward.
If a breakout or breakdown is accompanied by a surge in volume, it typically signals that the new trend—whether bullish or bearish—has momentum and could be sustained.
Combine with Volume Averages and Volume Indicators

To understand the baseline trading volume for an asset, use moving averages like the Simple Moving Average (SMA) or Exponential Moving Average (EMA). These averages smooth out daily volume fluctuations, providing a clearer view of the volume trend.
Additionally, incorporating volume indicators such as the Volume Price Trend (VPT), On-Balance Volume (OBV), or Accumulation/Distribution Line (ADL) can further enhance your trading strategy by providing deeper insights into the market dynamics.
“Chart patterns are very accurate. They have proven their accuracy and predictability time and time again, but you have to wait for them to develop.”
—- Fred McAllen, Charting and Technical Analysis
How to Use Volume Divergence to Improve Your Trading Strategy

Analyzing volume divergence can play a pivotal role in refining your trading strategy and boosting trade outcomes. Here are several strategies to leverage volume divergence for better trading performance:
Spotting Volume Divergences
Start by identifying discrepancies between price trends and volume movements. If prices are rising but volume is declining, adjust your strategy for a potential bearish volume divergence, which may signal an impending trend reversal. In such cases, reducing buy positions or considering sales can be beneficial.
On the other hand, if prices are falling but volume is increasing, indicating bullish volume divergence, prepare for a possible upward reversal as buying pressure is building.
Combine Volume Divergence with Price Action
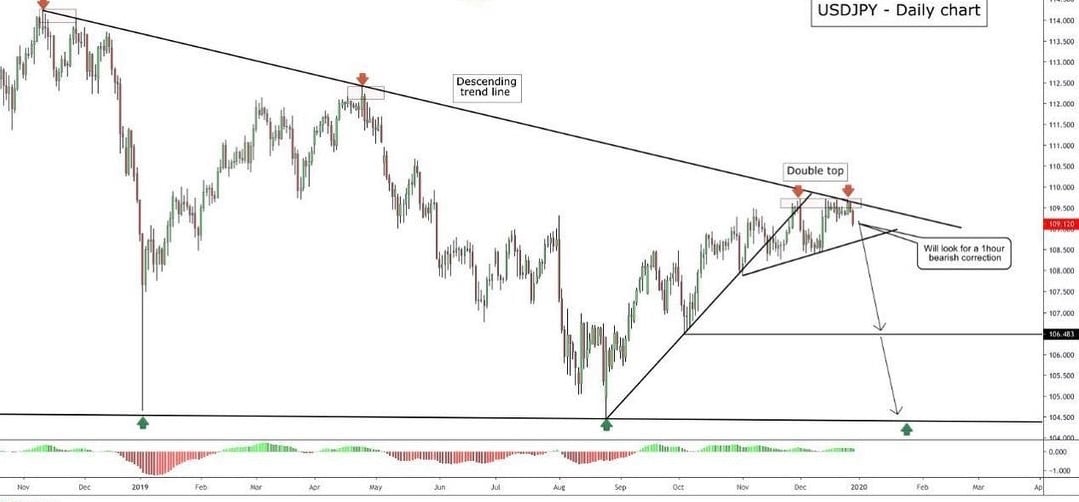
Enhance your trading strategy by integrating volume divergence with price action analysis. Look for chart patterns such as head and shoulders, double tops, or double bottoms. For instance, a double top accompanied by diminishing volume on the second peak could confirm a bearish volume divergence and suggest a high probability of a trend reversal.
Use Technical Indicators
Incorporate technical indicators like moving averages, RSI, or MACD to complement your volume divergence analysis. For example, a bearish volume divergence paired with an overbought RSI can serve as a robust signal to consider selling or shorting. Similarly, a bullish divergence confirmed by MACD crossovers can support a buying decision.
Define Entry and Exit Points
Use volume divergence insights to establish clear entry and exit points for trades. For instance, if you observe bullish volume divergence, consider entering a long position near a price trough, especially if confirmed by other indicators. Conversely, bearish volume divergence can signal an ideal point to initiate a short position near a price peak.
Implement Risk Management Strategies
Ensure your trading strategy incorporates risk management to protect against false signals and unexpected market shifts. This can be achieved through strict stop-loss orders based on key support/resistance levels or a set percentage of your trading capital to minimize potential losses.
Using Volume Indicators to Identify Divergences
Volume indicators are essential tools for spotting volume and price divergence. The following are popular volume indicators for identifying divergences and assessing market trends.
On-Balance Volume (OBV)
Source: Pinterest
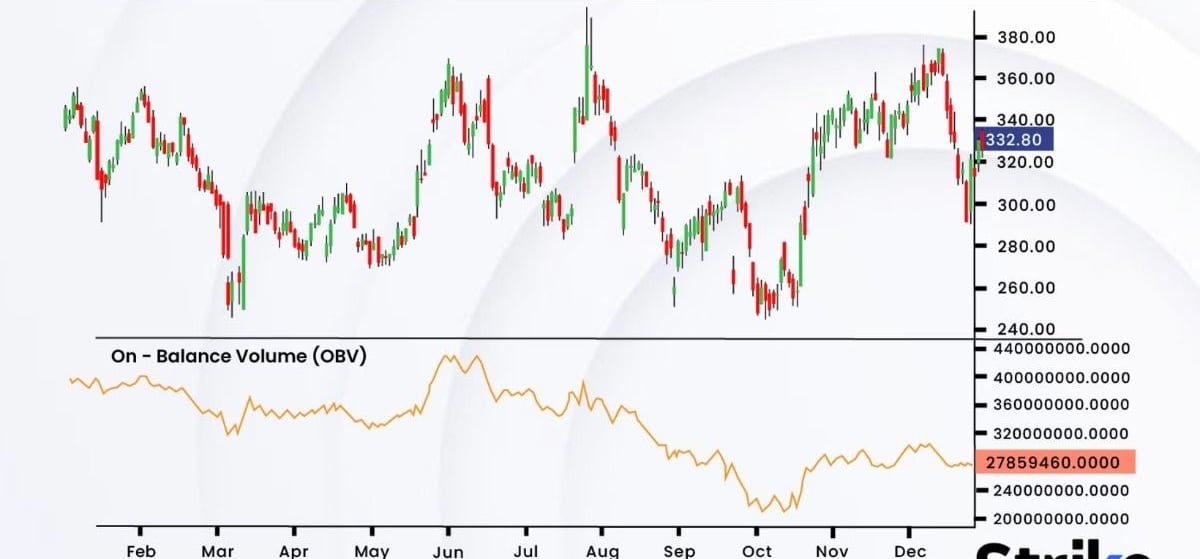
On-Balance Volume accumulates volume based on whether the price closes higher or lower than the previous period. When OBV diverges from price, it often signals a trend shift. For example:
- If OBV is increasing while the price declines, it suggests that buyers are accumulating, signaling a potential price rise.
- If OBV is decreasing while the price rises, it indicates a bearish divergence and potential price drop.
Chaikin Money Flow (CMF)
Source: Pinterest
The Chaikin Money Flow indicator measures buying and selling pressure over a specific period. Positive CMF values indicate buying pressure, while negative values suggest selling pressure. Divergences between CMF and price can signal potential reversals or trend continuations.
Volume-Weighted Average Price (VWAP)

Source: Pinterest
The Volume-Weighted Average Price helps traders understand an asset’s average trading price based on volume. When price diverges significantly from the VWAP, it may indicate overbought or oversold conditions, suggesting an upcoming reversal.
Conclusion
Volume and price divergence is an invaluable tool for crypto traders aiming to identify potential market reversals and assess trend strength. With the knowledge to analyze discrepancies between price and trading volume, traders can gain insights into whether a trend is likely to continue or reverse.
While no tool guarantees success, understanding and leveraging volume and price divergence offers traders a greater level of insight into market trends, helping them make better-informed decisions in the cryptocurrency ecosystem.
FAQs
What is volume and price divergence?
Volume and price divergence occurs when the price of an asset and its trading volume move in opposite directions, signaling potential trend reversals or weakening momentum.
Why is volume important in trading?
Volume is important in trading because it indicates the strength and interest in an asset’s price movement. High volume supports trends, while declining volume may signal weak momentum or potential reversals.
What are common types of divergence?
The two common types of divergence are bullish divergence (price falls, volume/momentum rises) and bearish divergence (price rises, volume/momentum falls).
Which indicators help identify volume divergence?
Popular indicators that help identify volume divergence include On-Balance Volume (OBV), Chaikin Money Flow (CMF), and Volume-Weighted Average Price (VWAP).


