

Chaikin Money Flow (CMF) is a volume-weighted oscillator developed by analyst Marc Chaikin that measures buying and selling pressure over a set period, typically 20 or 21 trading sessions.
It combines where an asset’s price closes within its daily range with the volume of that session to produce a single value between -1 and +1.
This guide walks through exactly how it works, how to calculate it, how to read its signals, and critically how to combine it with other tools for a more reliable trading strategy
Read Also: Key Indicators for Successful Ethereum Technical Analysis Trading
Who Created Chaikin Money Flow?
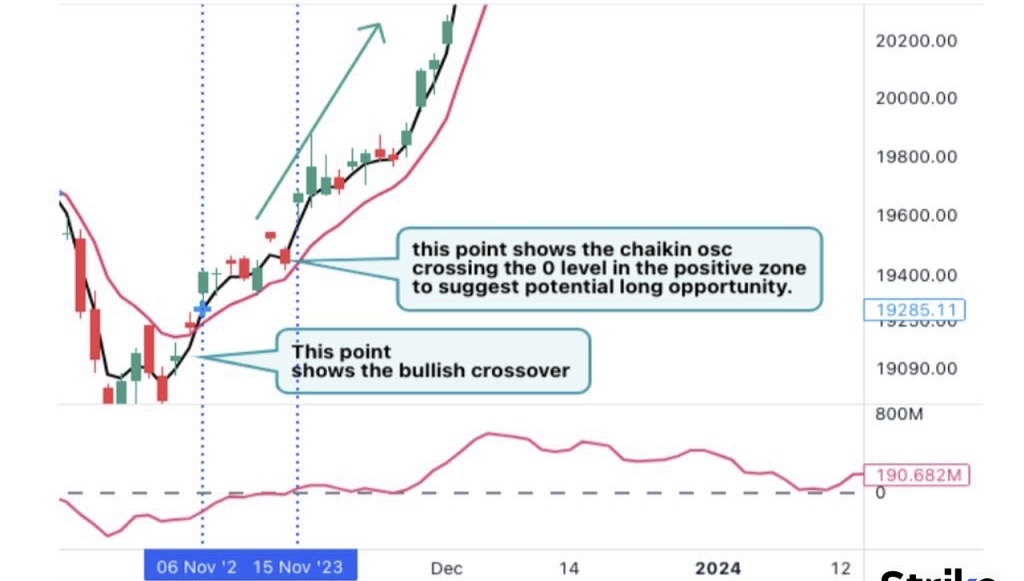
Source: Pinterest
Chaikin Money Flow (CMF) was developed by Marc Chaikin, one of the early pioneers of applying money flow analysis to financial markets.
Chaikin built on his earlier work, the Accumulation/Distribution Line, to create an oscillator that compresses money flow analysis into a shorter, more actionable lookback window typically 20 or 21 periods.
According to ResearchGate, about 90% of traders end up losing money. To avoid becoming another statistic in the unpredictable market, it’s important to improve your understanding of trading tools to improve your chances of profitability.
The core insight behind the indicator is elegantly simple: where a price closes within its daily range, combined with how much volume accompanied that close, reveals the true balance of power between buyers and sellers.
A market that consistently closes near the top of its range on heavy volume is a market where buyers are in control. One that consistently closes near the bottom, especially on high volume, is controlled by sellers.
CMF takes this logic and converts it into a single oscillating number that fluctuates between negative 1 and positive 1, with zero acting as the neutral dividing line.
Positive values represent net accumulation. Negative values represent net distribution. The further the reading is from zero in either direction, the stronger the conviction behind that buying or selling pressure.
How Chaikin Flow Is Calculated?
The calculation follows three sequential steps.
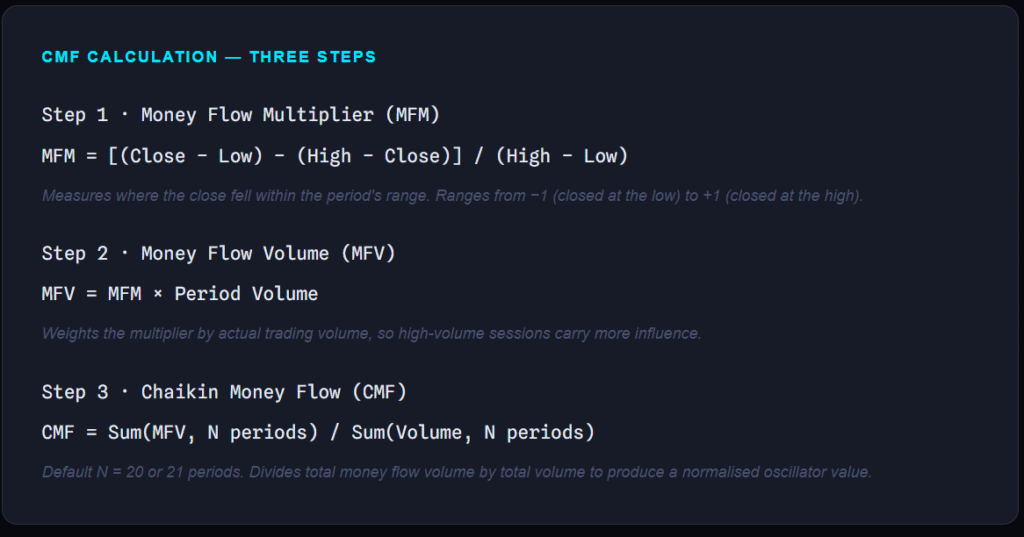
What this formula achieves is a volume-normalised picture of whether money has been flowing into or out of an asset over the chosen lookback window.
Because volume acts as a weighting factor, a day with 10 times the average trading volume carries 10 times the influence on the final reading.
This is what makes CMF genuinely more informative than price-only indicators, it cannot be faked by low-volume moves.
What Is the Standard CMF Lookback Period for Crypto?
The default setting on most charting platforms is 20 or 21 periods. On a daily chart, this represents approximately one month of trading activity.
On a 4-hour chart, it covers roughly four days of data. Shorter periods of 10 to 14 increase sensitivity and generate more signals, which can be useful for active short-term traders but also increases the risk of false signals.
Longer periods of 30 to 50 smooth the indicator and reveal broader, slower-moving accumulation or distribution patterns, more useful for swing traders and medium-term position holders.
In crypto markets specifically, where volatility is higher and sessions run 24 hours a day 7 days a week, many traders adjust the default slightly.
Using CMF with a 14-period setting on the 4-hour chart for Bitcoin or Ethereum is a common approach in 2025, balancing responsiveness with noise reduction.
How Do You Read Chaikin Flow Signals?
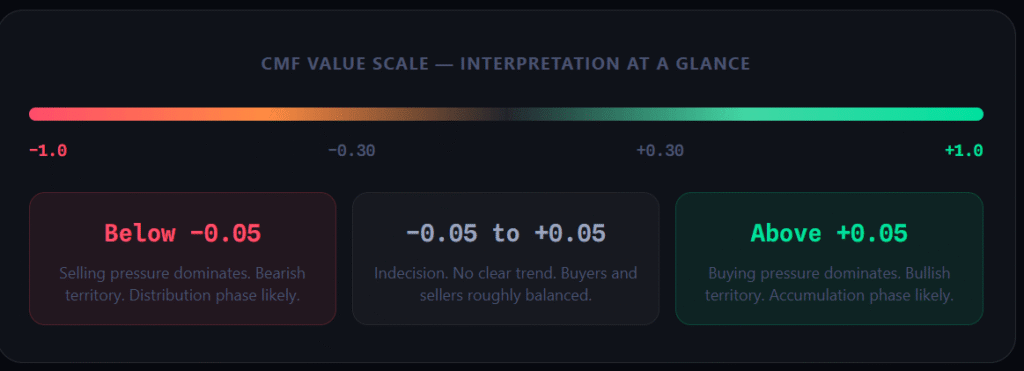
Rather than treating every zero-line cross as a signal, experienced traders use a small buffer acting only when CMF moves decisively above +0.05 or below -0.05.
This filter significantly reduces whipsaws, which are particularly common in crypto markets during periods of low conviction or sideways price action.
What Does a Bullish CMF Signal Look Like in Practice?
Can you just picture this: Bitcoin has been consolidating between $90,000 and $95,000 for two weeks. Price action looks flat and unremarkable.
But your CMF indicator on the daily chart has been climbing steadily from 0 to +0.18 over that same period. This tells you something price alone cannot: institutional buyers and large participants are quietly accumulating during the consolidation.
When the price eventually breaks above $95,000 with high volume and a corresponding CMF reading above +0.20, that breakout carries genuine conviction behind it rather than being a low-volume head-fake.
How Does Chaikin Money Flow Compare to Similar Indicators?
CMF is often confused with other volume-based tools, particularly the Money Flow Index and the On-Balance Volume indicator.
Knowing where each excels helps you choose the right tool for each market condition.
| Indicator | What It Measures | Timeframe Focus | Best Used For | Key Limitation |
| On-Balance Volume (OBV) | Cumulative buying and selling volume pressure over all time | Recent (20-21 periods) | Trend confirmation and breakout validation | Does not account for gap openings between sessions |
| On-Balance Volume (OBV) | Price and volume momentum over a short window (default 14) | Long-term cumulative | Identifying sustained institutional positioning | Can diverge from price for extended periods |
| Money Flow Index (MFI) | Price and volume momentum over a short window (default 14) | Short-term (14 periods) | Finding overbought and oversold conditions | Does not distinguish where in the range price closes |
| RSI (Relative Strength Index) | Price momentum only — no volume component | Short-term (14 periods) | Momentum and reversal signals | Ignores volume entirely, can mislead in low-volume rallies |
| Chaikin Oscillator | Momentum behind the Accumulation/Distribution Line | Very short (EMA-based) | Catching early reversals faster than CMF | More prone to false signals than CMF in choppy markets |
The key takeaway is that CMF sits between OBV (long-term context) and MFI (short-term overbought/oversold) in terms of its temporal focus.
It is the most useful tool when you need to answer the specific question: is money actively flowing into or out of this asset over the past few weeks, and is the current price trend backed by real volume conviction?
How Do You Apply Chaikin Money Flow in a Crypto Trading Strategy?
Applying CMF to a live crypto trading workflow whether you are analysing Bitcoin on Binance, Ethereum on Coinbase, or altcoins on UEEx follows a consistent process regardless of the asset.
- Add CMF to Your Chart
Open TradingView or your preferred charting tool, select your asset (Bitcoin, Ethereum, or any liquid
altcoin), and search for Chaikin Money Flow in the indicators library.
Set the period to 20 or 21 for standard analysis. It will appear as a line oscillator below the price chart. - Determine the Dominant Trend First
Before reading any CMF signal, identify the macro trend using a higher timeframe. Check the daily or weekly chart.
Establish whether Bitcoin or your target asset is in an uptrend, downtrend, or consolidation. CMF signals are most reliable when aligned with the primary trend direction. - Watch for CMF Crossovers and Divergences
Look for CMF to cross decisively above +0.05 for bullish signals, or below -0.05 for bearish ones. Simultaneously scan for divergences between the CMF line and price action.
A bullish divergence forming near a key support level is one of the highest-probability setups the indicator produces. - Set Risk Parameters Before Entry
CMF is a directional and momentum tool, it does not provide stop-loss levels. Always set a predefined stop-loss below the nearest support level and size your position according to your risk tolerance before executing.
Use CMF to time entry and evaluate conviction, but manage risk through price structure. - Confirm With a Secondary Indicator
Never act on CMF alone. Require at least one confirming signal from RSI, MACD, or a moving average crossover before entering a trade.
Double confirmation reduces false signal entries significantly, which is critical in crypto markets where volatility can produce short-lived noise moves.
These indicators differ significantly from one another and complement each other very well.
Read Also: How Chaikin Money Flow (CMF) Can Help You Win in Crypto
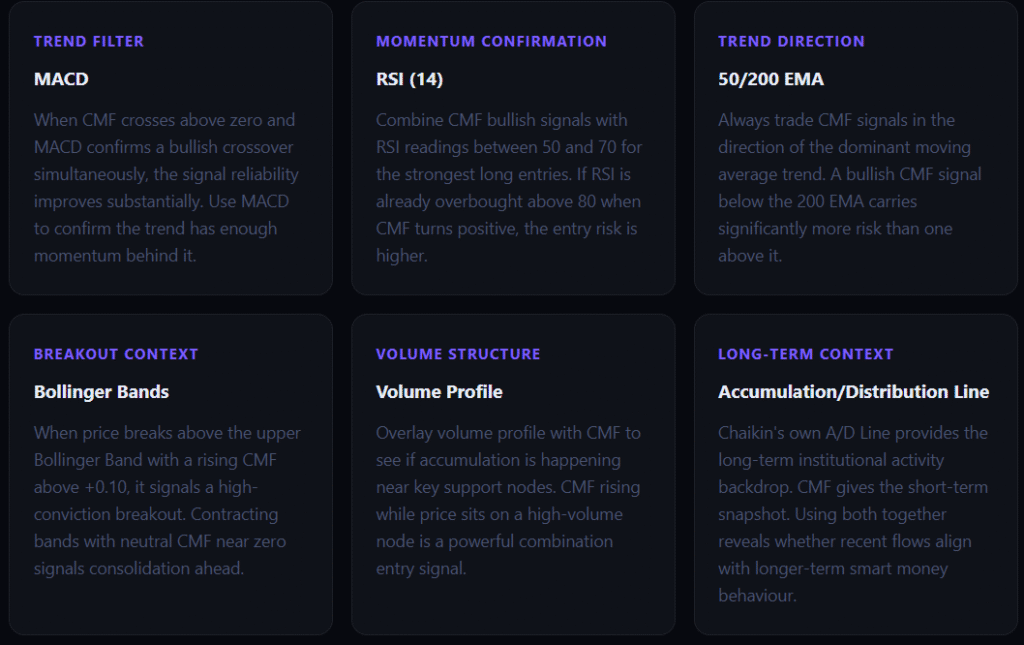
What Are the Best Indicator Combinations to Use With Chaikin Money Flow?
CMF is most powerful when used as a confirmation tool within a broader technical framework rather than as a standalone signal generator.
Conclusion
Forget everything you’ve learned about following the herd. If you want to keep trading based on surface-level price action and hopes and dreams, then by all means, keep ignoring the Chaikin Money Flow.
 Can Help You Win in Crypto")


")


