
Blockchain data tells a story, but only if you know how to read it. Every transaction, wallet movement, and smart-contract interaction leaves a public footprint that reveals how users, investors, and protocols behave in real time.
This is where on-chain analysis comes in. Unlike traditional markets where data is hidden or delayed, blockchains allow anyone to observe its activity.
Through on-chain analysis, analysts can spot early warning signs of distribution before a market top, identify healthy DeFi protocols before they trend, and detect unusual wallet behavior that signals risk or opportunity.
For example, a surge in exchange inflows may hint at incoming sell pressure, while rising long-term holder balances can signal growing confidence. In NFTs, a rising floor price paired with shrinking unique holders may expose fragile demand beneath the surface.
Key Takeaway
- On-chain Analysis uses public blockchain data to show what users and investors are actually doing.
- It helps detect early signs of accumulation, distribution, risk, and growth.
- On-chain data works best when combined with technical and fundamental analysis.
- Clean data, clear methods, and multiple signals improve accuracy.
- Ethical use and respect for privacy are important in on-chain analysis.
“On-chain analysis reveals real market behavior by tracking what happens on the blockchain, not just price movements.”
What is On-chain Analysis?
On-chain analysis is the process of studying data that is recorded directly on a blockchain to understand how a crypto network is being used and how participants behave. Because blockchains are public ledgers, anyone can view transactions, wallet balances, smart contract interactions, and network activity in real time. on-chain analysis answers questions like:
- Are users actively using this blockchain or token?
- Are large holders accumulating or selling?
- Are funds moving into exchanges (possible selling) or out of exchanges (possible holding)?
- Is a protocol growing, slowing down, or being abandoned?
The scope of on-chain analysis includes:
- Transaction data: transfers between wallets, transaction sizes, fees paid
- Wallet and address activity: number of active users, new addresses, long-term holders vs short-term holders
- Token flows: movement of tokens between wallets, exchanges, and smart contracts
- Supply and ownership metrics: circulating supply, tokens held by whales, supply on exchanges
- Protocol usage: DeFi deposits, withdrawals, liquidations, and smart contract interactions
How it differs from technical analysis and fundamental analysis
On-chain analysis is often compared with two other popular methods: technical analysis and fundamental analysis. Each looks at the market from a different angle.
| Analysis Type | What It Focuses On | Data Used | Main Purpose |
| Technical Analysis (TA) | Price charts and indicators such as moving averages, RSI, and support/resistance levels | Historical price and volume data | To study price behavior and identify trading entry and exit points |
| Fundamental Analysis (FA) | Project fundamentals like the team, whitepaper, roadmap, token utility, partnerships, and macroeconomic factors | Project information, market conditions, and economic data | To evaluate the long-term value and strength of a crypto project |
| On-chain Analysis | Actual blockchain activity and network behavior | On-chain data such as transactions, wallet activity, and token flows | To understand what users and investors are doing in real time |
“Blockchain transparency allows anyone to verify activity, making on-chain analysis a powerful source of insight.”
Core data types & sources in on-chain Analysis
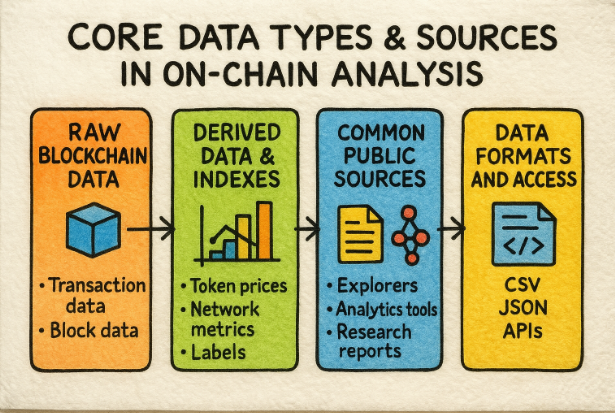
This explains where blockchain data comes from and how it is collected. Understanding these data sources helps you turn raw blockchain activity into clear, useful insights.
Raw blockchain data
Raw blockchain data is the original information written directly to the blockchain. This data is public, permanent, and forms the foundation of all on-chain analysis. It includes blocks, transactions, logs, and receipts.
Raw data is very detailed and technical, but it shows exactly what happened on the network without interpretation. Two important pieces of information on it may include:
Transaction fields (from, to, value, gas, input). These fields help analysts track money flow, user behavior, and contract usage. Each transaction contains key fields, such as:
- From: The sender’s wallet address
- To: The receiver’s wallet or smart contract address
- Value: Amount of tokens sent
- Gas / fees: Cost paid to process the transaction
- Input data: Instructions sent to a smart contract
Event logs and indexed topics (ERC-20 transfers, approvals). Event logs are widely used because they are structured, searchable, and efficient for analysis. When smart contracts run, they generate event logs. These logs make it easier to track specific actions, such as:
- ERC-20 token transfers
- Token approvals
- DeFi actions like deposits, withdrawals, or swaps
Derived data & indexes
Derived data is created by processing and organizing raw blockchain data to make it easier to understand. Most analysts rely on derived data because it turns raw blockchain records into meaningful indicators. Examples include:
- UTXO aggregates (mainly for Bitcoin): grouping unspent outputs to analyze holder behavior
- Token balances: tracking how many tokens each address holds
- Price-normalized metrics: adjusting on-chain values using market prices (e.g., realized cap, MVRV)
Common public sources
On-chain data can be accessed from several public sources, depending on the depth and convenience needed. Examples include Full nodes and RPC providers, Block explorers (Etherscan, Blockchair) and On-chain analytics providers.
Data formats and access (APIs, CSV, SQL exports, Parquet)
On-chain data is available in different formats, depending on the platform and use case. The choice of format depends on whether the user wants quick insights, custom research, or large-scale analysis.
- APIs: For real-time data and automation
- CSV files: Easy to download and analyze in spreadsheets
- SQL exports: Used for custom queries and dashboards
- Parquet files: Efficient format for large-scale data analysis
“Exchange flows, wallet behavior, and network usage often signal market shifts before prices react.”
Tools, platforms & query environments for On-chain data analysis
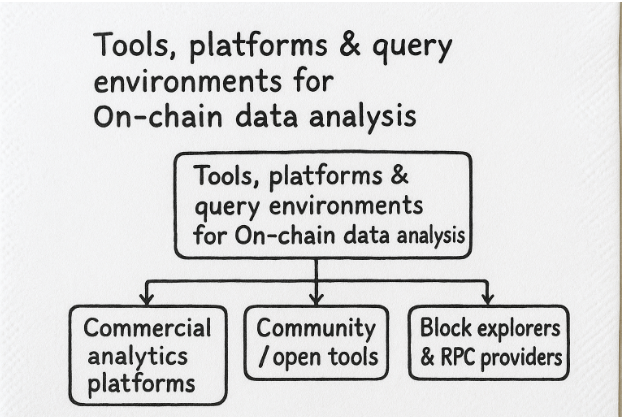
On-chain analysis depends heavily on the tools used to collect, process, and interpret blockchain data. These tools range from professional analytics platforms to open community dashboards and low-level data access services.
Each category serves different users and objectives, from active traders to researchers and compliance teams.
Commercial analytics platforms
Best for: Users who want reliable insights without building custom data pipelines.
Commercial analytics platforms focus on ready-made insights and professional-grade metrics. They aggregate large amounts of raw blockchain data, clean it, label wallets, and transform it into indicators that are easy to understand. They include:
- Glassnode: is widely known for its deep on-chain metrics such as supply in profit or loss, MVRV, SOPR, and long-term holder behavior. It is commonly used for macro analysis and market cycle research.
- Nansen: specializes in wallet labeling and fund flow tracking, making it popular for identifying whale activity, smart money movements, and DeFi interactions.
- IntoTheBlock: emphasizes statistical models, on-chain signals, and risk indicators that appeal to traders and analysts.
- Messari: combines on-chain data with fundamental research, offering structured metrics, dashboards, and written reports that are useful for investors and institutions.
Community / open tools
Best for: Analysts who want transparency and control over how metrics are built and interpreted.
Community and open tools prioritize transparency, flexibility, and customization. They allow users to explore blockchain data directly and create their own dashboards or queries.
- Dune: enables users to write SQL queries on blockchain data and visualize the results in public dashboards. It is widely used for DeFi, NFT, and DAO analysis.
- The Graph: provides indexed blockchain data through subgraphs, making it easier for developers and analysts to query specific smart contract data efficiently.
- DeFiLlama: focuses on DeFi metrics such as TVL, protocol revenue, and chain-level comparisons, offering a simple and widely trusted overview of the DeFi ecosystem.
- Flipside Crypto: provides structured blockchain datasets and rewards users for creating insightful analyses and dashboards.
Block explorers & RPC providers
Best for: Analysts who often source base layer tools for more advanced analysis.
These tools are closest to the raw blockchain. Block explorers and RPC providers offer direct access to blockchain data without heavy interpretation.
- Etherscan: Etherscan and similar explorers allow users to inspect transactions, wallet balances, token transfers, and smart contract interactions in a human-readable format. They are commonly used for verification, troubleshooting, and quick investigations.
- RPC: RPC providers such as Infura and Alchemy allow applications and analysts to query blockchain data programmatically. They are essential for developers, automated systems, and advanced on-chain research.
Also Read: Crypto Trading Bots Explained: Strategies, Tips, and Tools to Trade Smarter
Choosing tools by use case (trading signals vs protocol research vs on-chain forensics)
The best on-chain tool depends on the specific goal. Traders often prefer commercial platforms that provide clear signals, alerts, and market-ready indicators.
Protocol teams and researchers usually rely on community tools and SQL-based environments to track usage, user behavior, and smart contract performance.
For on-chain forensics, compliance, or investigations, analysts often combine block explorers, RPC access, and labeled wallet databases to trace fund movements accurately.
In practice, most professionals use a combination of tools. Commercial platforms provide speed and convenience, while open tools and raw data access offer flexibility and deeper insight.
Methodologies: How to run on-chain analysis
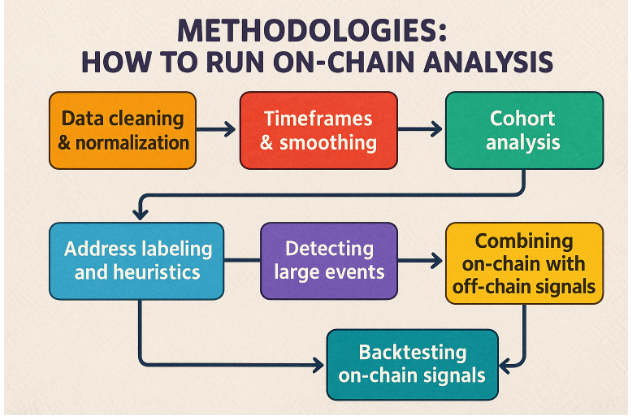
On-chain analysis is not just about looking at charts or metrics. It follows a clear process that turns raw blockchain data into meaningful insight. Good methodology helps you reduce noise, avoid false conclusions, and improve your decision-making. Here are seven methodologies that you should apply.
Data cleaning & normalization
Raw blockchain data is often messy and inconsistent. Tokens may use different decimal places, values may be recorded in base units, and the same user may control multiple addresses.
Data cleaning starts by normalizing units so values are comparable, such as converting raw token amounts into standard token units or adjusting values to USD terms. Analysts also need to account for wrapped tokens, bridged assets, and chain-specific standards.
Address re-use and wallet clustering are handled carefully, since one entity may operate many addresses. Without proper cleaning and normalization, on-chain metrics can be misleading.
Timeframes & smoothing
Blockchain activity is highly volatile, especially on shorter timeframes. Choosing the right timeframe is critical. Daily data is useful for short-term signals but can be noisy.
Weekly or monthly views help reveal broader trends. Smoothing techniques, such as rolling averages, are commonly applied to reduce random spikes and highlight underlying patterns. The key is matching the timeframe to the analysis goal, whether short-term trading or long-term network evaluation.
Cohort analysis
Cohort analysis groups addresses or tokens based on shared characteristics. Age cohorts classify coins or holders by how long assets have been held, helping analysts distinguish between short-term traders and long-term holders.
Holder cohorts can also be grouped by wallet size, activity level, or behavior. This method reveals how different groups react to market conditions, such as whether long-term holders are accumulating while short-term holders are selling.
Address labeling and heuristics
Because blockchain addresses are anonymous by default, labeling is essential for interpretation. Address labeling uses known tags and behavioral patterns to identify exchanges, smart contracts, funds, or protocol wallets.
Heuristics such as transaction frequency, interaction patterns, and counterparties help classify unknown addresses. While labeling improves insight, it is never perfect and should be treated as probabilistic rather than absolute.
Detecting large events
Major on-chain events often have market impact. Token unlocks can increase supply, whale transfers may signal accumulation or distribution, and contract upgrades can affect protocol behavior.
Detecting these events requires monitoring unusual changes in balances, flows, or contract activity. Context is important, since not all large transfers or unlocks lead to price movement, but they often increase risk or volatility.
Combining on-chain with off-chain signals
On-chain data becomes more powerful when combined with off-chain information. Orderbook data shows immediate market liquidity and pressure, while derivatives metrics reveal leverage and risk positioning.
Social sentiment can help explain sudden activity spikes or narrative-driven moves. Using on-chain data alone may miss these factors, but combining signals provides a more complete market view.
Backtesting on-chain signals
Backtesting involves testing on-chain indicators against historical data to evaluate how they would have performed in the past. A typical approach defines a signal, applies it across historical periods, and compares outcomes with price or risk metrics.
Common pitfalls include overfitting, ignoring changing market conditions, and assuming past behavior will repeat exactly. Good backtesting focuses on robustness, simplicity, and realistic assumptions rather than perfect historical performance.
Case studies (short, actionable examples) on on-Chain analysis
Case studies help turn on-chain theory into a practical understanding. The examples below show how common on-chain metrics are applied in real situations to support clearer decision-making.
Example 1: using exchange flows + SOPR to detect distribution
In this scenario, an analyst monitors exchange inflows alongside SOPR (Spent Output Profit Ratio). A sustained rise in tokens moving into exchanges suggests that holders may be preparing to sell. At the same time, SOPR staying above 1 indicates that coins are being spent at a profit.
When both signals appear together, it often points to distribution, where investors are locking in gains rather than accumulating. Traders may interpret this combination as a warning sign of increased selling pressure or a potential market top.
Example 2: protocol health dashboard for a DeFi lending market
A protocol team builds a simple on-chain dashboard to monitor platform health. Key metrics include total value locked, number of active borrowers and lenders, utilization rate, liquidation volume, and protocol revenue.
If TVL remains stable while active users decline and liquidations rise, it may signal stress or reduced user confidence. By tracking these indicators over time, teams and investors can quickly assess whether a lending protocol is growing sustainably or facing hidden risks.
Read also: How to read stock market charts
Best practices & ethics for On-chain Analysis
Effective and responsible on-chain analysis requires more than just technical skills. Analysts must follow best practices to ensure that insights are reliable, reproducible, and ethically used. This protects both the integrity of the analysis and the privacy of network participants.
Reproducibility & documenting queries
Reproducibility is a cornerstone of trustworthy analysis. Every query, metric calculation, and data transformation should be documented clearly so that others or even your future self can replicate the results.
This includes specifying the data sources, timeframes, filtering methods, and normalization steps. By documenting queries and methods, analysts make their work verifiable.
Combining multiple independent signals
Relying on a single metric or indicator can be misleading due to noise, anomalies, or outliers in blockchain data.
Best practice is to combine multiple independent signals to strengthen conclusions. For example, an increase in exchange inflows might be analyzed alongside SOPR, active addresses, or cohort retention metrics.
Transparency about assumptions and thresholds
Every on-chain analysis involves assumptions—about wallet clustering, token classification, smoothing methods, or thresholds for defining “large transfers.”
Analysts should clearly disclose these assumptions and the rationale behind any thresholds used. Transparency ensures that readers understand the limits and potential biases of the analysis..
Privacy concerns and responsible disclosure
Even though blockchain data is public, ethical considerations remain crucial. Analysts should avoid exposing personally identifiable information or publishing queries that could deanonymize individual users unnecessarily.
When discovering exploits, vulnerabilities, or suspicious activity, responsible disclosure practices should be followed—alerting relevant projects or authorities rather than publicly shaming or targeting individuals.
Conclusion
On-chain analysis turns blockchain transparency into practical insight. By studying real activity on the blockchain, such as transactions, wallet behavior, token flows, and protocol usage, it helps explain what users and investors are actually doing, not just what prices suggest. This makes on-chain analysis a powerful complement to technical and fundamental analysis.
However, on-chain analysis works best when applied thoughtfully. Clean data, proper timeframes, multiple confirming signals, and clear assumptions are essential. Ethical considerations such as privacy, transparency, and responsible disclosure are just as important as technical accuracy.
For beginners, the key takeaway is simple: start small. Learn a few core metrics, understand what they measure, and observe how they behave across different market conditions.
FAQs
What is on-chain analysis in simple terms?
On-chain analysis is the study of blockchain data to understand how users, investors, and protocols behave by tracking transactions, wallets, and token movements.
Who uses on-chain analysis?
Traders, long-term investors, DeFi builders, researchers, and compliance teams use on-chain analysis to make data-driven decisions.
Is on-chain analysis better than technical analysis?
It is not better, but different. On-chain analysis shows real blockchain activity, while technical analysis focuses on price charts. Many users combine both.
What are the most important on-chain metrics for beginners?
Common beginner metrics include active addresses, exchange inflows and outflows, SOPR, MVRV, and total value locked (TVL).
Do I need advanced technical skills to use on-chain analysis?
No. Many platforms provide ready-made dashboards and metrics, making it accessible even for beginners.

")


