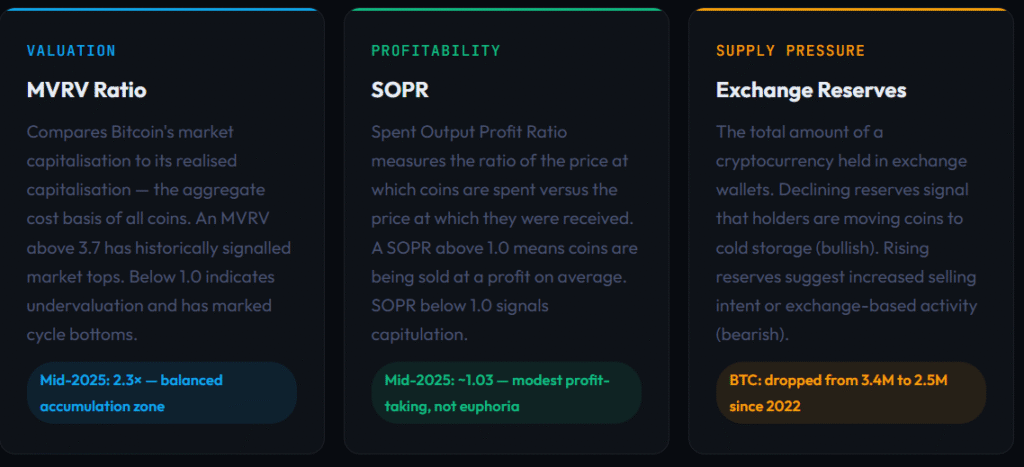
On-chain analysis tells you why. When Bitcoin broke above $100,000 in May 2025 and exchange reserves simultaneously hit a two-year low below 2.5 million BTC down from 3.4 million in 2022, that was not a coincidence you could read in a candlestick.
It was a supply squeeze written directly onto the blockchain, visible to anyone who knew where to look.
Our well researched guide covers the fundamentals, the metrics that matter most, how to build a practical workflow, and which tools deliver the sharpest signals for Bitcoin, Ethereum, and beyond.
This article will explore the fundamentals of on-chain analysis, its importance, and how it can be used to predict market movements.
What Is On-Chain Analysis and How Does It Differ From Technical Analysis?
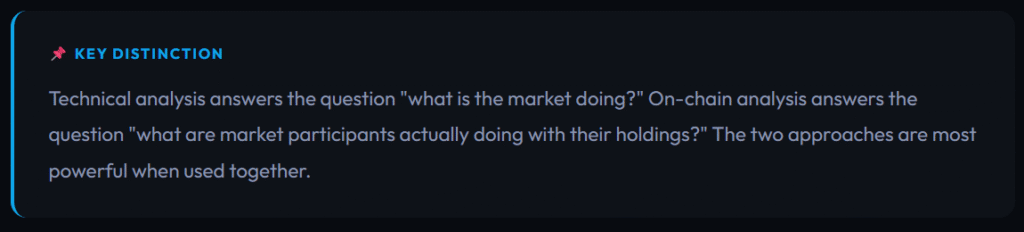
Traditional technical analysis uses price, volume, and derived indicators, all of which are outputs of trading activity on exchanges.
On-chain analysis goes one level deeper, reading the raw data that the blockchain itself records.
According to Grand View Research, by 2030, the global market is projected to experience a compound annual growth rate (CAGR) of 12.5%.
Every confirmed transaction, every wallet address that sends or receives funds, every coin that moves from cold storage to an exchange, all of it is permanently and publicly inscribed on the ledger.
This distinction matters. A price chart can be manipulated through wash trading or coordinated buy pressure. The underlying blockchain cannot.
When a long-dormant wallet moves 10,000 Bitcoin to an exchange address, that fact is visible to every on-chain analyst simultaneously and carries information that no chart indicator can replicate specifically, that a significant holder may be preparing to sell.
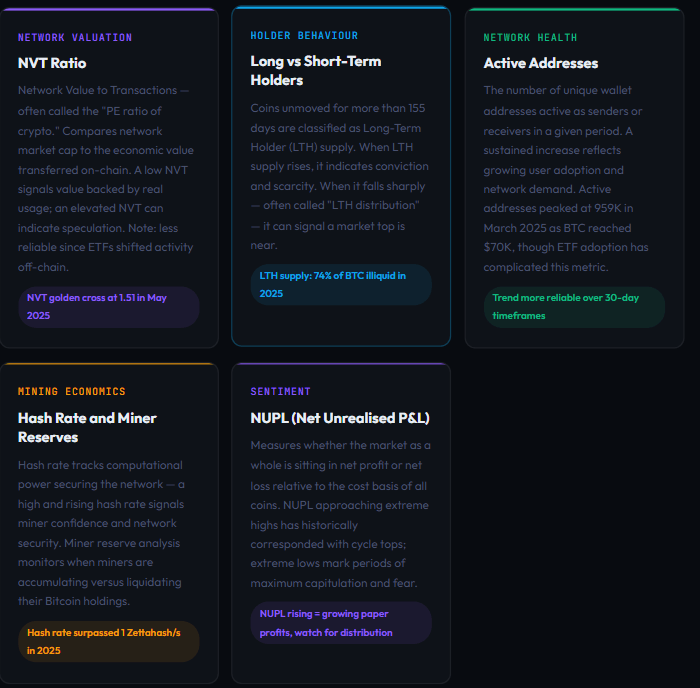
What Are the Most Important On-Chain Metrics to Understand
There are hundreds of on-chain metrics available across modern analytics platforms.
The following are the ones that have demonstrated the strongest predictive value and are most widely used by institutional analysts and serious traders.
Join UEEx
Experience the World’s Leading Digital Wealth Management Platform
This is one of the most important nuances for 2025 and 2026: traditional on-chain metrics are less reliable in isolation than they were before the launch of Bitcoin spot ETFs.
When investors buy IBIT through a brokerage account, no on-chain transaction occurs, the ETF custodian holds Bitcoin, but secondary-market ETF trades leave no blockchain footprint.
This means that daily transaction counts have fallen from nearly 500,000 in December 2023 to around 250,000 in 2025, even as Bitcoin reached new all-time highs.
The NVT ratio has become less reliable for the same reason. Analysts now combine on-chain metrics with ETF flow data, open interest in futures markets, and macro liquidity indicators to build a complete picture.
A 2025 study in Engineering Applications of Artificial Intelligence found that combining on-chain metrics with technical indicators using CNN-LSTM machine learning models achieved 82.44% directional accuracy, significantly above the 50% baseline of discretionary retail trading.
How Do You Actually Do On-Chain Analysis? A Step-by-Step Workflow
The following workflow is how professional analysts approach a market read using blockchain data, adapted for traders at any experience level.
1. Establish the Macro Regime Using MVRV and NUPL
Your first job is to determine where you are in the market cycle. Open Glassnode or Bitcoin Magazine Pro and check the MVRV Z-Score and NUPL readings.
An MVRV below 1.0 with NUPL in negative territory is the classic accumulation signal. An MVRV above 3.0 with NUPL approaching “euphoria” is a distribution warning.
Join UEEx
Experience the World’s Leading Digital Wealth Management Platform
This one step alone determines your directional bias, long, cautiously long, or risk-off.
2. Check Exchange Reserve Trends for Supply Signals
Navigate to CryptoQuant’s exchange reserve chart for Bitcoin. If reserves have been declining over weeks and months, supply available for sale is shrinking.
In combination with rising demand from ETF inflows, this creates the conditions for a supply squeeze.
If reserves are rising sharply, investigate which exchanges are receiving the inflows and whether it correlates with institutional repositioning or retail selling pressure.
3. Read SOPR for Short-Term Holder Behaviour
SOPR tells you the temperature of the market right now. When SOPR dips below 1.0 in a bull market and then recovers above it, that is a classic capitulation-and-recovery pattern often a short-term buying opportunity.
When SOPR sustains elevated readings above 1.05 for weeks, it signals widespread profit-taking, which can precede local tops.
Watch the Short-Term Holder SOPR specifically, as it filters out long-dormant coins.
4. Track Whale and Large Wallet Movements
Use Nansen or Arkham Intelligence to monitor large wallet addresses. When a wallet that has not moved in several years suddenly transfers funds to an exchange address, that is a distribution signal worth taking seriously.
Conversely, when known institutional accumulation addresses receive significant inflows, that is a demand signal.
Tracking the Ethereum Foundation’s wallet, for example, has historically given traders advance warning of local price tops on ETH.
5. Layer In ETF Flow and Derivatives Data
Since 2024, on-chain analysis without ETF context is incomplete. Check Bitcoin and Ethereum ETF net flow data daily platforms like The Block and BitMEX Research publish this.
Rising open interest in futures markets combined with bullish on-chain signals is a high-confidence confluence setup.
Open interest growth of 50 to 90% has historically preceded major volatility spikes, including the October 2024 and April 2025 moves.
6. Set Alerts and Build a Dashboard
One-off analysis is less valuable than a consistent monitoring system.
Most platforms including Glassnode and CryptoQuant allow custom alerts for when specific metrics cross thresholds for example, when MVRV Z-Score enters the historical caution zone above 6.0.
Building a personal dashboard with your five to eight most important metrics and checking it on a weekly cadence is how serious analysts stay ahead of market moves.
Join UEEx
Experience the World’s Leading Digital Wealth Management Platform
On-chain analysis offers several advantages over traditional methods of market analysis, particularly when it comes to cryptocurrencies. This includes:
Transparency and Accessibility
The public nature of blockchain data ensures that anyone can access and analyze the information.
This transparency reduces the likelihood of market manipulation, as any large movements or unusual activities can be quickly identified and monitored by the community.
Market Sentiment
Analysts can estimate the sentiment of market participants by examining the behavior of wallets and the movement of coins.
For example, a significant outflow of Bitcoin from exchanges to private wallets may indicate that investors are planning to hold their assets( HODL), which is often seen as a bullish signal.
Identifying Trends and Patterns
On-chain data can reveal long-term trends and patterns that might not be visible through price charts alone.
For instance, the accumulation of coins by long-term holders, also known as whales, can signal confidence in the asset’s future value, potentially leading to price increases.
Confirmation of Fundamentals
If a blockchain-based project claims to have a high level of user activity, but on-chain analysis reveals low transaction volume, this discrepancy can raise questions about the project’s legitimacy.
Technical Analysis Validation
On-chain analysis can complement traditional technical analysis by providing fundamental data to validate technical indicators.
This synergy between technical and on-chain analysis can improve the accuracy of trading decisions.
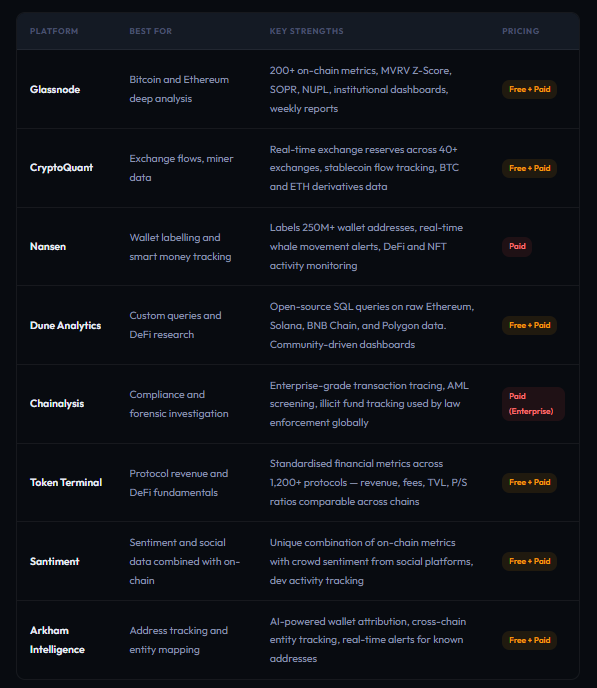
The quality of your on-chain analysis is only as good as the data sources you use. The following platforms represent the industry standard for both retail and institutional analysts.
Join UEEx
Experience the World’s Leading Digital Wealth Management Platform
While on-chain analysis is a powerful tool, it is not without its limitations. Knowing these limitations is important for using the analysis effectively:
1. Lagging Indicators
Some on-chain metrics, like the MVRV ratio or HODL waves, can be lagging indicators, meaning they may only confirm a trend after it has already begun.
This can make it challenging to use them for predicting short-term price movements.
2. Complexity and Interpretation
On-chain data can be complex and difficult to interpret, especially for new investors or traders.
Furthermore, accurate analysis depends on the platform’s ability to correctly interpret raw blockchain data.
As the range of on-chain activities grows, the complexity of accurately decoding this data also rises. If the analysis is based on poor-quality data, it can result in incorrect conclusions and wrong decisions.
3. Reliance on Historical Data
On-chain analysis often relies on historical data to predict future trends. However, past performance is not always indicative of future results, particularly in the volatile and rapidly evolving cryptocurrency markets.
3. Market Manipulation
While blockchain transparency reduces the likelihood of market manipulation, it is still possible for large players (whales) to manipulate on-chain metrics to influence market sentiment.
4. Off-Chain Activity
Not every action in the crypto space takes place on-chain. Activities within centralized entities, like trading on Centralized Exchanges (CEXs), occur off-chain.
While you can track token movements between CEX wallets and transfers to and from these wallets, much of what happens within the exchange remains hidden.
Although blockchains are transparent, they provide varying levels of anonymity.
Identifying the actual identities behind wallet addresses is difficult, making it challenging to fully understand the context of transactions.
Assigning wallet addresses to specific entities or individuals carries a margin of error.
Unless these addresses are publicly disclosed, accurately labeling them depends on the ability to detect patterns and analyze wallet activities effectively.
By staying informed and leveraging the power of on-chain data, crypto investors can make more informed decisions and navigate the market with greater confidence.
Other Types of Analysis to Consider
Fundamental Analysis: Fundamental analysis which combines a bit of financial metrics and qualitative measures is used to evaluate an asset’s inherent value.
As we wrap up, If you’re content with just watching price candles flicker and hoping for the best, then you probably don’t need on-chain analysis.
But in a market where the smart money operates in plain sight, ignoring the data is just leaving your success up to chance.
While retail traders obsess over what the price is doing, serious investors are using tools like Glassnode and Dune Analytics to see exactly what whales and institutions are doing with their capital in real time.
Abeeb is a goal-oriented content writer with over 4 years of experience in crafting compelling and insightful content across various genres, including tech, news, entertainment, and blockchain. Known for building strong connections with clients and stakeholders, Abeeb is dedicated to delivering clear, concise, and impactful writing that captivates audiences.
Disclaimer: This article is intended solely for informational purposes and should not be considered trading or investment advice. Nothing herein should be construed as financial, legal, or tax advice. Trading or investing in cryptocurrencies carries a considerable risk of financial loss. Always conduct due diligence before making any trading or investment decisions.


")


