

Quantitative analysis in cryptocurrency trading is the application of mathematical models, statistical methods, and algorithmic systems to evaluate market data and generate systematic trading decisions. Rather than relying on intuition or manual chart reading, quant traders process large volumes of price history, volume data, on-chain blockchain metrics, derivatives positioning, and sentiment signals to identify statistically repeatable edges. In a market where total daily spot volume across all centralized exchanges averaged approximately $146 billion in 2025, the ability to process data faster and more consistently than human judgment is a meaningful competitive advantage.
Key Takeaways (2025/2026)
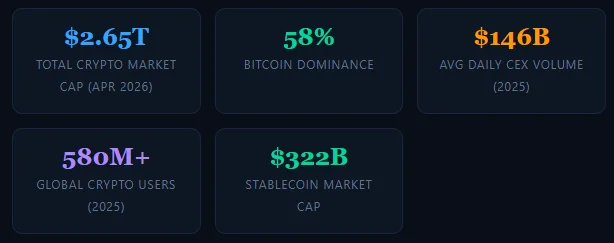
- Total crypto market capitalization sits at approximately $2.6 to $2.7 trillion as of April 2026, down from a $4 trillion peak in mid-2025.
- Bitcoin dominance is approximately 58% in April 2026, indicating a Bitcoin-led market cycle with limited broad altcoin strength.
- Global crypto users surpassed 580 million in 2025, up 34% year-over-year, with Asia representing roughly 43% of the user base.
- Combined centralized spot plus derivatives volume exceeded $79 trillion in 2025; perpetual futures alone reached approximately $862 trillion in notional volume.
- Decentralized perpetual DEX trading grew 346% in 2025 to approximately $6.7 trillion, signaling rapid DeFi maturation.
- Machine learning and AI-driven strategies now account for an estimated majority of high-frequency crypto trading volume on top-tier exchanges.
- Stablecoin market cap reached an all-time high of approximately $322 billion in April 2026, representing about 12% of total market cap and serving as a key liquidity indicator.
Cryptocurrency markets are notoriously volatile and driven by factors that span macroeconomics, blockchain fundamentals, regulatory sentiment, and retail psychology simultaneously. Relying on instinct or simple chart patterns in this environment has produced documented losses for underprepared traders. Quantitative analysis offers a structured alternative: systematic, data-driven decision making that removes emotional bias and scales with available computational resources.
This guide covers the full spectrum of quant methods applicable to crypto, from basic statistical tools to machine learning pipelines, on-chain analytics, and responsible risk management frameworks.
Related reading: Top Cryptocurrency Technical Analysis Platforms
Why Is Quantitative Analysis Important in Cryptocurrency Markets?
Source: Pinterest
Data-Driven Decisions: Decisions grounded in historical data and statistical significance reduce reliance on narrative-driven speculation, which has been particularly costly in crypto bull markets followed by sharp corrections.
Systematic Risk Management: VaR models, maximum drawdown limits, and correlation analysis provide structured frameworks for sizing positions and limiting loss exposure in a market where 20%+ daily moves are historically common.
Strategy Backtesting: Testing strategies on historical data before committing capital reveals performance under different market regimes, including bear markets and black swan events like the March 2020 crash and FTX collapse.
Eliminating Emotional Bias: Fear and greed are the dominant forces in retail crypto markets. Rule-based algorithmic execution removes the emotional responses to market movements that drive most retail trading losses.
Execution Speed: Algorithmic trading reacts to market events in milliseconds. In a market that operates 24/7 with no circuit breakers, the gap between a human reaction time and an automated one can represent significant opportunity or loss avoidance.
Multi-Factor Alpha Generation: Combining price, volume, on-chain, sentiment, and macro signals into a unified factor model generates more robust predictions than any single signal source, reducing the risk of strategy decay in changing market conditions.
What Are the Best Data Sources for Cryptocurrency Quantitative Analysis?
Where do quant traders get reliable crypto market data?
| Source | Data Type | Tier | Best For |
|---|---|---|---|
| Binance / UEEx / Coinbase APIs | Real-time & historical OHLCV, order books, trade streams | Free | Strategy development, backtesting |
| CoinGecko / CoinMarketCap | Multi-exchange aggregated prices, market cap, dominance | Free/Paid | Market overview, portfolio tracking |
| Kaiko | Tick-level trade data, order book snapshots, cross-exchange | Paid | Institutional research, market microstructure |
| CryptoCompare | Aggregated OHLCV, social data, on-chain metrics | Free/Paid | Multi-asset analysis, sentiment overlay |
| Glassnode | On-chain metrics: MVRV, exchange flows, HODLer data | Paid | On-chain cycle analysis, long-term signals |
| Nansen | Wallet labeling, smart money flows, DeFi analytics | Paid | Institutional flow detection, DeFi tracking |
| Dune Analytics | Custom on-chain SQL queries, DeFi protocol data | Free | On-chain research, protocol-level analysis |
| Etherscan / Blockchain.com | Transaction history, wallet activity, mempool data | Free | Transaction verification, on-chain research |
How do you handle data quality issues in crypto datasets?
Raw crypto data contains numerous quality problems that, if unaddressed, produce unreliable analytical results. Exchange outages and API rate limiting create gaps in time series that must be handled via interpolation or flagged and removed. Wash trading inflates reported volumes on lower-tier exchanges and requires statistical filtering, often using the Haas/Bitwise methodology of identifying suspicious round-number volume patterns. Outliers from flash crashes or exchange-specific anomalies distort statistical measures; Z-score or IQR-based detection is standard. When aggregating across exchanges, all timestamps must be aligned to UTC and price series normalized to a common base currency.
Wash Trading Warning: Research has consistently shown that a significant proportion of reported volume on smaller exchanges is fabricated. When selecting data sources for backtesting, prioritize exchanges with high trust scores on CoinGecko or those that publish verifiable proof-of-reserves, such as Binance, Kraken, and Coinbase.
What Statistical Methods Apply to Cryptocurrency Market Analysis?
How are descriptive statistics used to understand crypto price behavior?
Descriptive statistics provide the foundation for any quantitative crypto analysis. The mean and median of daily returns reveal the central tendency of a price series, while large divergences between the two indicate skewed distributions common in crypto markets after major rallies or crashes. Standard deviation quantifies realized volatility; in 2025, Bitcoin’s 30-day rolling volatility ranged from roughly 35% to over 80% annualized across different market regimes.
Skewness measures asymmetry in return distributions. Crypto returns consistently exhibit positive skewness during bull markets (large positive moves dominate) and negative skewness during bear markets. Kurtosis, or excess tail weight, is persistently high in crypto compared to traditional assets, meaning extreme return events occur far more frequently than a normal distribution would predict. This has direct implications for risk management: standard VaR models that assume normality systematically underestimate tail risk in crypto.
What is time series analysis and why does it matter for crypto?
Time series analysis treats a sequence of data points indexed by time as a structured statistical object with properties like stationarity, autocorrelation, and seasonality. Before applying most forecasting models, a price series must be tested for stationarity using tools like the Augmented Dickey-Fuller (ADF) test or the KPSS test. Raw crypto prices are almost always non-stationary (the mean and variance change over time), while log returns are typically closer to stationary and suitable for modeling.
Autocorrelation Function (ACF) and Partial Autocorrelation Function (PACF) analysis reveals whether past prices carry predictive information about future prices. Evidence of autocorrelation in short-horizon crypto returns has been documented, particularly around predictable on-chain events like Bitcoin halving cycles and end-of-quarter derivatives expiries. ARIMA and GARCH models capture linear time dependencies and volatility clustering respectively. GARCH models are particularly relevant for crypto because volatility clusters observably: high-volatility days tend to follow other high-volatility days.
2025 Market Data: Bitcoin’s total spot trading volume in 2025 was approximately $7.3 trillion on Binance alone. Combined centralized perpetual futures volume across all tracked exchanges reached approximately $862 trillion, underscoring that derivatives dominate price discovery in modern crypto markets.
How do you measure correlation between cryptocurrencies for portfolio purposes?
Pearson correlation coefficients measure linear co-movement between asset returns, while Spearman rank correlation captures non-linear relationships. During crypto market stress events (exchange collapses, regulatory shocks, macro risk-off), cross-asset correlations in crypto typically spike toward 1.0 as traders sell indiscriminately, a phenomenon known as correlation breakdown. As of April 2026, Bitcoin shows an 84% correlation with the S&P 500 and 87% with gold over the trailing 12 months, demonstrating increased integration with macro asset classes compared to 2021 levels.
Also Read: Top 10 Largest Exchanges
What On-Chain Metrics Provide Unique Analytical Signals?
On-chain analysis is one of the few areas where crypto markets offer analytical tools unavailable in traditional financial markets. Because all blockchain transactions are public, it is possible to measure actual network usage, holder behavior, and capital flows in ways that have no equivalent in equities or forex.
MVRV Ratio: Market Value to Realized Value. Compares current market cap to the average cost basis of all coins. MVRV above 3.5 has historically signaled cyclical tops; below 1.0 has signaled generational bottoms.
Exchange Inflows / Outflows: Large inflows to exchange wallets indicate potential selling pressure (coins being moved to sell). Sustained net outflows signal accumulation and reduced sell-side supply.
Long-Term Holder Supply: The proportion of BTC unmoved for 155+ days. Rising LTH supply during bear markets has historically preceded bull market recoveries. As of April 2026, LTH supply remains elevated relative to cycle norms.
NVT Ratio: Network Value to Transactions. Analogous to a P/E ratio for crypto: divides market cap by daily on-chain transaction volume. Elevated NVT suggests the network is overvalued relative to its actual utility usage.
Stablecoin Supply Ratio: The ratio of Bitcoin market cap to total stablecoin supply. A rising stablecoin supply relative to Bitcoin market cap indicates growing “dry powder” available to rotate into risk assets, historically a bullish signal.
Hash Rate / Miner Flows: Bitcoin’s hash rate reflects miner conviction. Miner wallet outflows to exchanges can signal forced selling due to operating costs. Hash rate reaching all-time highs alongside price consolidation is typically constructive long-term.
Related reading: Using Artificial Intelligence for Crypto Price Prediction
How Do Machine Learning and AI Improve Crypto Trading Strategies?
What machine learning models are most commonly used in crypto quant trading?
Long Short-Term Memory (LSTM) neural networks are widely applied to cryptocurrency time series prediction due to their ability to capture long-range temporal dependencies in sequential data. Transformer models, originally developed for natural language processing, are increasingly adapted for financial time series because their attention mechanisms can identify relevant historical patterns across longer contexts than LSTMs. Gradient boosting models (XGBoost, LightGBM) remain the workhorses of feature-based classification tasks, such as predicting whether the next 4-hour candle will close positive given a feature matrix of technical indicators, on-chain metrics, and sentiment scores.
What is sentiment analysis and how is it used in crypto?
Sentiment analysis quantifies market psychology from unstructured text data. Sources include X (formerly Twitter), Reddit (especially r/Bitcoin and r/CryptoCurrency), Telegram channels, Discord servers, and mainstream news headlines. The Crypto Fear and Greed Index aggregates volatility, momentum, volume, social media sentiment, and Bitcoin dominance into a 0 to 100 composite score; readings below 20 have historically coincided with favorable risk/reward buying opportunities, while readings above 80 have preceded corrections. NLP models trained specifically on crypto-community language and slang significantly outperform general financial sentiment models due to the unique vocabulary and meme culture of crypto markets.
What is the difference between backtesting and forward testing?
Backtesting applies a strategy to historical data to measure hypothetical past performance. Forward testing (also called paper trading or live simulation) applies the strategy to real-time market data without committing capital, providing a true out-of-sample test. Backtesting is necessary but insufficient: common pitfalls include look-ahead bias (accidentally using future information in historical simulations), overfitting (optimizing parameters so precisely to historical data that the strategy fails on new data), and ignoring transaction costs, slippage, and liquidity constraints. Any strategy should demonstrate positive expected value in both backtesting and a meaningful forward-testing period before live deployment.
Overfitting Warning: A strategy that fits historical crypto data perfectly, especially across the 2017 to 2021 bull market, will almost certainly underperform out-of-sample. Use walk-forward optimization, cross-validation across multiple market regimes, and hold out at least 20% of historical data exclusively for final out-of-sample testing.
What Are the Most Common Quantitative Trading Strategies in Crypto?
| Strategy | Core Principle | Typical Timeframe | Key Risk | Common Instruments |
|---|---|---|---|---|
| Mean Reversion | Price reverts to a statistical mean after deviation | Minutes to hours | Regime change (trending market) | Spot pairs, perps |
| Trend Following | Momentum: buy strength, sell weakness | Hours to weeks | Whipsaws in ranging markets | Futures, spot, options |
| Statistical Arbitrage | Exploit pricing divergence between correlated assets | Seconds to minutes | Correlation breakdown | Spot/perp basis, CEX/DEX |
| Market Making | Provide liquidity on both sides of the order book | Milliseconds | Inventory risk, adverse selection | Spot order books |
| On-Chain Signal | Trade on MVRV, exchange flows, miner behavior | Days to weeks | Signal lag, regime change | Spot, long-dated futures |
| Funding Rate Arb | Capture perpetual funding when it diverges from fair value | 8-hour funding periods | Liquidation cascade, correlation | Spot + perpetual pairs |
How Should Quantitative Traders Manage Portfolio Risk in Crypto?
What risk management framework works best for volatile crypto portfolios?
Given crypto’s historically extreme volatility (annualized Bitcoin volatility has ranged from 30% to over 100% at various points since 2020), standard equity risk frameworks require significant adaptation. The following six-layer framework provides a practical starting point.
- Position Sizing: Limit any single position to 1 to 5% of portfolio net asset value depending on the asset’s liquidity and correlation to the broader portfolio. Use the Kelly Criterion or a fractional Kelly approach to size based on expected edge.
- Value-at-Risk (VaR): Use a historical simulation VaR at 95% or 99% confidence intervals rather than parametric VaR, because crypto return distributions have fat tails that violate normality assumptions. Conditional VaR (CVaR/Expected Shortfall) better captures tail risk.
- Stop-Loss Rules: Pre-define exit levels for both individual positions and overall portfolio drawdown. A common institutional threshold suspends new position-taking when portfolio drawdown exceeds 10 to 15% from peak.
- Diversification Across Strategies: Combine uncorrelated alpha sources: a trend-following strategy and a mean-reversion strategy will naturally offset each other during mixed market regimes. Avoid over-concentration in correlated long-Bitcoin exposures.
- Liquidity Management: Maintain a meaningful cash or stablecoin reserve (20 to 40% of portfolio) to absorb drawdowns without forced selling and to capitalize on crash-driven opportunities. As of April 2026, stablecoin market cap is at all-time highs of $322 billion, suggesting significant institutional capital is positioned defensively.
- Stress Testing: Regularly simulate portfolio performance under historical stress scenarios: the COVID crash (March 2020, -50% in days), China mining ban (May 2021, -55% over weeks), FTX collapse (November 2022), and the 2025 market correction from $4 trillion to $2.6 trillion.
Also Read: Encryption Algorithms in Cryptography
What Is the Current Regulatory Environment for Quantitative Crypto Trading in 2026?
The regulatory landscape for crypto trading has evolved substantially since 2022. The EU’s MiCA (Markets in Crypto-Assets) regulation came into full effect in 2024, establishing licensing requirements for crypto asset service providers across all 27 EU member states and creating standardized reporting obligations for algorithmic traders operating at scale. In the United States, the CLARITY Act is under active Senate consideration as of April 2026, which could establish a unified federal framework for digital asset regulation and potentially open spot Ethereum ETFs and crypto-yield products in retirement accounts.
For quantitative traders, the key compliance considerations involve transaction reporting thresholds, wash-sale rule treatment (still unresolved in the U.S. for crypto), know-your-customer requirements when operating market-making strategies that interact with retail users, and AML obligations when flows exceed certain thresholds. Operating on compliant, licensed exchanges like UEEx, Binance, Coinbase, and Kraken minimizes counterparty and regulatory risk compared to using unregulated platforms.
Related reading: Understanding Consensus Algorithms
Frequently Asked Questions About Crypto Quantitative Analysis
What is quantitative analysis in cryptocurrency trading?
Quantitative analysis in cryptocurrency trading is the use of mathematical models, statistical methods, and algorithms to evaluate market data and generate trading decisions. Instead of relying on intuition, quant traders analyze large datasets including price history, volume, on-chain blockchain metrics, and social sentiment to identify statistically significant patterns and build systematic strategies.
What data sources are most reliable for crypto quantitative analysis?
The most reliable sources include exchange APIs from Binance, Coinbase, and UEEx for real-time and historical OHLCV data; aggregators like CoinGecko and CoinMarketCap for cross-exchange price data; and professional providers like Kaiko for tick-level data. On-chain analytics platforms like Glassnode, Nansen, and Dune Analytics provide wallet behavior and DeFi flow data unavailable in traditional financial markets.
How does machine learning improve crypto trading strategies?
Machine learning identifies non-linear patterns in price data that traditional statistical models miss, processes multiple data types simultaneously (price, volume, on-chain metrics, sentiment), adapts to regime changes faster than rule-based systems, and enables predictive models for market direction. LSTM networks are common for time series work, while gradient boosting models excel at feature-based classification tasks like predicting short-term price direction.
What is on-chain analysis and why does it matter for quant traders?
On-chain analysis uses blockchain transaction data to measure actual network activity independent of exchange prices. Key metrics include MVRV ratio for cycle valuation, exchange inflows and outflows as a selling pressure indicator, long-term holder supply for conviction measurement, and stablecoin flows as a dry-powder proxy. These metrics are unique to crypto and provide predictive signals unavailable in traditional financial markets.
What is backtesting and why is it important before live trading?
Backtesting applies a trading strategy to historical data to simulate how it would have performed in the past. It validates strategy logic, identifies parameter sensitivity, measures risk-adjusted returns, and detects overfitting before risking real capital. Key risks include look-ahead bias, survivorship bias, and the inability to accurately model slippage and liquidity constraints at scale.
How do you manage risk in a quantitative crypto portfolio?
Effective risk management combines position sizing limits (1 to 5% of NAV per position), historical simulation VaR with fat-tail adjustments, pre-defined stop-loss rules at position and portfolio level, diversification across uncorrelated strategies, maintaining 20 to 40% stablecoin reserves, and regular stress testing against historical crash scenarios including the 2022 FTX collapse and the 2025 market correction from $4 trillion to $2.6 trillion.
What are the most common quantitative trading strategies in crypto?
The most common strategies include mean reversion (trading toward a statistical average), trend following (momentum-based directional trading), statistical arbitrage (exploiting pricing divergence between correlated assets or exchanges), market making (providing liquidity on both sides of the order book), on-chain signal strategies (trading MVRV, exchange flows, or miner behavior), and funding rate arbitrage (capturing perpetual contract funding when it diverges from fair value).
What role does sentiment analysis play in crypto quant trading?
Sentiment analysis quantifies market psychology from social media (X/Twitter, Reddit, Telegram), news headlines, and the Fear and Greed Index. In crypto, retail sentiment has demonstrated measurable predictive power for short-term price moves in major assets. NLP models trained on crypto-specific language outperform general financial sentiment models because of the unique vocabulary and community culture of crypto markets.


")


