The cryptocurrency market is a beast that can devour even the bravest of traders. Its unpredictable swings can leave you reeling, wondering if you’ll ever be able to tame the chaos. But what if you could turn the tables? What if you could crack the code of the market’s madness and emerge victorious? The truth is that the key to unlocking the crypto market’s secrets lies in the data.
Join UEEx
Experience the World’s Leading Digital Wealth Management Platform
Mastering time series analysis allows you to confidently uncover hidden patterns, anticipate trends, and make trades. In this blog post, we’ll reveal the ultimate game-changer for crypto traders: a step-by-step guide to harnessing the power of time series analysis and taking control of the market’s wild ride.
Time series analysis is a powerful tool for making informed decisions in the crypto market.
Combining multiple models like ARIMA, ES, and Machine Learning can help you unlock trends and patterns.
Continuously monitoring and refining your approach is crucial for staying ahead of the curve.
External factors can impact the market, so it’s essential to consider them in your analysis.
Embracing the ongoing nature of time series analysis is key to mastering the crypto market and achieving success.
What is Time Series Analysis?
Time series analysis is a statistical technique used to analyze and forecast data that varies over time. It involves examining patterns and trends in historical data to identify relationships between variables and predict future values.
Time series analysis is commonly used in finance, economics, and other fields where data is collected over time.
“Time series analysis is not a crystal ball, but it can help you make more informed decisions by identifying patterns and trends in the data. It’s essential to stay up-to-date with the latest developments in the crypto market and adjust your models accordingly”.
Importance of Time Series Analysis in Crypto Markets
Crypto markets are highly volatile, with prices fluctuating rapidly due to various factors, including market sentiment, regulatory changes, and global events. Time series analysis can help investors and traders to:
Identify trends and patterns: Analyzing historical price data, traders can identify trends and patterns that can inform future predictions and investment decisions.
Predict future price movements: Time series analysis can help traders predict future price movements and trends, enabling them to make more informed investment decisions.
Detect anomalies: Time series analysis can help identify unusual patterns or anomalies in the market, allowing traders to detect potential scams, market manipulation, or other irregularities.
Optimize trading strategies: By analyzing historical data, traders can optimize their trading strategies and improve their overall performance.
Plan resources effectively: Time series analysis can help traders and investors plan their resources effectively, such as managing their portfolio, risk management, optimizing trading strategies, or optimizing their resource allocation.
Improve risk management: Time series analysis can help traders and investors identify potential risks and opportunities and make informed decisions to minimize losses and maximize gains.
Enhance portfolio management: Time series analysis can help traders and investors optimize their portfolios by identifying the best assets to hold and when to buy or sell.
Types of Time Series Analysis
There are several types of time series analysis, including:
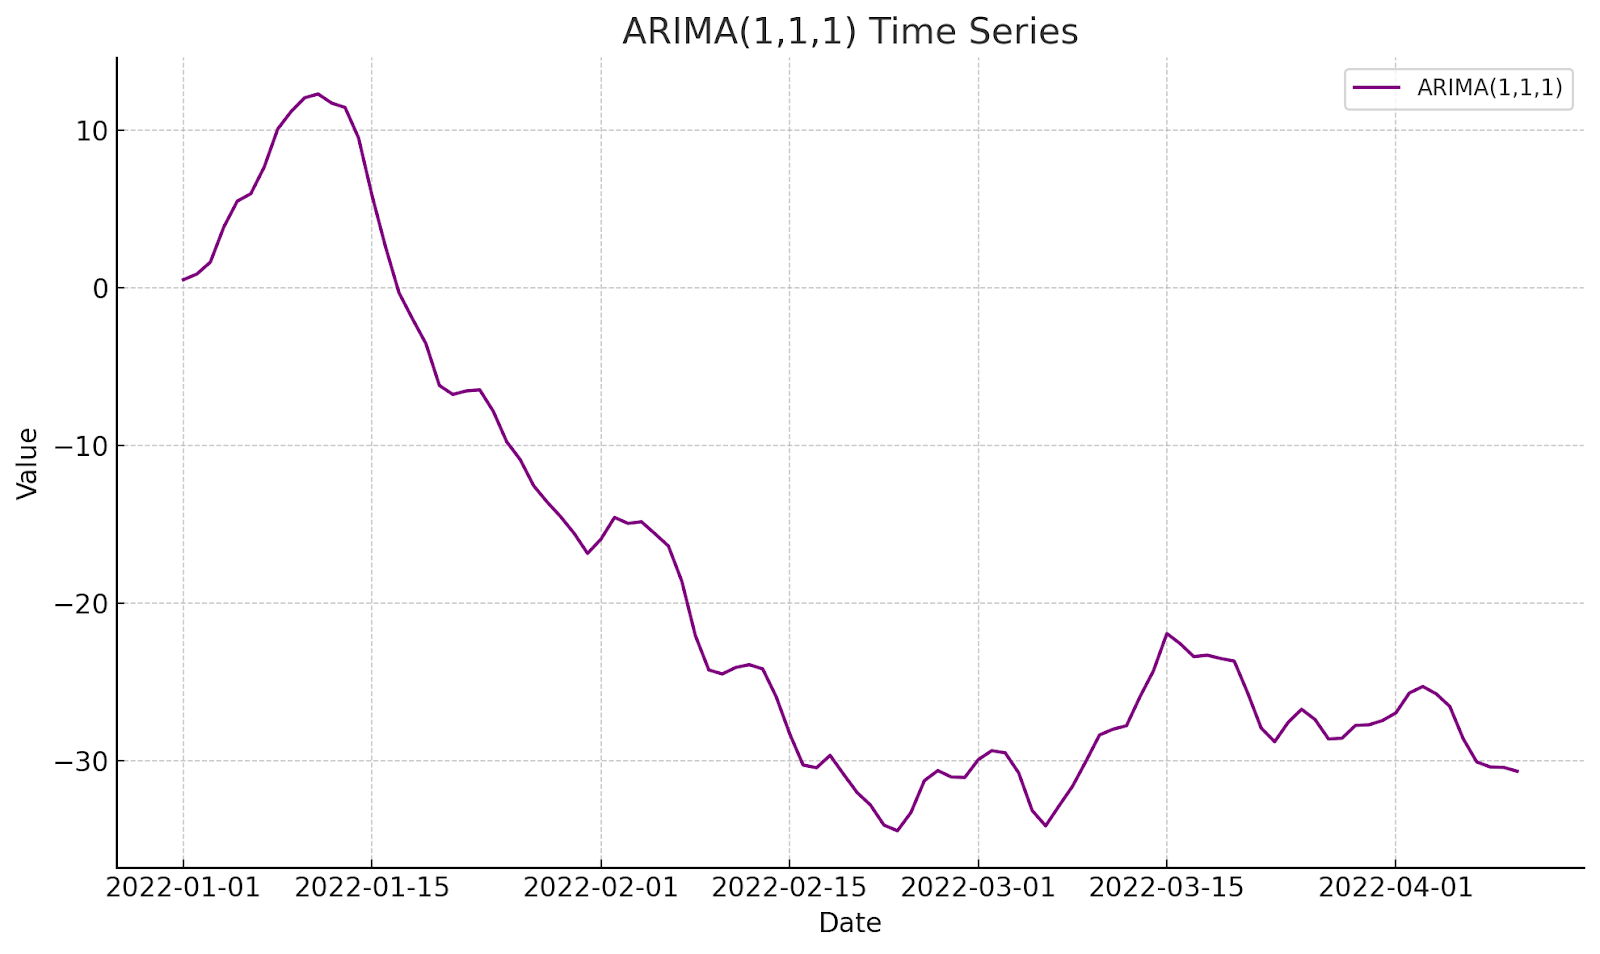
Autoregressive Integrated Moving Average (ARIMA)
This is a popular method for forecasting time series data. It combines autoregressive, moving average, and differencing components to model the data. ARIMA models are useful for modeling time series data that exhibit non-stationarity and can be used to forecast future values.
The ARIMA model is defined by three parameters: p (autoregressive), d (differencing), and q (moving average).
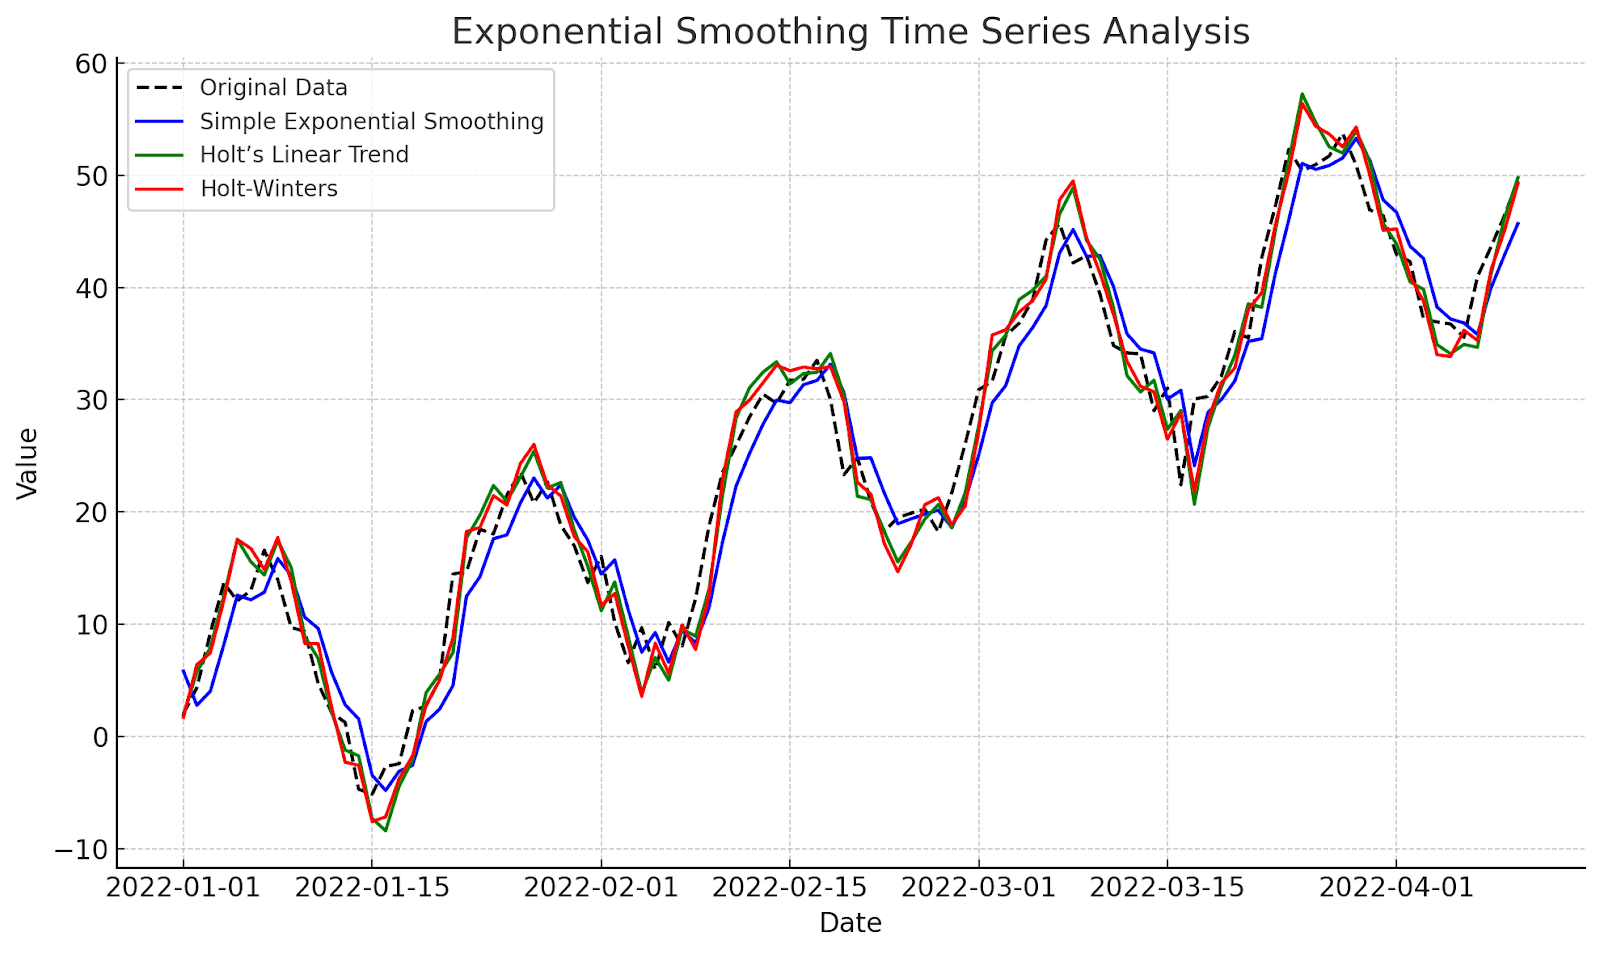
Exponential Smoothing (ES)
This method uses weighted averages of past observations to forecast future values. Exponential smoothing is a simple and effective method for forecasting time series data and is particularly useful for modeling data that exhibits a strong trend or seasonality.
There are three main types of exponential smoothing: simple, Holt’s method, and Holt-Winters method.
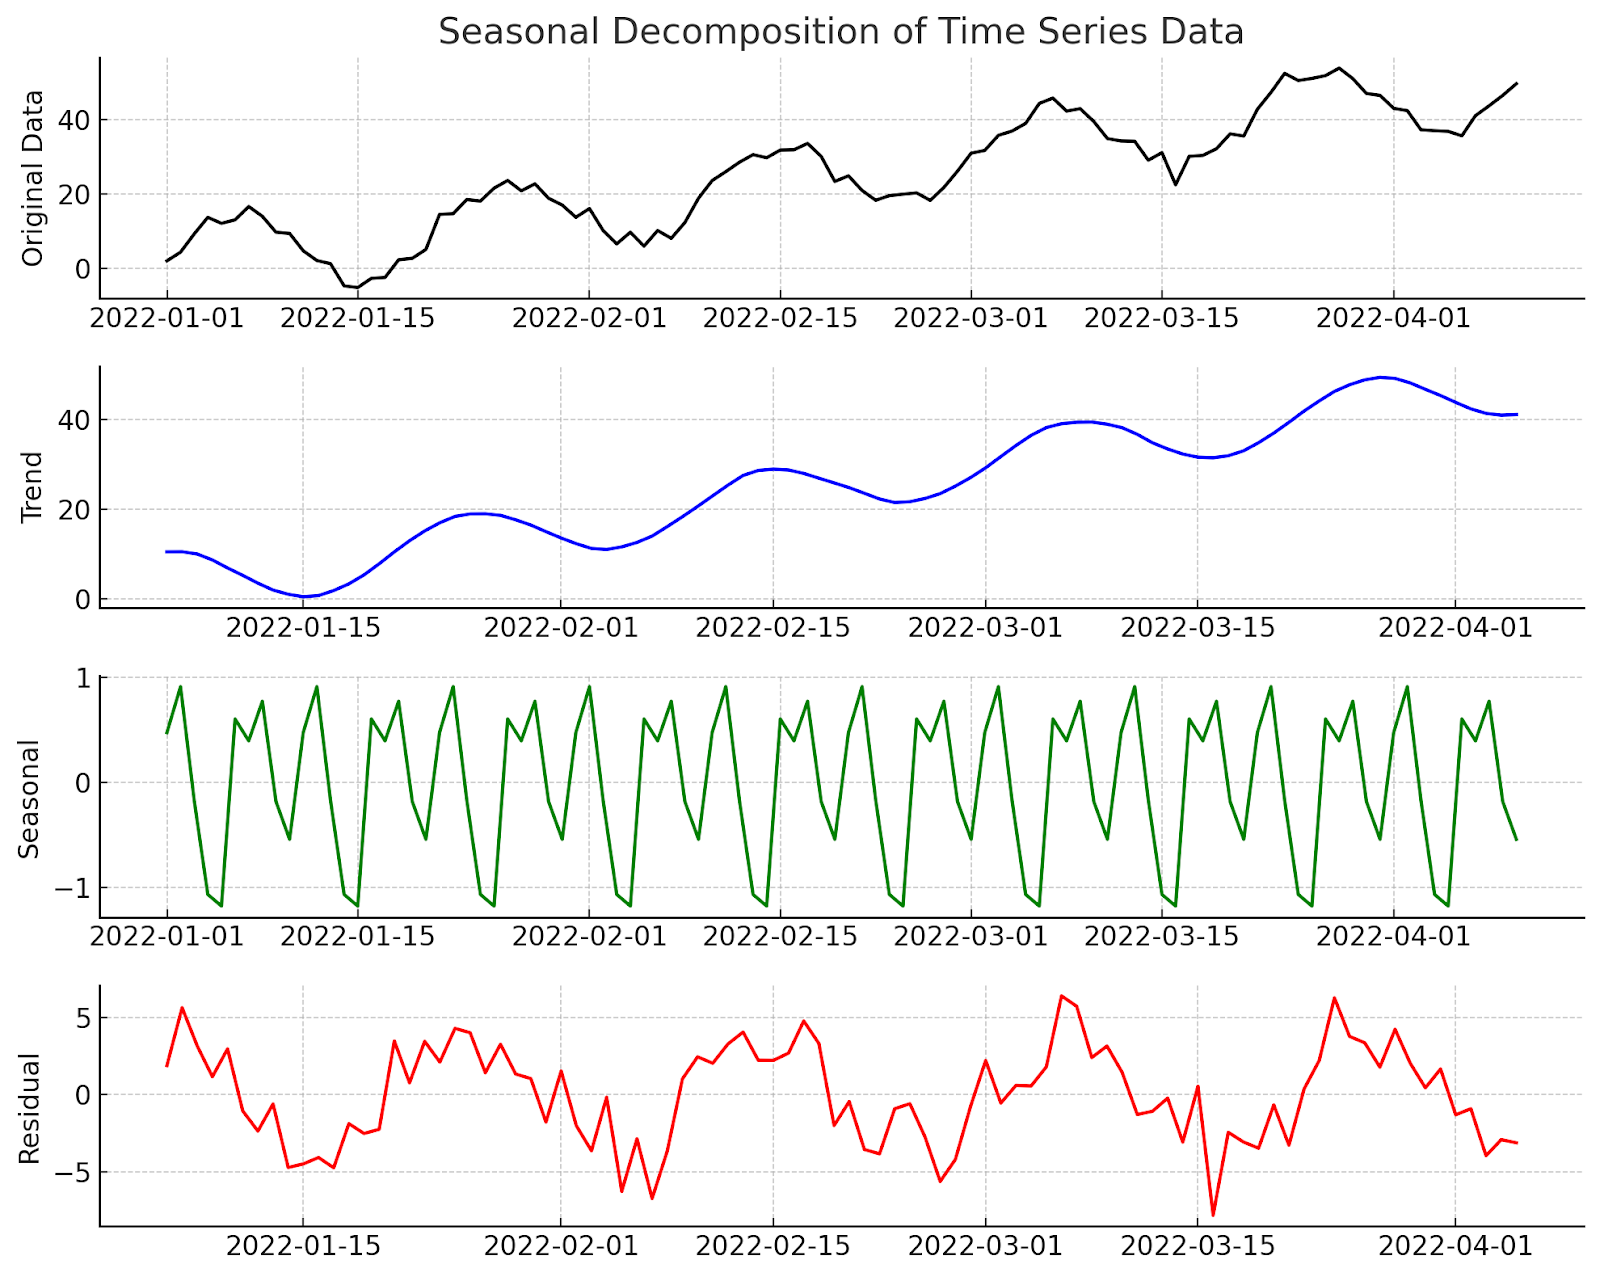
Seasonal Decomposition
This method separates time series data into trend, seasonal, and residual components to identify patterns and anomalies. Seasonal decomposition is useful for modeling time series data that exhibits strong seasonality and can be used to identify patterns and anomalies.
The three main components of seasonal decomposition are:
Trend: the overall direction of the data
Seasonal: the regular fluctuations in the data
Residual: the remaining variation in the data that is not explained by the trend or seasonal components
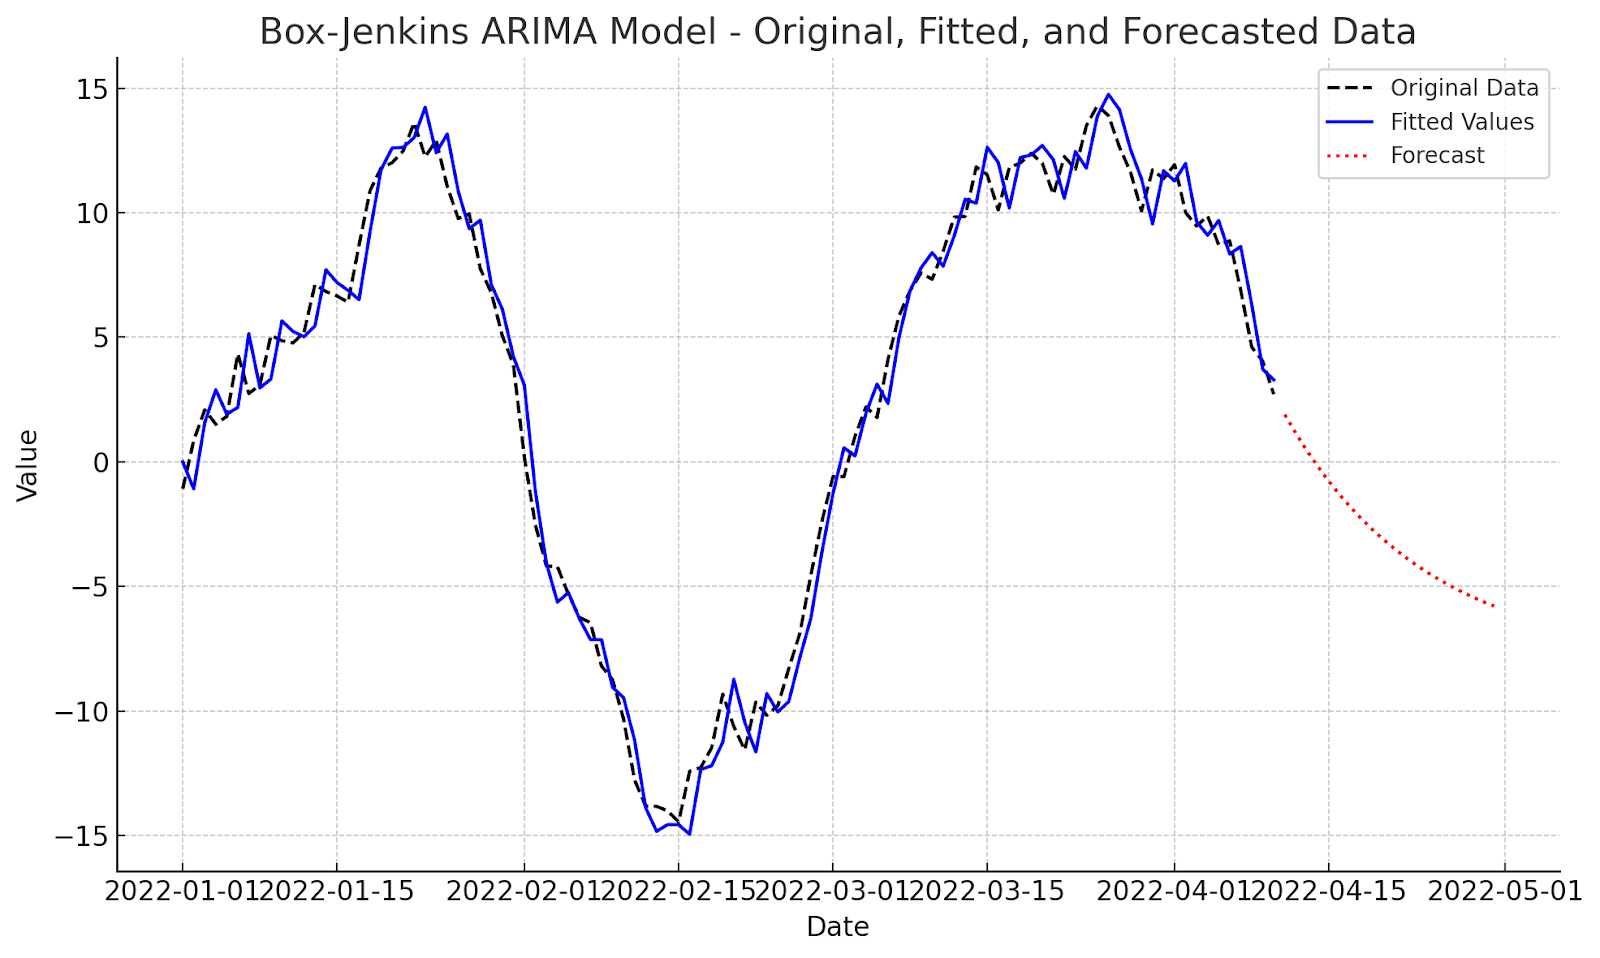
Box-Jenkins ARIMA Models
This method is an extension of the ARIMA model, which includes a more comprehensive approach to modeling time series data. Box-Jenkins ARIMA models are useful for modeling complex time series data and can be used to forecast future values.
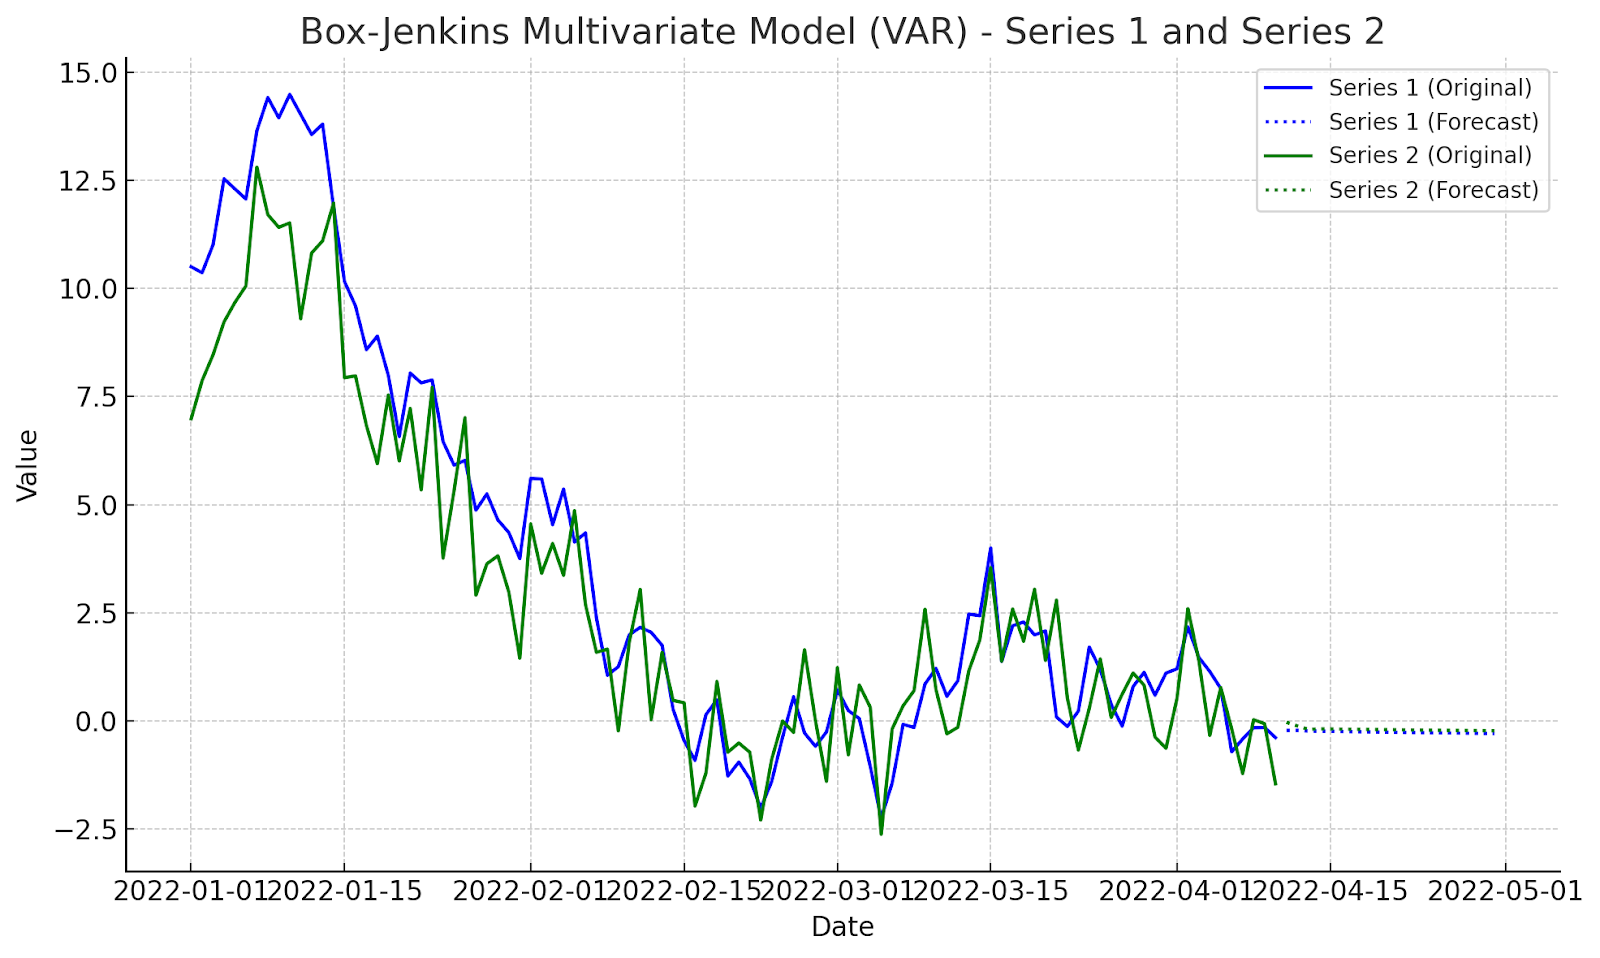
Box-Jenkins Multivariate Models
This method extends the ARIMA model to handle multiple time series variables, allowing for more complex modeling and forecasting. Box-Jenkins multivariate models are useful for modeling the relationships between various time series variables and can be used to identify patterns and anomalies in the data.
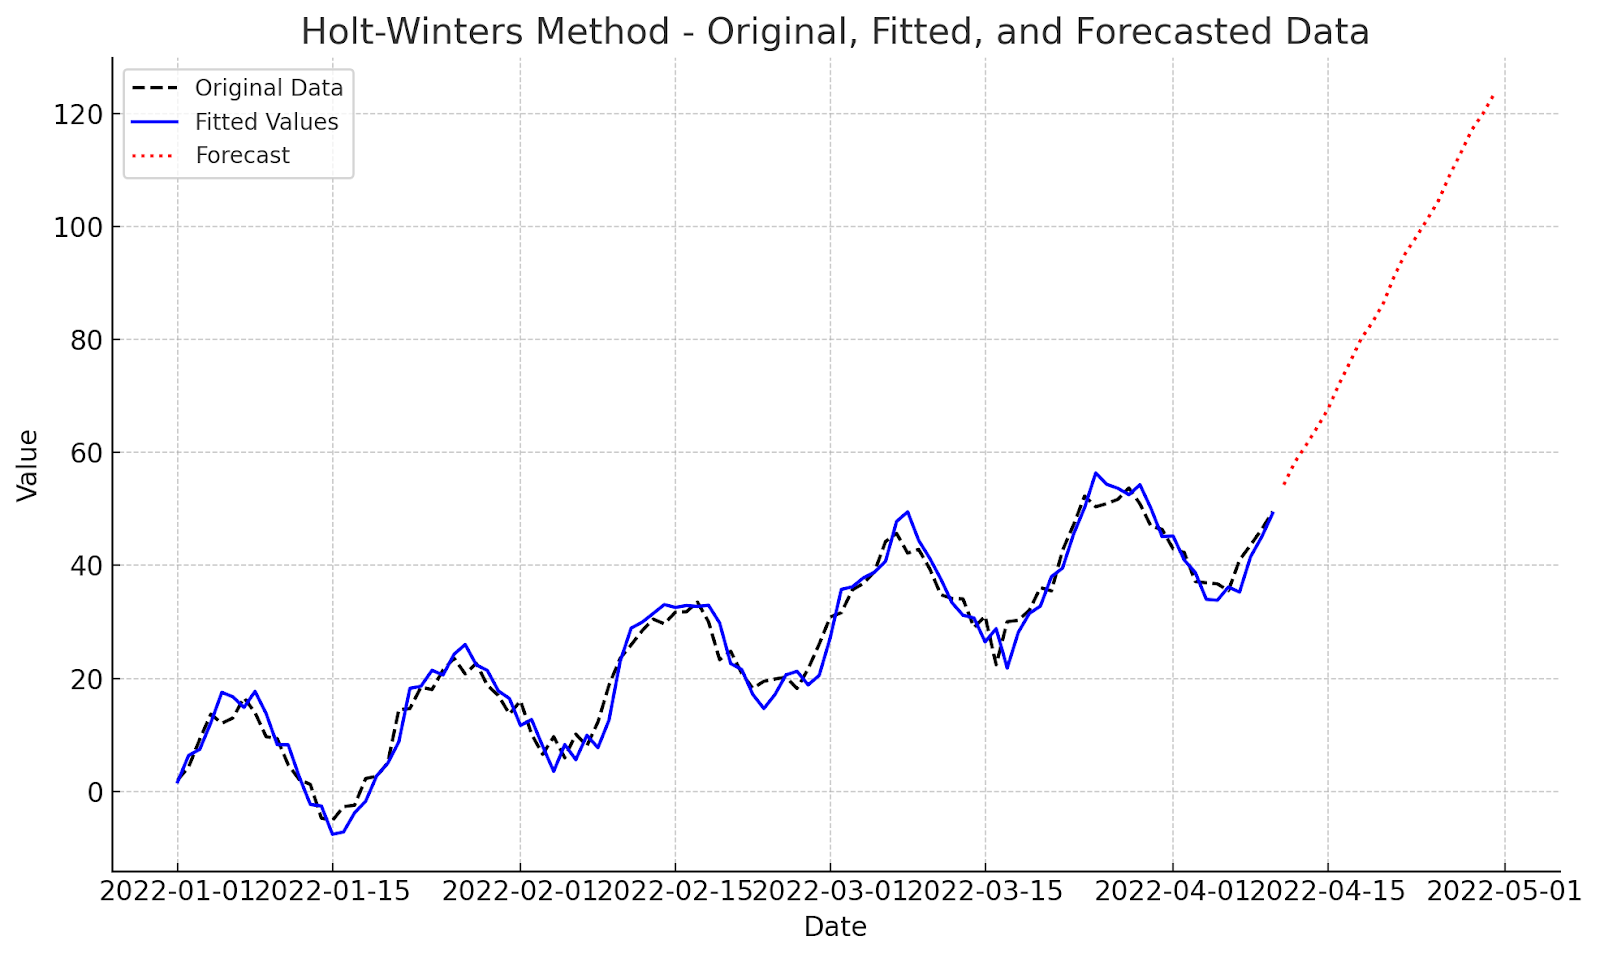
Holt-Winters Method
This type of exponential smoothing method uses a combination of trend, seasonal, and level components to forecast future values. Holt-Winters method is a type of triple exponential smoothing that uses three parameters to model the data: alpha, beta, and gamma.
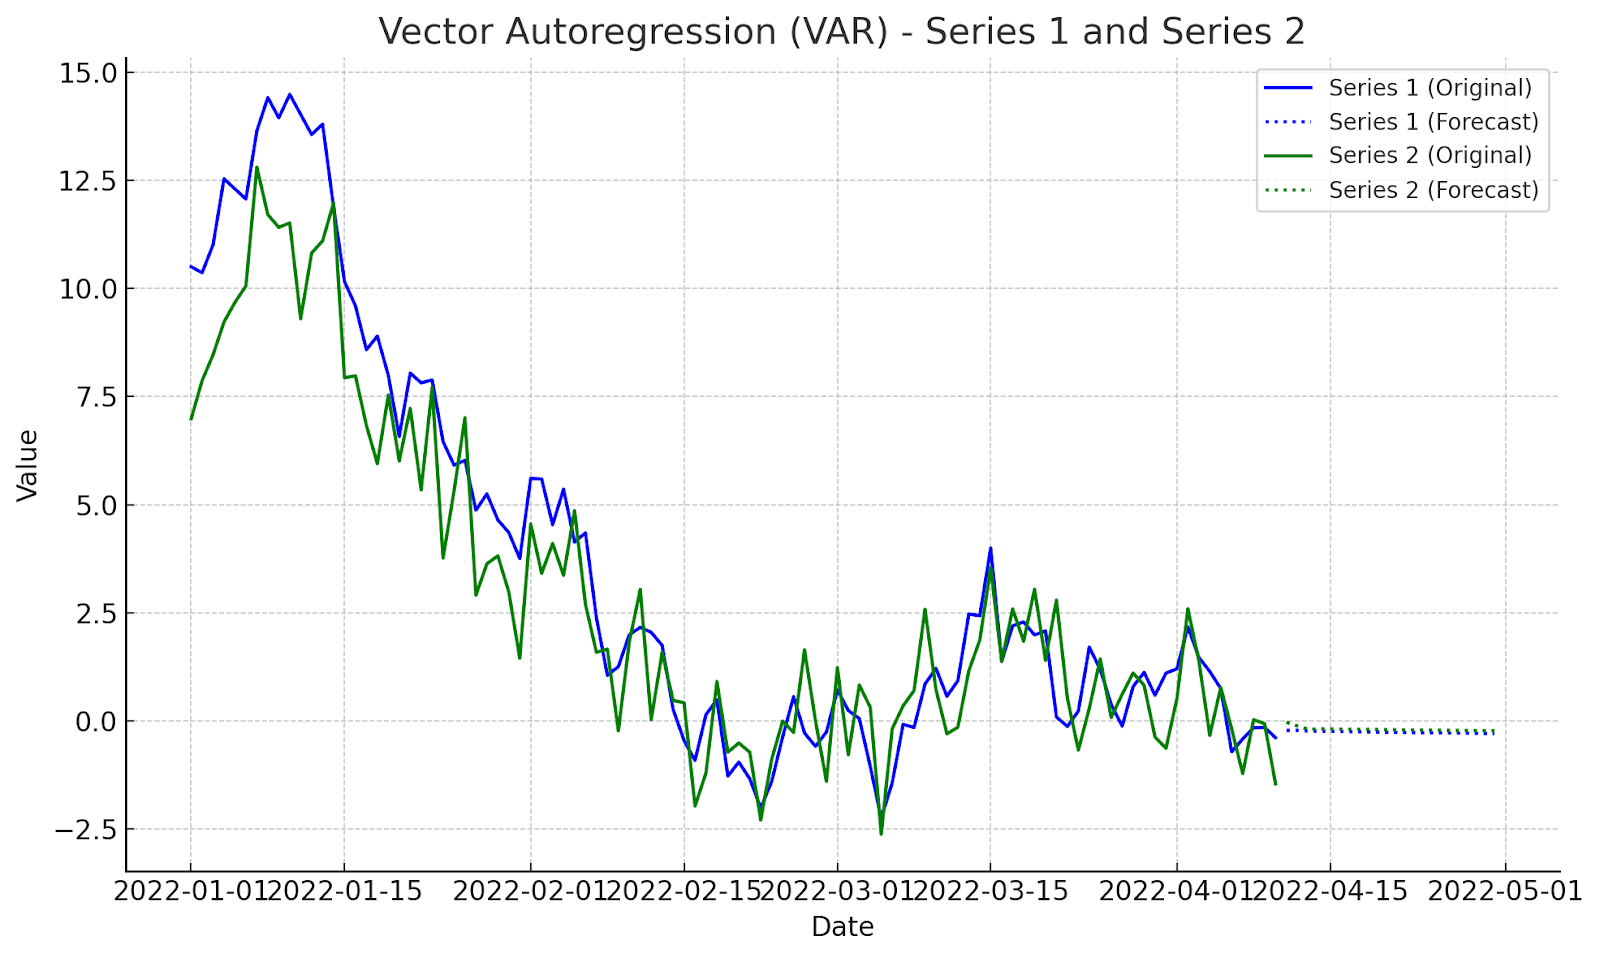
Vector Autoregression (VAR)
This method models the relationships between multiple time series variables, allowing for the analysis of complex systems. Vector autoregression is useful for modeling the relationships between various time series variables and can be used to identify patterns and anomalies in the data.
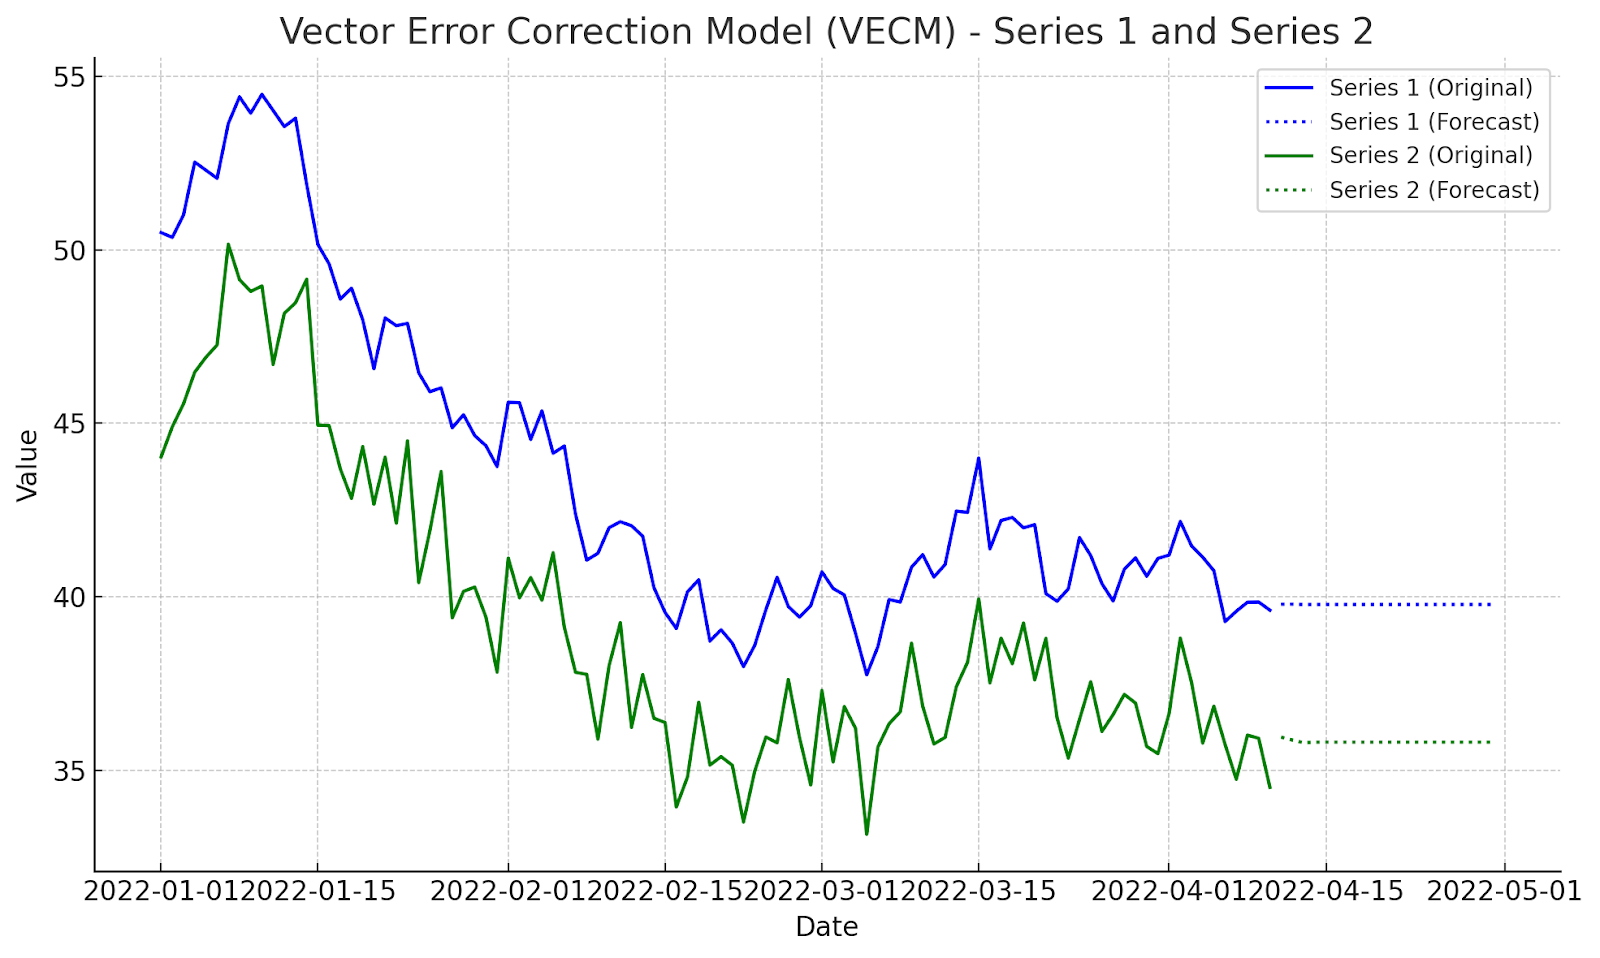
Vector Error Correction Model (VECM)
This method is an extension of the VAR model that allows for the analysis of cointegrated time series variables. Vector error correction models are useful for modeling the relationships between multiple time series variables that are cointegrated and can be used to identify patterns and anomalies in the data.
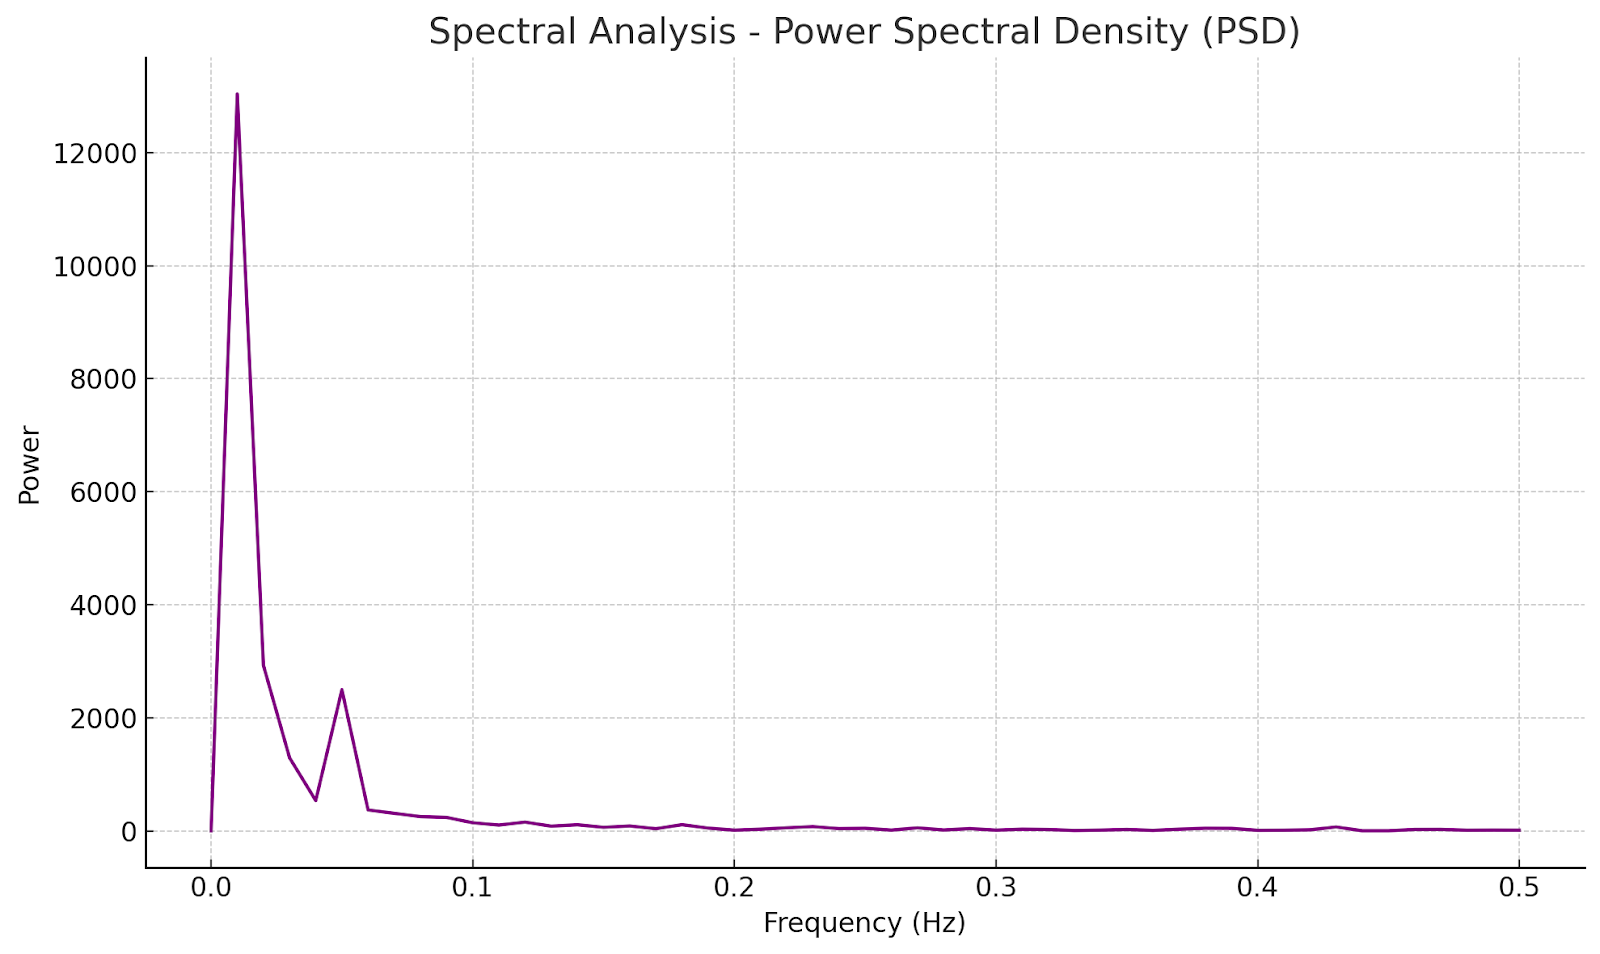
Spectral Analysis
This method analyzes the frequency components of a time series, allowing for the identification of patterns and anomalies. Spectral analysis is useful for modeling time series data that exhibits strong seasonality and can be used to identify patterns and anomalies in the data.
Machine Learning Models
This includes a range of models, such as LSTM, GRU, and Prophet, which can be used for time series forecasting and analysis. Machine learning models are useful for modeling complex time series data and can be used to identify patterns and anomalies in the data.
Note: Each method has its own strengths and weaknesses, and the choice of method depends on the data’s characteristics and the analysis’s goals.
Tools and Software for Time Series Analysis
Several tools and software are available for time series analysis, including:
Python libraries: Python libraries such as pandas, NumPy, and scikit-learn provide a wide range of tools for time series analysis.
R: R is a popular programming language for statistical analysis and provides a wide range of libraries for time series analysis.
Excel: Excel provides a range of tools for time series analysis, including the Analysis ToolPak.
Tableau: Tableau is a data visualization tool that provides a range of features for time series analysis.
Google Trends: Google Trends provides data on search volume and trends that can be used for time series analysis.
Step-by-Step Guide to Implementing Time Series Analysis in Crypto Markets
Implementing time series analysis in crypto markets involves several steps:
Step 1: Collect and Clean the Data
The first step in implementing time series analysis is to collect and clean the data. This involves gathering historical price data for the cryptocurrency you’re interested in and other relevant data, such as trading volume and market capitalization.
“Data is the lifeblood of time series analysis. Without high-quality data, it’s impossible to make accurate predictions. Collect data from reliable sources and clean it thoroughly to remove any errors or inconsistencies.”
Step 2: Visualize the Data
Use plots and charts to visualize the data and identify patterns and trends. Visualization helps to understand the behavior of the data and identify any anomalies or outliers.
Step 3: Choose a Time Series Analysis Method
Select a suitable time series analysis method based on the data’s characteristics and the analysis’s goals. Common methods include Autoregressive Integrated Moving Average (ARIMA), Exponential Smoothing (ES), Seasonal Decomposition, and Machine Learning.
Step 4: Train and Test the Model
Once you’ve chosen the model, the next step is to train and test it. This involves using a portion of the data to train the model and then testing it on the remaining data to evaluate its performance.
“Training and testing the model is a critical step in time series analysis. It’s essential to evaluate the model’s performance on a holdout sample to ensure that it’s generalizing well and not overfitting to the training data.”
Step 5: Evaluate the Model
Evaluate the model’s performance using metrics such as mean absolute error (MAE) and mean squared error (MSE). This step helps assess the model’s accuracy and identify areas for improvement.
Step 6: Refine the Model
Refine the model by adjusting parameters, adding new variables, or using different methods. This step involves iterating on the model to improve its performance and accuracy.
Step 7: Make Predictions
Use the model to predict future crypto prices, trading volumes, or other relevant metrics. This step uses the model to forecast future values based on past data.
Step 8: Monitor and Adjust
Continuously monitor the performance of the model and adjust it as needed. This step involves keeping track of the model’s performance and making adjustments to ensure that it remains accurate and effective.
Join UEEx
Experience the World’s Leading Digital Wealth Management Platform
Consider external factors impacting the crypto market, such as regulatory changes, global events, and market sentiment. This step involves considering factors that may affect the model’s accuracy.
Step 10: Use Visualization Tools
Use visualization tools to communicate results and identify patterns and trends. This step involves using plots and charts to help understand the data and make more informed decisions.
Common Examples of Time Series Analysis
Time series analysis is a crucial aspect of data analysis that deals with analyzing and forecasting data that is collected over time. Here are some examples of time series analysis:
Stock Market Analysis: Analyzing the historical prices of stocks to forecast future prices and make informed investment decisions.
Weather Forecasting: Analyzing temperature, precipitation, and other weather-related data to predict future weather patterns.
Traffic Flow Analysis: Analyzing traffic volume and speed data to optimize traffic light timings and reduce congestion.
Sales Forecasting: Analyzing historical sales data to predict future sales and make informed inventory management and production planning decisions.
Economic Indicator Analysis: Analyzing GDP, inflation, and unemployment rates to understand the overall health of an economy and make predictions about future economic trends.
Energy Consumption Analysis: Analyzing energy consumption patterns to optimize energy production and reduce waste.
Medical Research: Analyzing medical data such as blood pressure, heart rate, and other vital signs to understand the progression of diseases and develop new treatments.
Network Traffic Analysis: Analyzing network traffic data to detect anomalies and predict potential network congestion.
Agricultural Yield Analysis: Analyzing historical crop yields to predict future yields and optimize crop management practices.
Social Media Analysis: Analyzing social media data to understand trends and patterns in user behavior and sentiment.
Challenges and Limitations
While time series analysis can be a powerful tool in crypto markets, it’s important to be aware of its challenges and limitations:
Market Efficiency: As more traders use similar techniques, their effectiveness may diminish over time.
Black Swan Events: Unexpected, high-impact events can render historical patterns irrelevant.
Overfitting: Complex models may fit noise in the data rather than true patterns, leading to poor out-of-sample performance.
Data Quality: Cryptocurrency markets are relatively young, and historical data may be limited or unreliable for some assets.
Regulatory Changes: Sudden regulatory shifts can dramatically impact crypto markets, making historical patterns less relevant.
Market Manipulation: Some cryptocurrencies, especially those with lower liquidity, may be subject to manipulation that distorts true market behavior.
Computational Resources: Advanced time series analysis techniques can be computationally intensive, requiring significant hardware resources.
Integrating Time Series Analysis into Your Trading Strategy
To effectively use time series analysis in your crypto trading strategy:
Use Multiple Timeframes: Combine analyses from different time scales (e.g., hourly, daily, weekly) for a more comprehensive view.
Combine with Other Analyses: Integrate time series insights with fundamental analysis, on-chain metrics, and market sentiment data.
Risk Management: Use time series models to estimate potential drawdowns and set appropriate stop-loss levels.
Adaptive Strategies: Regularly update your models and be prepared to adjust your strategy as market conditions change.
Automate Carefully: While automation can be powerful, always maintain human oversight to catch potential model failures or unusual market conditions.
Continuous Learning: Stay updated on new techniques and regularly reassess the effectiveness of your current methods.
To implement time series analysis in crypto markets successfully, follow these best practices:
Use multiple models: Use multiple models and methods to validate results and identify the most accurate predictions.
Monitor and adjust: Continuously monitor the model’s performance and adjust parameters and methods as needed.
Consider external factors: Consider external factors that may impact the crypto market, such as regulatory changes and global events.
Use visualization tools: Use visualization tools to communicate results and identify patterns and trends.
Conclusion
Time series analysis is a powerful tool for analyzing and predicting crypto market trends. By following the steps outlined in this article, investors and traders can successfully implement time series analysis in crypto markets.
Join UEEx
Experience the World’s Leading Digital Wealth Management Platform
However, it is essential to be aware of the challenges and limitations of time series analysis in crypto markets and to follow best practices to ensure accurate and reliable results.
With years of experience in technical and crypto writing, I am a highly skilled writer who enjoys breaking down complex topics into easy-to-understand pieces. My expertise lies in the technology, open-source, blockchain, and cryptocurrency industry, where I strive to deliver engaging and informative content that educates and empowers readers.
Disclaimer: This article is intended solely for informational purposes and should not be considered trading or investment advice. Nothing herein should be construed as financial, legal, or tax advice. Trading or investing in cryptocurrencies carries a considerable risk of financial loss. Always conduct due diligence before making any trading or investment decisions.