Anyone can watch a chart go up or down. What separates profitable participants from the crowd is the ability to perform genuine crypto market analysis
Knowing why prices move, what the data is signalling beneath the surface, and how to position ahead of shifts rather than react to them.
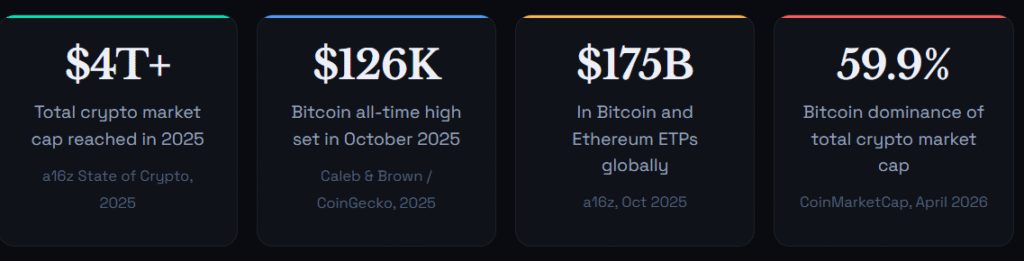
The total crypto market cap crossed $4 trillion for the first time during 2025. Bitcoin surged to a record high of $126,298 in October 2025 before pulling back.
Ethereum staged a 42% year-to-date recovery while stablecoins processed $46 trillion in transaction volume approaching the settlement volume of the entire ACH network.
These are not random fluctuations.
They are signals, and learning to read them is the foundation of every informed trading or investing decision in this market.
Join UEEx
Experience the World’s Leading Digital Wealth Management Platform
This guide walks through the complete analytical framework: market cycles, on-chain metrics, technical analysis, sentiment tools, why reading cryptocurrency charts is essential for traders that now drive crypto prices more than ever before.
Crypto market analysis is the systematic process of evaluating digital asset markets using data, price history, on-chain activity, macroeconomic context, and investor sentiment to form an informed view of where prices may go and why.
Join UEEx
Experience the World’s Leading Digital Wealth Management Platform
It is the antidote to emotional, reactive trading.
The cryptocurrency market operates 24 hours a day, 7 days a week, across hundreds of exchanges and thousands of trading pairs globally.
Perpetual centralised crypto exchanges alone recorded $86.2 trillion in trading volume in 2025, a 47.4% increase year-over-year.
With that scale of activity, the difference between systematic analysis and intuition-based decisions becomes commercially significant very quickly.
There are three core pillars of thorough crypto market analysis, and experienced participants use all three in combination.
The first is technical analysis, which reads price and volume patterns directly from charts.
The second is on-chain analysis, which examines actual blockchain data to understand what holders and miners are doing with their assets.
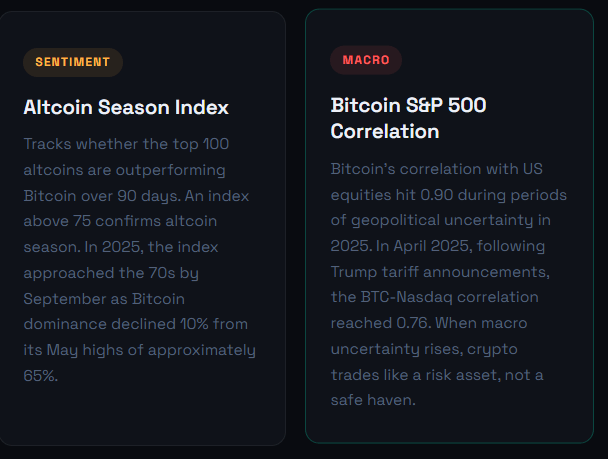
The third is fundamental and macroeconomic analysis, which assesses the broader financial environment interest rates, institutional flows, regulatory changes that increasingly drives crypto price behaviour.
Ignoring any one of these three creates blind spots.
How Do Crypto Market Cycles Work and Where Are We in
One of the most valuable concepts in crypto market analysis is the market cycle, the repeating sequence of phases that asset prices move through, driven by supply changes, investor psychology, and macroeconomic conditions.
Knowing which phase you are in fundamentally changes the right analytical approach and the appropriate risk posture.
Accumulation Phase:
Prices are low and broadly ignored after a prolonged downturn. Smart money quietly builds positions.
Volume is light and media coverage is negative. This is where the best risk-adjusted opportunities develop, but require patience and conviction.
Prices decline sharply as holders sell into weakness. Media turns negative and retail exits. Bitcoin has historically corrected 70 to 85% from cycle peaks before forming a new accumulation base.
The current post-October 2025 pullback down 46.7% from the all-time high to mid-February 2026 may represent this phase’s early stages.
Join UEEx
Experience the World’s Leading Digital Wealth Management Platform
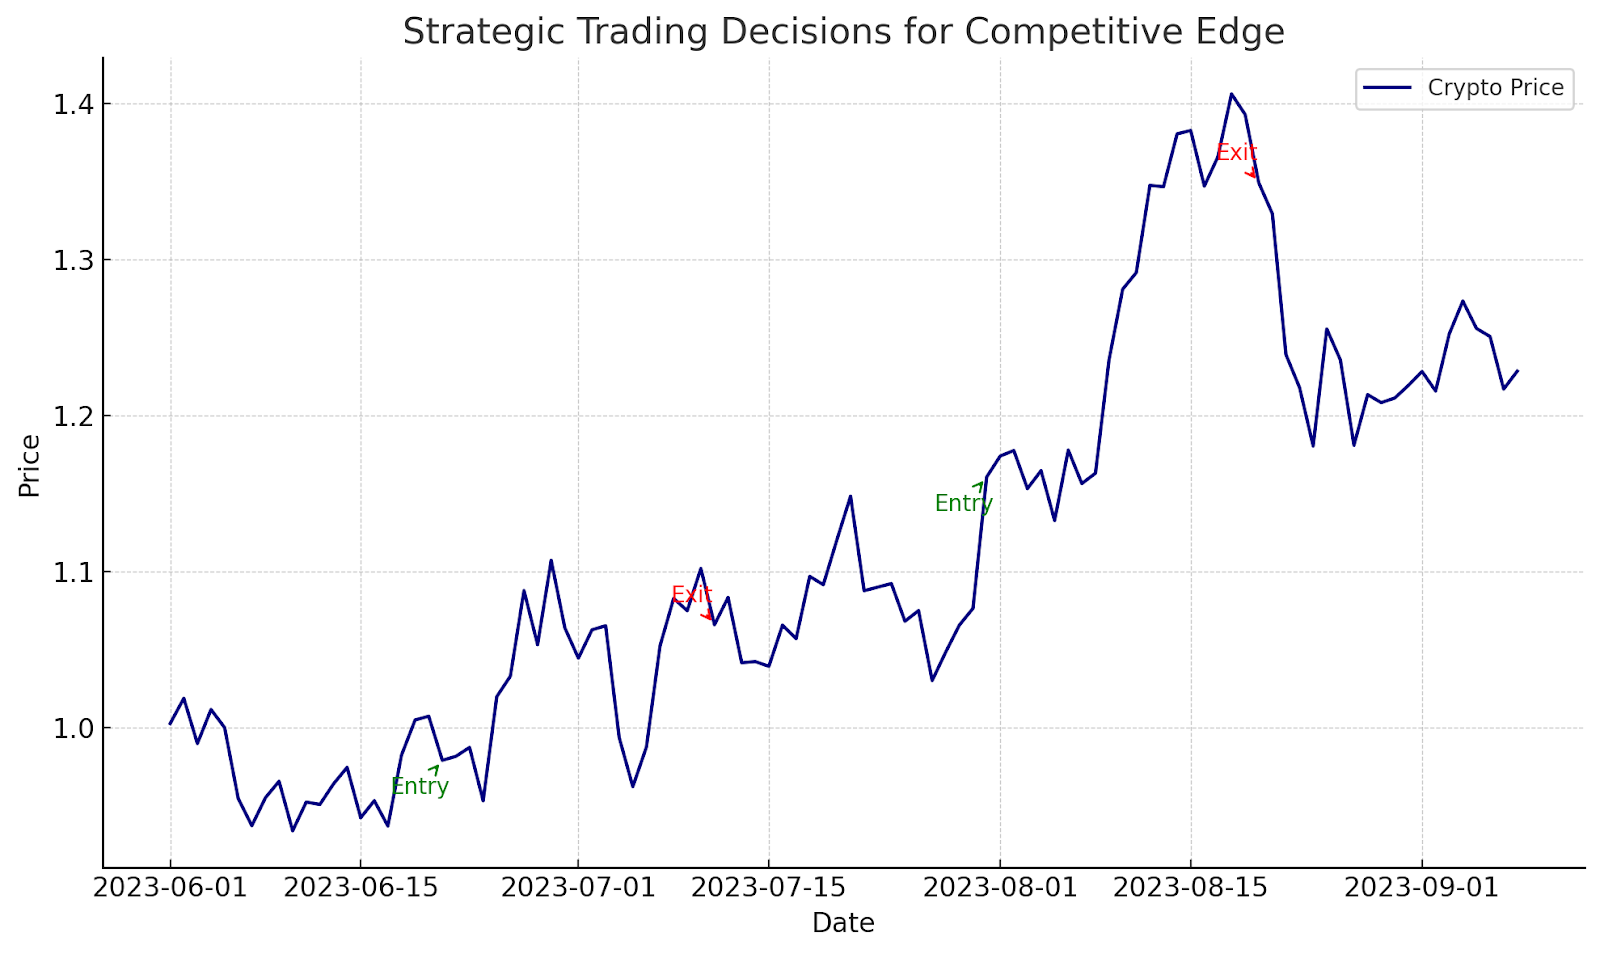
Why Reading Cryptocurrency Charts is Essential for Traders
In cryptocurrencies, traders must read charts. Charts show market trends. Traders use them to make smart investments.
The charts provide key insights into cryptocurrencies’ price movements and patterns. They help traders find potential buying or selling chances.
These are the main reasons why traders must understand cryptocurrency charts.
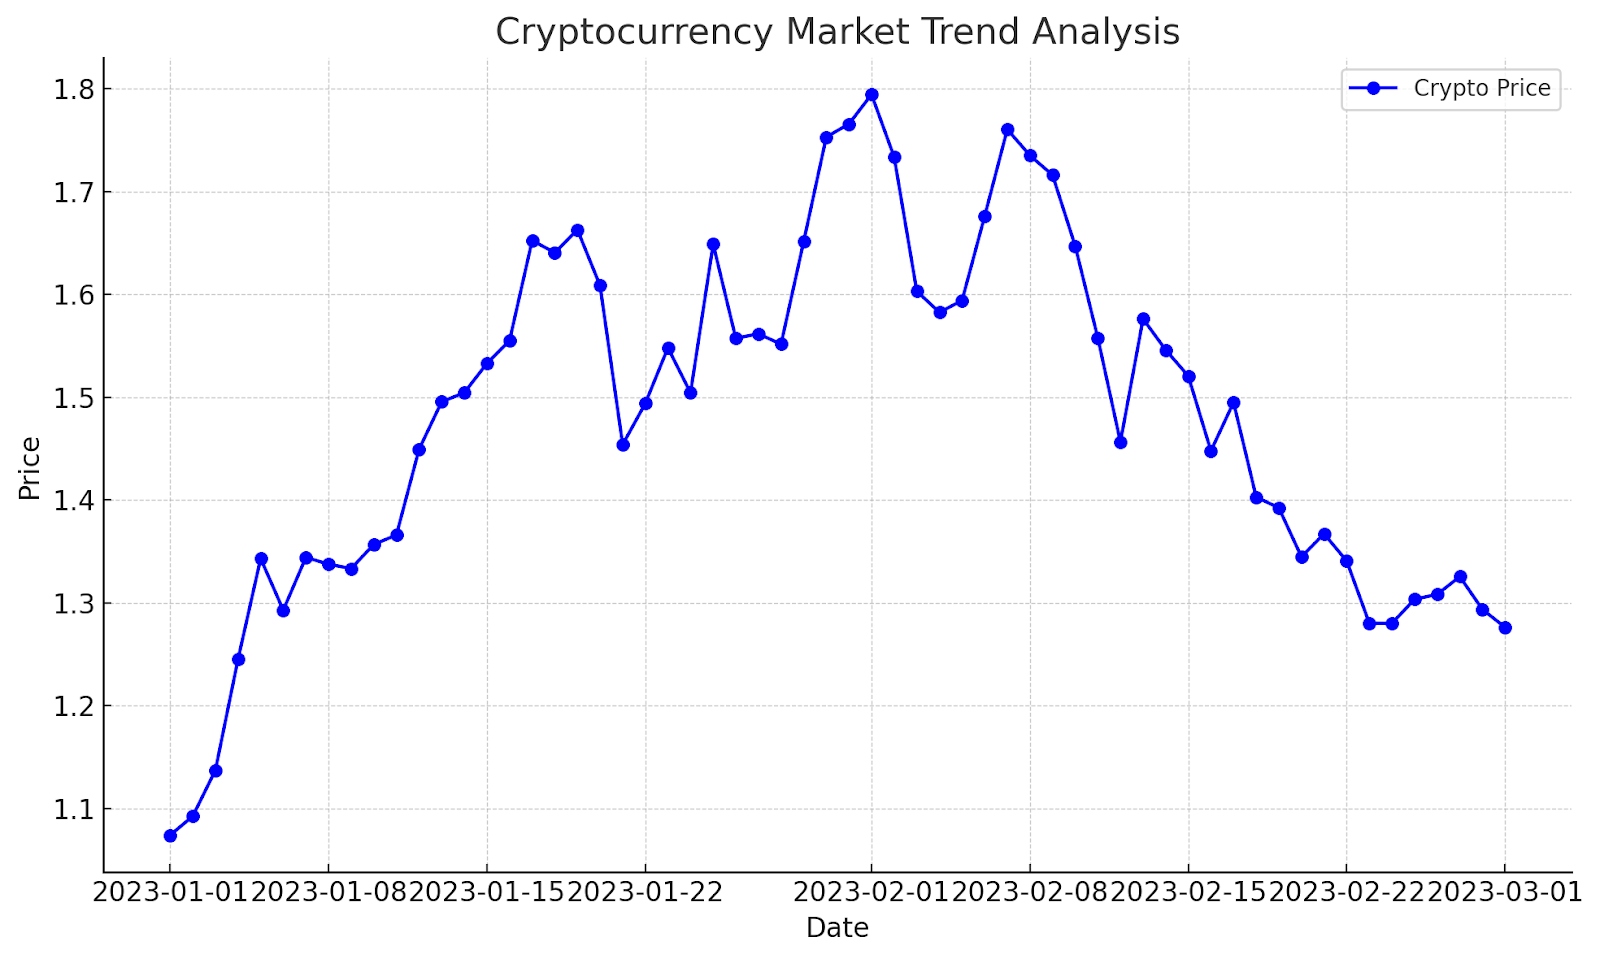
Identifying Market Trends
Cryptocurrency charts allow traders to identify and analyze market trends. By studying the price movements over time, traders can tell if a cryptocurrency is up or down. This information is crucial for buying or selling at the right time and maximizing profits.
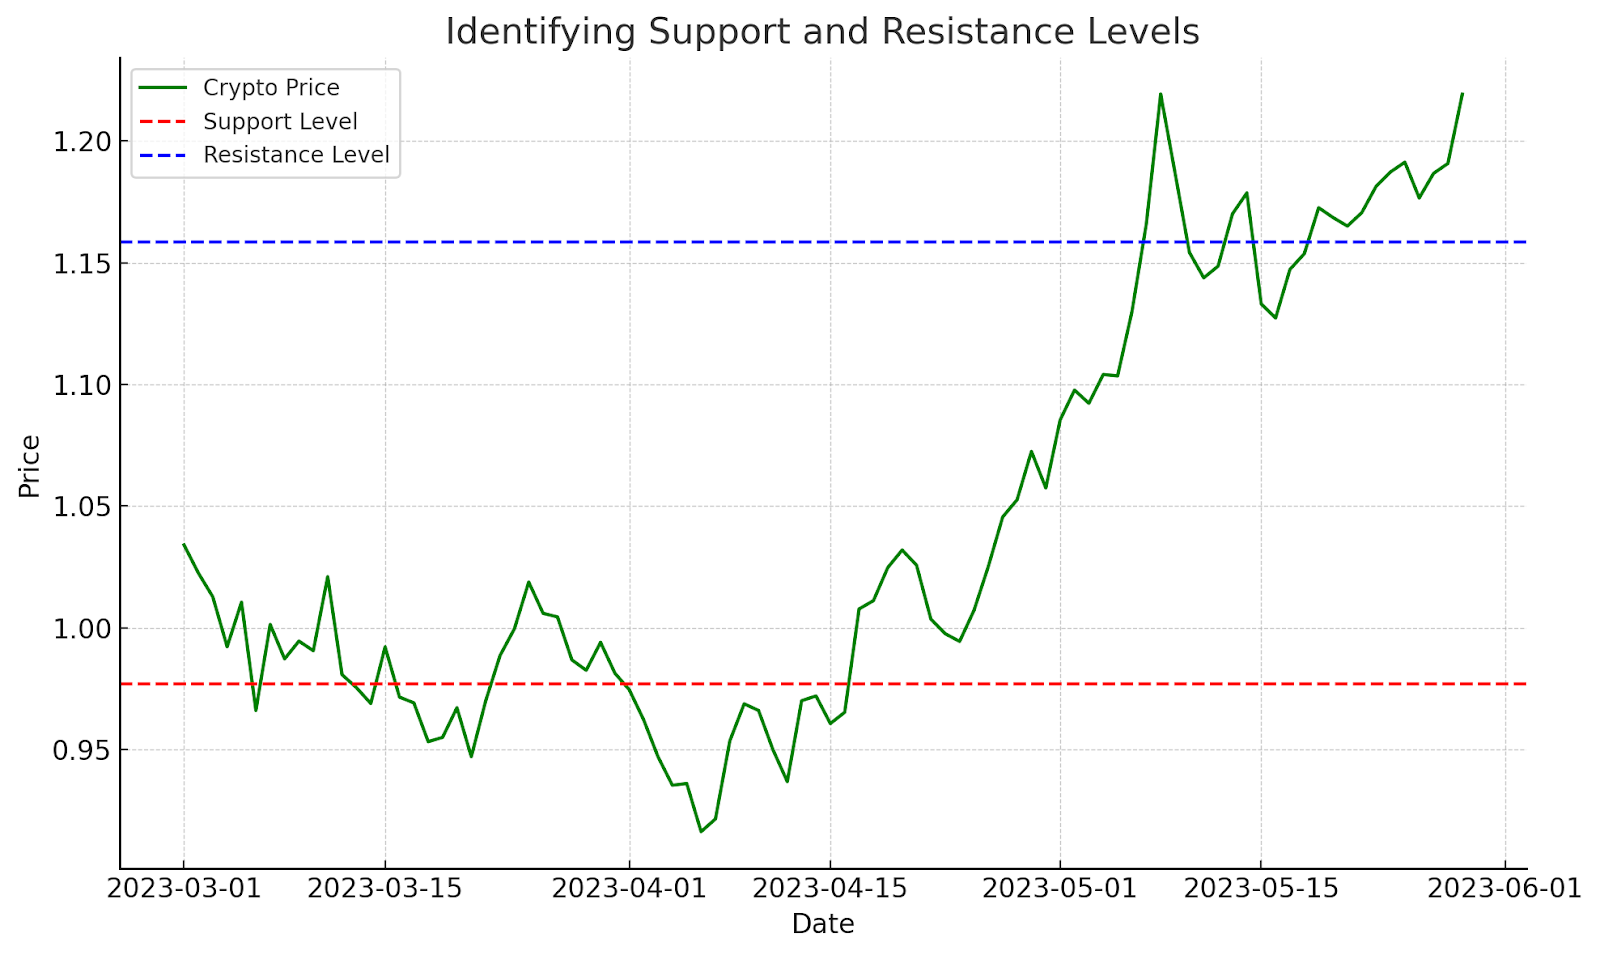
Spotting Support and Resistance Levels
Support and resistance are key price levels. Cryptocurrencies tend to see buying or selling pressure at these levels.
Cryptocurrency charts help traders find these levels. They are key points for entering and exiting trades.
Traders can use this information to set stop loss levels and take profit targets, ensuring effective risk management.
Analyzing Price Patterns
Cryptocurrency charts show many price patterns. These include triangles, head and shoulders, and double bottoms.
These patterns provide insights into market participants’ psychology. They can show potential future price movements. By seeing these patterns, traders can make informed predictions.
They can then adjust their trading strategies accordingly.
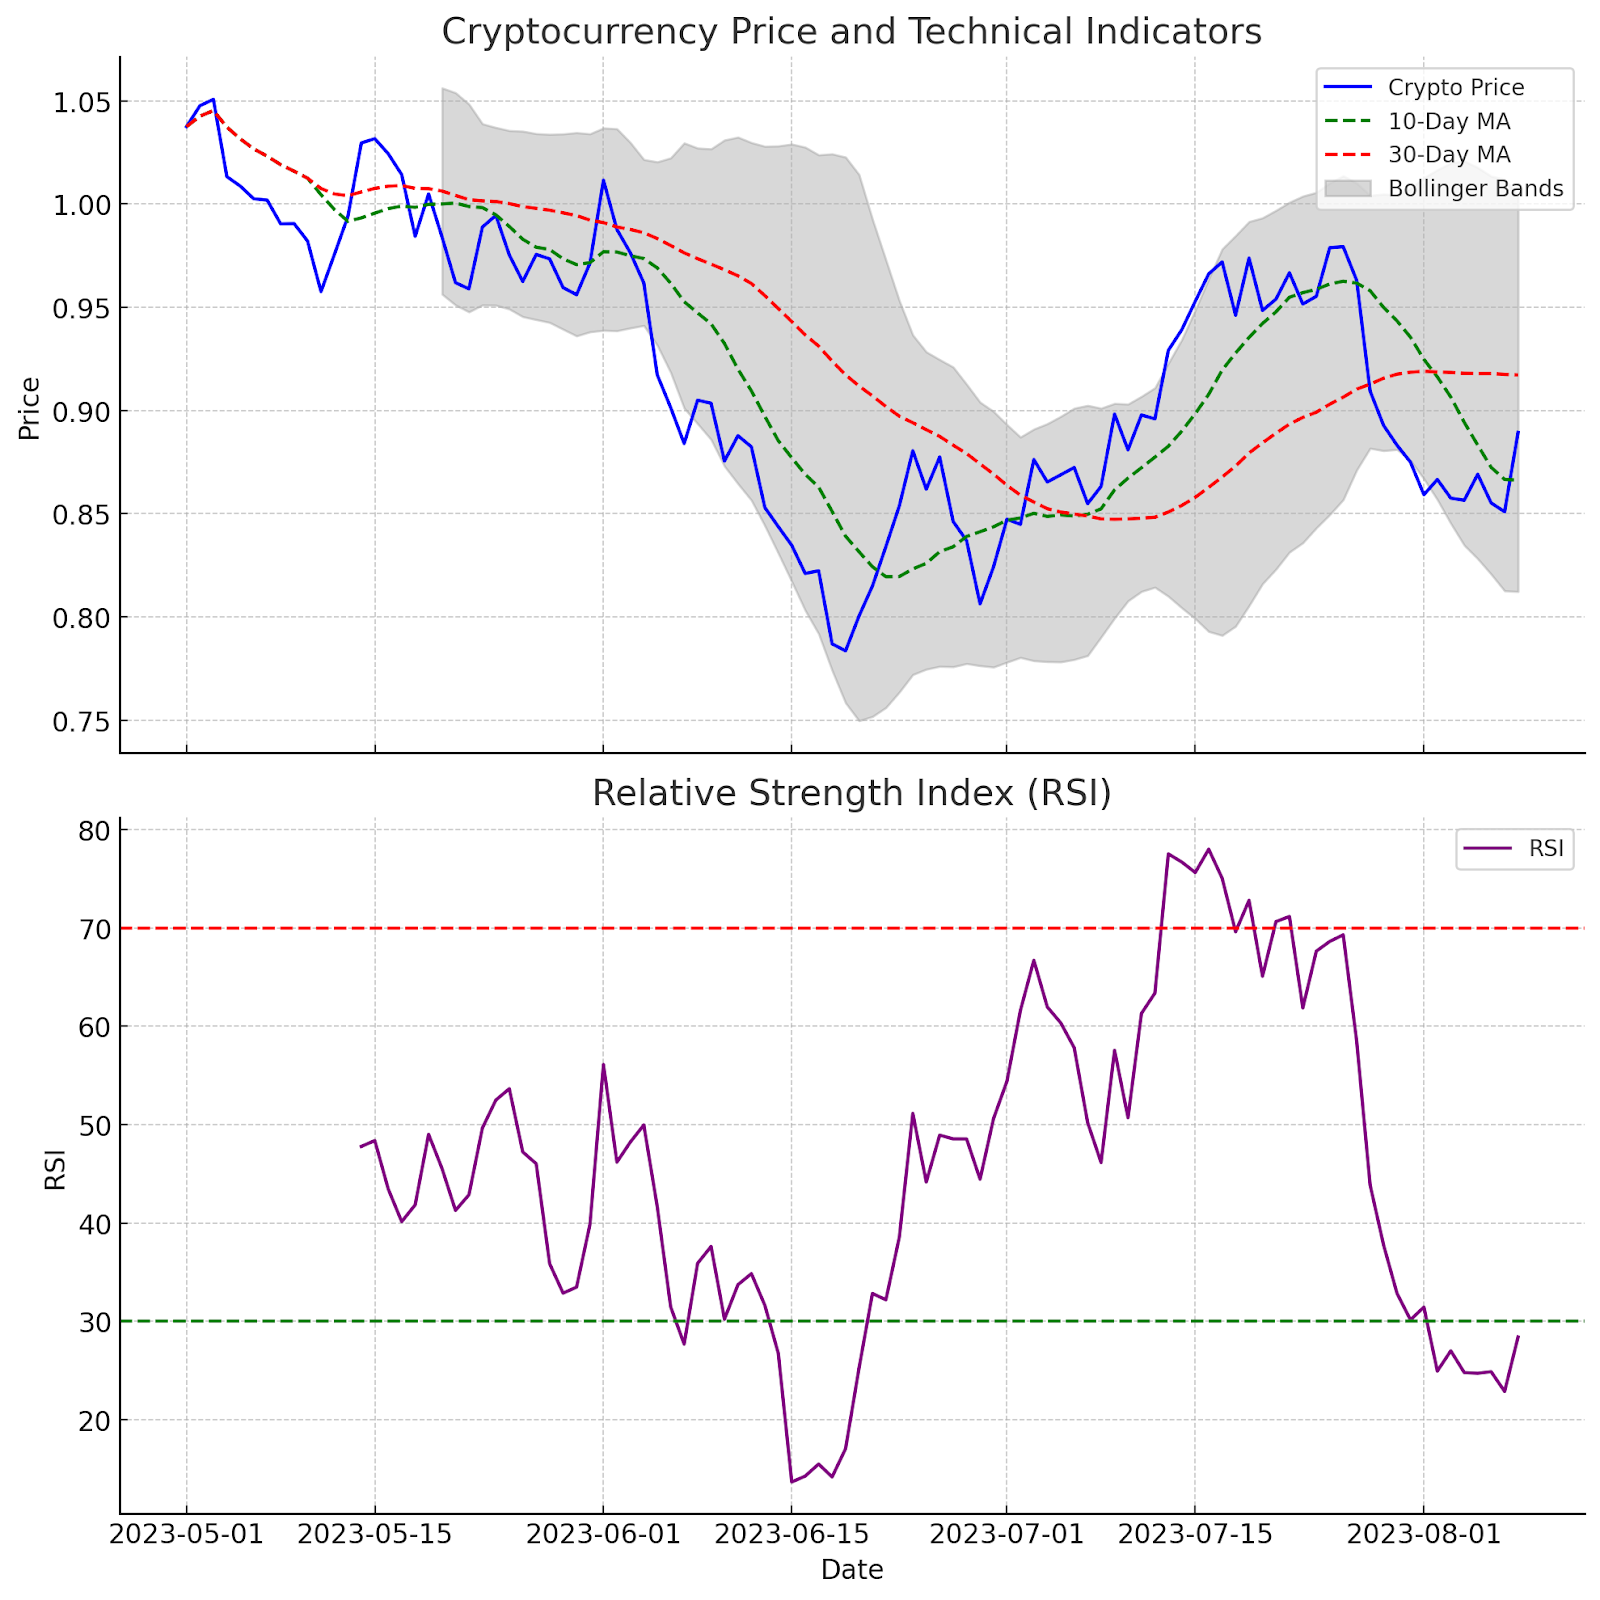
Utilizing Technical Indicators
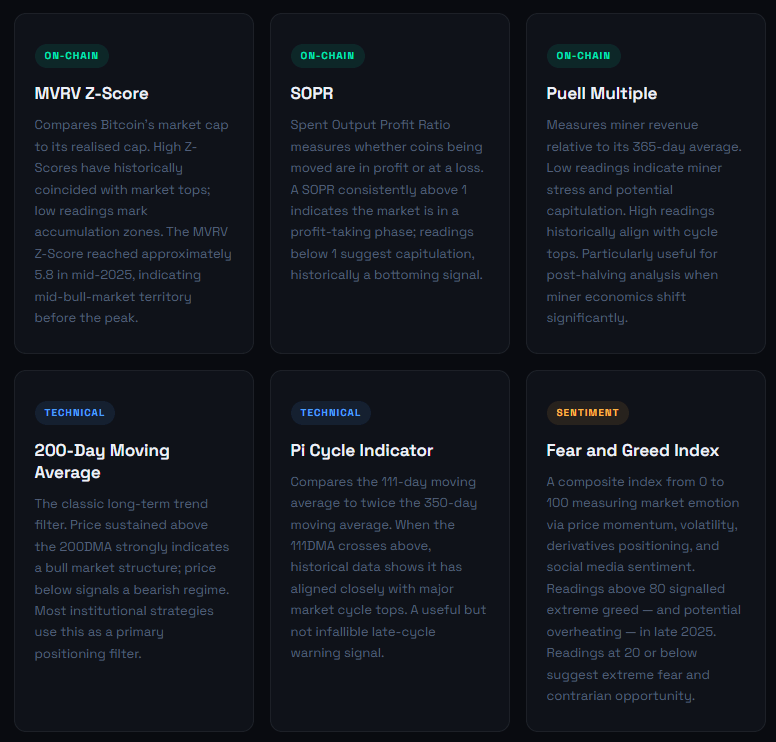
Cryptocurrency charts include technical indicators. These include moving averages, the relative strength index (RSI), and Bollinger bands.
These indicators offer more information to traders. The info helps them confirm trends, assess market volatility, and find entry or exit points.
Traders can customize these indicators. They can base them on their preferred trading strategies and risk tolerance.
Gaining a Competitive Edge
By thoroughly studying and understanding cryptocurrency charts, traders can gain a competitive edge. They can make well-informed decisions based on their analysis and stay ahead of market trends.
This proactive approach increases their chances of successfully navigating the highly volatile cryptocurrency market.
Carrying out crypto market analysis involves a blend of quantitative and qualitative methods, focusing on both the technical aspects of the market as well as the broader economic, political, and social factors that can influence prices.
Here’s a structured approach to performing a comprehensive crypto market analysis:
Fundamental Analysis
White Paper Scrutiny: The foundation of any cryptocurrency lies in its white paper.
This document details the project’s vision, the technology powering it, and the problem it aims to solve.
Analyse the white paper for clarity, feasibility, and its potential to disrupt existing systems.
Team Evaluation: The team behind a cryptocurrency is a significant driver of its success.
Research developers’ experience, track record, cryptography, and blockchain technology expertise. A strong team fosters confidence in the project’s execution.
Market Need and Competition: Assess the real-world need for the cryptocurrency’s proposed solution.
Does it address a genuine problem, or is it simply another entrant in a crowded market? Evaluate existing competitors and how this particular cryptocurrency differentiates itself.
Regulatory Landscape: The regulatory environment surrounding cryptocurrencies is constantly evolving. Stay informed about government regulations and potential roadblocks impacting the market or specific projects.
Technical Analysis
Price Chart Mastery: Price charts depict the historical price movements of a cryptocurrency.
By studying these charts, you can identify trends like uptrends, downtrends, and consolidation periods.
Look for support and resistance levels where prices bounce off or stall to gauge potential future price movements.
Trading Volume: Trading volume indicates the number of cryptocurrency units bought and sold within a specific timeframe. High volume suggests strong investor interest and potential for price volatility. Conversely, low volume implies a lack of liquidity, making entering or exiting trades quickly difficult.
Technical Indicators: Technical indicators are mathematical formulas applied to price and volume data to identify trends, predict future price movements, and generate trading signals. Popular indicators include moving averages, Relative Strength Index (RSI), and Bollinger Bands. Remember, these indicators are not absolute predictors but tools to enhance your analysis.
Beyond the Basics
On-Chain Analysis: This go deeper into blockchain data, revealing insights into network activity, transaction volume, and the number of active addresses.
This data can help assess investor sentiment, project adoption, and potential future trends. Tools like CryptoQuant offer valuable on-chain metrics.
News and Social Media Sentiment: Stay updated on relevant industry news and social media discussions surrounding specific cryptocurrencies and the broader market.
This can help gauge public perception and potential shifts in investor sentiment.
Expert Opinions and Research Reports: Reputable financial institutions and research firms often publish insightful reports on the crypto market.
Consider these alongside your analysis for a well-rounded perspective.
What Are the Best On-Chain Metrics for Crypto Market Analysis?
On-chain analysis is the area where crypto market analysis differs most sharply from traditional financial analysis.
Because blockchain transactions are public and immutable, it is possible to observe with precision what holders at every level from long-term institutional holders to new retail buyers are actually doing with their assets, not just what sentiment surveys say they might do.
These metrics provide a depth of insight that equity market analysts simply do not have access to.
Join UEEx
Experience the World’s Leading Digital Wealth Management Platform
What Are the Most Common Mistakes in Crypto Market Analysis?
1. Treating One Indicator as the Whole Answer
The Fear and Greed Index hitting extreme greed does not automatically mean sell. The MVRV Z-Score flashing high does not automatically mean the top is in.
Each indicator measures one dimension of a multidimensional market. Decisions built on a single signal have a poor track record. Always seek confirmation across multiple methods before acting on a reading.
2. Confusing Altcoin Rotation With a New Bull Market
Capital rotating from Bitcoin into altcoins as occurred from July to September 2025 can create the appearance of a broad bull market in assets that are actually in a late-cycle distribution phase.
Monitoring Bitcoin dominance trends and on-chain metrics across multiple assets simultaneously helps distinguish genuine market expansion from rotation-driven rallies that quickly reverse.
3. Using Lagging Indicators as Leading Signals
Moving averages and RSI are by definition lagging tools, they confirm what has already happened.
Using them to predict what will happen next without combining them with leading indicators like on-chain accumulation data, exchange inflows and outflows, or futures funding rates reduces their analytical value considerably.
4. Assuming This Cycle Will Perfectly Repeat the Last
The 2025 cycle produced a much smaller post-halving rally than 2021 because institutional buyers created a demand floor well before the halving itself.
Models that worked perfectly in 2017 and 2021 including Stock-to-Flow visibly failed to predict 2024 and 2025 price behaviour.
Always stress-test your analytical framework against the possibility that structural market changes have altered the patterns you are relying on.
Conclusion
Hitting a $4 trillion market cap in early 2026 is not just another cycle, it’s a major growth in the global financial order.
When you commit to high-level crypto market analysis, you stop following the crowd and start positioning yourself ahead of the signals that move the world’s most liquid assets.
Join UEEx
Experience the World’s Leading Digital Wealth Management Platform
Disclaimer: This article is intended solely for informational purposes and should not be considered trading or investment advice. Nothing herein should be construed as financial, legal, or tax advice. Trading or investing in cryptocurrencies carries a considerable risk of financial loss. Always conduct due diligence before making any trading or investment decisions.