Trend following is a trading approach where you identify the direction a cryptocurrency is already moving and place trades that align with that momentum – not predict where it will go next. When price climbs consistently, you buy and hold as long as the uptrend remains intact. When price falls, you exit longs or take short positions. The strategy rewards patience over precision: you don’t need to catch the exact top or bottom, only to participate in the sustained middle portion of a move without second-guessing every dip.
What Is Trend Following in Cryptocurrency Trading?
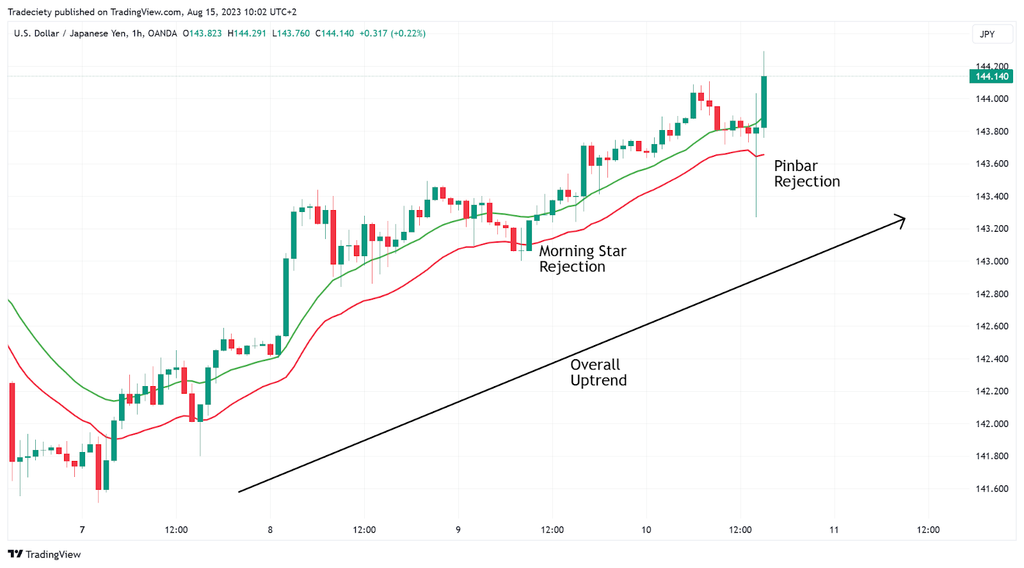
Trend following rests on a straightforward observation: asset prices tend to move in one direction for extended periods before reversing. A cryptocurrency that has been rising for three weeks is statistically more likely to keep rising tomorrow than to suddenly reverse – until the trend shows signs of exhausting itself.
This is different from predicting direction. Trend followers don’t forecast where Bitcoin will be in six months. They observe that Bitcoin is currently moving up, confirm that observation with technical indicators, enter a position, and exit when the evidence of an uptrend deteriorates. The approach is reactive rather than predictive.
As of Q1 2026, trend following remains one of the most practiced approaches among active crypto traders. Total crypto trading volume reached $86.2 trillion in 2026 – a 47.4% increase from 2024 – which means more price data, more identifiable patterns, and more opportunities for trend-based strategies to operate.
Also Read: Trend Lines in Charts: What You Need to Know
What Are the Different Types of Market Trends?
Not all trends are equal in duration or strength. Identifying which type you’re trading determines your holding period and risk parameters.
| Trend Type | Duration | Typical Trader | Primary Tools |
| Short-term | Hours to days | Day trader, scalper | 1h/4h charts, EMA, MACD |
| Intermediate | Weeks to months | Swing trader | Daily charts, SMA, RSI, trendlines |
| Long-term | Months to years | Position trader | Weekly charts, 200-day SMA, Ichimoku |
Within any timeframe, you’ll encounter three directional states: an uptrend (higher highs, higher lows), a downtrend (lower highs, lower lows), and a sideways range (price oscillating between support and resistance). Trend following strategies perform best in the first two states. During the third, the correct move is usually to stay flat or reduce position size until a clear trend re-establishes itself.
Why Do Trend Following Strategies Work in Crypto Markets?
Crypto markets have specific characteristics that make trend following particularly applicable. Volatility is higher than most traditional asset classes – Bitcoin regularly posts 5–10% daily swings that would be extraordinary in equity markets. That volatility, while risky, produces the large directional moves that trend following profits from.
Crypto markets also react sharply to catalysts: regulatory announcements, exchange listings, network upgrades, and macroeconomic data all trigger sustained directional moves. In 2026, Bitcoin reached an all-time high near $109,000 in January before seeing significant drawdowns, then climbed again into Q4 – a trend-rich environment in both directions.
Crypto markets also trade 24 hours a day, seven days a week. There are no overnight gaps or weekend halts to disrupt positions unexpectedly (though thin weekend liquidity can cause sharp moves). This continuity lets trend followers monitor and adjust positions in real time.
What Technical Indicators Do Trend Followers Use?
How Does the Moving Average Strategy Work?
Moving averages smooth out price noise and reveal the underlying direction. The Simple Moving Average (SMA) weights all periods equally. The Exponential Moving Average (EMA) weights recent prices more heavily, reacting faster to new information.
The most common trend following signal is the moving average crossover. When a shorter-period average crosses above a longer-period average – the “golden cross” – it signals potential uptrend momentum. The 50-day crossing above the 200-day is the classic long-term version. The inverse is the “death cross,” signaling bearish momentum.
For faster signals, EMA crossovers using 12-period and 26-period averages on 4-hour or daily charts provide more timely entries, at the cost of more false signals. Testing both SMA and EMA on your specific asset and timeframe determines which fits your strategy better. Bitcoin backtests show lookback periods from 5 to 100 days have all been profitable historically, with 15 days offering the strongest risk-adjusted returns when combined with an ADX filter.
How Does the RSI Help Confirm Trends?
The Relative Strength Index (RSI) measures momentum on a scale of 0 to 100. Readings above 70 traditionally indicate overbought conditions. Readings below 30 indicate oversold conditions. For trend followers, RSI serves primarily as a filter rather than a primary signal. Entering a long trade when both a moving average crossover and RSI confirm bullish momentum – RSI in the 50–70 range, moving up – produces higher-quality setups than relying on either indicator alone.
What Are Bollinger Bands and How Do Trend Followers Use Them?
Bollinger Bands consist of a middle simple moving average flanked by two bands set at two standard deviations above and below. When the bands widen, volatility is expanding. When they contract into a “squeeze,” volatility is compressing – often preceding a breakout move in one direction. Trend followers watch Bollinger Band squeezes as potential setups: a candle close above the upper band during a squeeze resolution can signal the start of a new uptrend. Price persistently riding the upper band signals strong trend continuation.
How Does MACD Work for Trend Identification?
The Moving Average Convergence Divergence (MACD) indicator calculates the difference between two EMAs – typically the 12-period and 26-period – and plots that difference alongside a 9-period signal line. When the MACD line crosses above the signal line, it suggests building upside momentum. The histogram below the MACD lines shows the distance between them. A growing histogram means momentum is accelerating. A shrinking histogram – even if price is still moving up – warns that the trend is losing steam.
What Are the Core Trend Following Strategies?
How Does the Breakout Strategy Work?
Breakout trading targets moments when price moves decisively through a defined support or resistance level, signaling a potential new trend. The mechanics: identify a consolidation pattern (rectangle, triangle, base formation), watch for price to break the boundary, and enter in the direction of the break.
The key rule for avoiding false breakouts is volume confirmation. A genuine breakout should be accompanied by above-average trading volume – ideally 100–200% above the 20-period average. Price breaking above resistance on thin volume is a warning sign. Waiting for a candle close above the breakout level (rather than entering mid-candle) and placing a stop-loss just below the breakout point keeps risk controlled when the break turns false.
How Do Trendlines Guide Entry and Exit Decisions?
Trendlines are diagonal lines drawn across chart highs or lows to visualize market direction. In an uptrend, a support trendline connects successive higher lows. In a downtrend, a resistance trendline connects successive lower highs. Price touching the trendline and bouncing provides a low-risk entry point with a natural stop-loss just below the line.
When price breaks through a trendline on high volume, it signals a potential trend change. A break above a downtrend resistance line can mark the start of a new uptrend. A break below an uptrend support line suggests bullish momentum has ended. Steeper trendlines indicate stronger trends but are also more vulnerable to sudden breaks.
How Is the Fibonacci Retracement Tool Used in Trend Following?
The Fibonacci retracement tool identifies potential pullback levels within an established trend. After identifying a trend’s high and low points, the tool plots horizontal lines at the key ratios: 23.6%, 38.2%, 50%, and 61.8%. These levels represent zones where price commonly pauses or reverses before continuing in the original direction.
The 38.2% and 61.8% levels attract the most attention. A cryptocurrency in a clear uptrend that pulls back to the 61.8% Fibonacci level often presents a higher-quality buying opportunity than chasing the initial breakout. The tool becomes more reliable when Fibonacci levels align with other indicators – a 50% retracement that coincides with a moving average and a prior support level carries more weight than an isolated Fibonacci level.
What Are the Advanced Trend Following Techniques?
How Does the Donchian Channel Strategy Work?
The Donchian Channel tracks the highest high and lowest low over a defined lookback period. Price breaking above the upper channel signals a new high – a potential trend entry. Price breaking below the lower channel signals a potential downtrend entry or exit signal for longs.
Research applying Donchian channel-based trend models to a survivorship bias-free crypto dataset covering assets since 2015 showed meaningful excess returns compared to a buy-and-hold benchmark. Using an ensemble of channels with different lookback periods, combined with volatility-based position sizing, the approach achieved a Sharpe ratio above 1.5 and annualized alpha of 10.8% versus Bitcoin across a rotational portfolio of the top 20 liquid coins – though backtested results don’t guarantee live performance.
Combining Donchian Channels with a moving average filter improves signal quality: price above its 200-day moving average AND breaking above the Donchian upper channel provides stronger confirmation than either signal alone.
How Does the Ichimoku Cloud Work for Crypto Trend Analysis?
The Ichimoku Cloud is a complete trend analysis system built from five lines calculated at different lookback periods. Its most visual component – the “cloud” formed by Senkou Span A and B – acts as dynamic support and resistance projected into the future. Price above the cloud indicates an uptrend; price below indicates a downtrend; price inside the cloud indicates consolidation.
The thickness and angle of the cloud signal trend strength: a wide, rising cloud signals strong bullish momentum, while a thin or flat cloud signals weakness. The Chikou Span (lagging line) adds confirmation – when it sits above the price candles from 26 periods ago, it confirms the current trend has historical backing. Many traders won’t enter a position without the Chikou Span confirming the direction suggested by the cloud.
How Should You Manage Risk When Trend Following?
Why Is Volatility-Based Position Sizing Important?
Crypto assets have very different volatility profiles. A highly volatile altcoin requires a smaller position than Bitcoin to risk the same dollar amount per trade. The Average True Range (ATR) indicator quantifies recent volatility and provides a basis for scaling positions accordingly. A standard approach: set your stop-loss at 2× the ATR below your entry price, then size the position so that hitting the stop costs no more than 1–2% of total capital. In high-volatility periods, positions get smaller automatically; in calmer periods, they can be larger.
How Do Trailing Stops Protect Trend Following Profits?
A trailing stop moves with price as the trade becomes profitable. Set initially below the entry to define maximum loss, it rises with price and locks in gains if the trend reverses. For trend followers, trailing stops solve a critical problem: how to let winners run without giving back all the gains in a reversal. A common approach is to trail at 2× ATR below the recent highest close, giving the trade enough room to breathe while protecting the bulk of gains from an extended trend.
What Are Drawdowns and How Do You Manage Them?
A drawdown is the decline in account value from a peak to a subsequent trough. In trend following, drawdowns are inevitable – no strategy wins every trade. The math works like this: a trader who limits each loss to 1% of capital and wins 40% of trades with an average win three times larger than the average loss grows their account over time, even while losing more trades than they win. Without position sizing controls, a single large loss can erase months of gains.
What Mistakes Do Trend Followers Make Most Often?
Overtrading tops the list. Trend following requires patience – waiting for clear, high-quality setups rather than forcing trades during ambiguous conditions. Traders who react to every small price movement generate transaction costs and take on risk without the structural edge that comes from a properly confirmed trend setup.
Ignoring market fundamentals is the second major error. Technical indicators show what price is doing; they don’t explain why. Regulatory announcements, network upgrades, exchange failures, and macroeconomic shifts can override technical signals instantly. The best trend followers track both charts and news.
FOMO – fear of missing out – causes traders to enter trends late, after a large portion of the move has already occurred. Late entries carry less favorable risk-reward ratios, and stop-losses must be placed further from the current price. Patient trend followers wait for retracements or new confirmation signals rather than chasing extended moves.
How Do You Build a Trend Following System That Works?
Building a functional trend following approach doesn’t require exotic tools. These steps will get you to a testable, executable strategy:
- Choose one timeframe and stay there. Mixing signals from multiple timeframes without a clear hierarchy creates confusion. Start with the daily chart and only drill into 4-hour charts for entry timing once you’ve confirmed the daily trend direction.
- Pick two complementary indicators. One trend-identification tool (like a 50/200-day SMA) and one momentum indicator (like MACD or RSI). Use these consistently rather than switching indicators after losing trades.
- Write down your entry rules precisely. Example: “I enter a long position when the 50-day SMA crosses above the 200-day SMA and MACD is above its signal line on the daily chart.” Vague rules produce inconsistent results.
- Define your stop-loss and trailing stop before entering any trade.Know exactly when you will exit before you enter. Adjust based on ATR, not gut feel.
- Paper trade for 30–50 setups before using real capital. This builds pattern recognition without financial risk and reveals whether your rules work in practice.
- Review your trades weekly.Track win rate, average win size, and average loss size. The math will tell you whether the strategy has an edge – don’t rely on subjective impressions.
The $86 trillion in 2026 crypto trading volume confirms that directional opportunities exist across timeframes and market conditions. Whether you capture them depends on preparation, patience, and consistent execution of a defined process rather than reacting to every headline.
UEEx Tip: UEEx provides advanced charting tools – including moving averages, MACD, RSI, and Ichimoku Cloud – directly in its trading interface. Practice identifying trend signals on UEEx’s demo account before applying them with real capital. Start with one indicator, master it, then layer in a second.
Frequently Asked Questions About Trend Following in Cryptocurrency
What is trend following in cryptocurrency?
Trend following is a strategy where traders buy during sustained price rises and sell or short during sustained price declines, aiming to capture the middle portion of directional moves. It relies on technical confirmation – typically from moving averages, MACD, or Ichimoku – rather than predictions about where price will ultimately go. The goal is to ride momentum that already exists, not to forecast it before it begins. As of Q1 2026, it remains one of the most practiced systematic approaches in crypto markets.
How do I identify a trend in cryptocurrency?
Start with higher timeframe charts – daily or weekly – and look for a consistent pattern of higher highs and higher lows (uptrend) or lower highs and lower lows (downtrend). Confirm with a moving average: if price is consistently above its 50-day or 200-day moving average, the trend is up. Adding a momentum indicator like MACD or RSI provides secondary confirmation. Two indicators pointing the same direction is more reliable than one alone, and three-timeframe alignment – weekly, daily, 4-hour – adds even stronger conviction.
What are the risks of trend following in crypto?
The primary risk is false signals – apparent trends that reverse quickly after you enter. Crypto’s volatility produces more false breakouts than traditional markets, making stop-loss orders the essential defense. A second risk is extended sideways market periods where no clear trend exists; during these phases, a trend follower may absorb a series of small losses while waiting for genuine directional movement to return. Proper position sizing and a maximum weekly loss limit keeps these periods manageable.
Does trend following work in bear markets?
Trend following works in both bull and bear markets because the strategy is direction-agnostic. In a bear market, trend followers take short positions or exit longs, profiting from sustained price declines. The 2022 crypto bear market, during which Bitcoin fell from near $69,000 to below $16,000, presented sustained downtrend signals for months. The requirement is a sustained directional move – the strategy struggles only in sideways, choppy markets regardless of whether prices are elevated or depressed.
How long should I hold a trend following position?
Hold duration depends on your timeframe and the type of trend you’re trading. Short-term trend followers using 4-hour charts may hold for one to five days. Swing traders using daily charts often hold for two to six weeks. Position traders using weekly charts can hold for months. The correct exit signal is not a calendar date – it’s the technical invalidation of the trend: a moving average crossover in the wrong direction, a trendline break, or a trailing stop trigger. Exiting based on arbitrary time limits rather than trend signals is one of the most common trend following mistakes.
Which is better for trend following – SMA or EMA?
Neither is universally better; each has a specific advantage. The SMA updates more slowly, generating fewer signals and reducing whipsaws in volatile markets – better for longer-term trend identification. The EMA reacts faster to recent price changes, useful in fast-moving crypto markets where trends can accelerate quickly. Many experienced traders use both: EMA for entry timing and SMA for overall trend direction. Testing both on your specific asset and timeframe is the only way to determine which performs better in your strategy.