Have you ever felt lost staring at crypto charts? You’re not alone. The volatility and extreme market swings of crypto lines leave even seasoned investors scratching their heads. This is where Moving Average Convergence Divergence (MACD) for crypto comes in.
Basically, MACD helps you spot changes in the strength, direction, momentum, and duration of a trend in a cryptocurrency’s price.
Key Takeaways
- MACD (Moving Average Convergence Divergence) is a powerful tool for analyzing crypto trends, offering insights into trend direction, momentum, and potential reversals.
- With MACD signals like crossovers, divergences, and histogram patterns, you can make informed decisions about when to enter or exit crypto positions.
- Effective risk management is essential when using MACD, including position sizing, setting stop-loss orders, and managing profit targets to protect capital and maximize returns.
- Using MACD along with other indicators like moving averages, RSI, and Bollinger Bands can improve analysis and give stronger trading signals, leading to better success in cryptocurrency trading.
“Over 420 million people worldwide now own cryptocurrency, a growth of over 100 million in just the past year.”
What is MACD?

Moving Average Convergence Divergence (MACD), is a popular technical analysis indicator used by traders to identify potential changes in the direction, strength, momentum, and duration of a trend in a cryptocurrency’s price.
Developed by Gerald Appel in 1979, MaCD is like a three-part technical analysis tool designed specifically for your crypto trading journey. Here’s how it breaks down:
- MACD Line This line reflects the short-term momentum of a crypto’s price. It’s calculated by subtracting a 12-period Exponential Moving Average (EMA) from a 26-period EMA. It represents the trend’s strength and direction.
- Signal Line: It’s a 9-period EMA of the MACD line, acting as a filter for short-term fluctuations and highlighting the underlying trend. The signal line is a moving average of the MACD line.
- MACD Histogram: This is where things get exciting. The histogram plots the difference between the MACD line and the signal line. Expanding bars indicate growing momentum, while shrinking bars show it’s fizzling out.
How to Calculate MACD
The MACD is calculated by subtracting the long-term EMA from the short-term EMA. The signal line is then derived from the MACD line by calculating its moving average. The histogram is the difference between the MACD line and the signal line.
Expressed as a formula, you have:
MACD = Short-term EMA − Long-term EMA
Signal Line = Moving Average of MACD Line
Histogram = MACD line – Signal line
Most trading platforms automate these calculations, simplifying the process for traders.
Also Read: 5 Best Crypto Screeners in 2026
Importance of MACD (Moving Average Convergence Divergence) for Crypto trading
MACD takes the language of crypto charts and turns it into actionable insights. Here’s why it is important for crypto trading:
- Identifying Trends: By analyzing the direction and position of the MACD line relative to the signal line, you can check whether a crypto is in an uptrend, downtrend, or consolidating.
- Spotting Momentum Shifts: The MACD histogram helps you identify when the buying or selling pressure is building up, potentially leading to price breakouts or reversals.
- Making Informed Decisions: With a clearer understanding of trends and momentum, you can make more strategic choices about entering or exiting crypto positions.
How MACD Works

Interpreting the MACD line, signal line, and histogram in relation to price movement is crucial. When the MACD line crosses above the signal line, it generates a bullish signal, suggesting a potential upward trend. Conversely, when the MACD line crosses below the signal line, it indicates a bearish signal, signaling a potential downward trend.
Types of MACD
There are various types of MACD settings used by traders:
- Traditional MACD: This uses default settings, typically 12, 26, and 9 periods for short-term EMA, long-term EMA, and signal line respectively.
- Modified MACD: Traders may adjust the periods of the EMA to suit their trading style and preferences.
- Custom MACD Settings: Some traders develop their own MACD settings based on specific market conditions or strategies.
“Investment firms allocated a staggering $30 billion to cryptocurrency funds in the first quarter of 2024 alone, reflecting growing institutional interest.”
Setting Up MACD (Moving Average Convergence Divergence) for Crypto Trading
MACD is a tool, and like any tool, using it effectively requires proper setup.
Choosing the Right Time Frame
When using MACD (Moving Average Convergence Divergence) for crypto analysis, selecting the appropriate time frame is crucial.
Importance of time frame selection for MACD analysis.
Different timeframes reveal different aspects of price movements. Shorter timeframes (e.g., 5 minutes, 1 hour) provide more granular data, while longer timeframes (e.g., daily, weekly) offer a broader perspective.
Day traders may focus on shorter timeframes to catch intraday trends, while swing traders might prefer longer timeframes to capture larger price movements.
Timeframes for different trading strategies
- Day Trading: For day trading, consider using shorter timeframes (e.g., 15 minutes, 1 hour). These allow you to react quickly to short-term price changes.
- Swing Trading: Swing traders often analyze daily or weekly charts. These timeframes help identify medium-term trends and potential reversals.
Also Read: What Is a Block Trade and How Does It Work?
Selecting Appropriate Parameters
The MACD indicator consists of three components: the MACD line, the signal line, and the histogram. Here’s how to choose the right parameters:
Fast and Slow EMA Periods
The MACD line is calculated by subtracting the exponential moving average (EMA) of a shorter period from the EMA of a longer period. Common choices for EMA periods are 12 (fast) and 26 (slow). Adjust these based on your trading style and the crypto asset you’re analyzing.
Signal line period and its impact on signal generation
The signal line (often a 9-period EMA of the MACD line) generates buy/sell signals.
A shorter signal line period (e.g., 6) provides more frequent signals but may be noisy.
A longer period (e.g., 12) gives smoother signals. Experiment to find what works best for your trading strategy.
Adjusting parameters for volatile crypto markets
Cryptocurrencies can be highly volatile. Consider shorter EMA periods and a shorter signal line period during extreme market conditions. Be cautious not to over-optimize; too many adjustments can lead to curve-fitting.
“The total value locked (TVL) in DeFi protocols surpassed $200 billion in May 2024, showcasing the potential of blockchain-based financial applications.”
Interpreting MACD Signals
Now that you’ve got MACD set up, it’s time to learn how to read the signals it generates. Remember, using MACD (Moving Average Convergence Divergence) for crypto trading isn’t a guarantee, but it can provide valuable clues about potential buying and selling opportunities in the crypto market.
Identifying Buy Signals
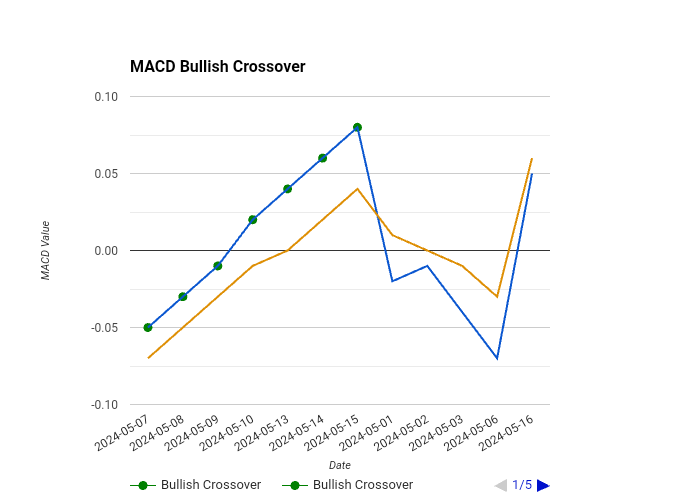
MACD Crossovers
- A buy signal occurs when the MACD line crosses above the signal line. This suggests that the short-term trend is turning bullish.
- Traders often consider this crossover as a potential entry point for long positions.
- Keep in mind that false signals can occur during choppy or sideways markets, so additional confirmation is important.
Bullish Divergence
- Bullish divergence occurs when the price of the cryptocurrency makes lower lows, but the MACD forms higher lows.
- This divergence suggests that the selling pressure is weakening, and a potential trend reversal to the upside may be imminent.
- Confirm bullish divergence with other technical indicators or price patterns.
Identifying Sell Signals
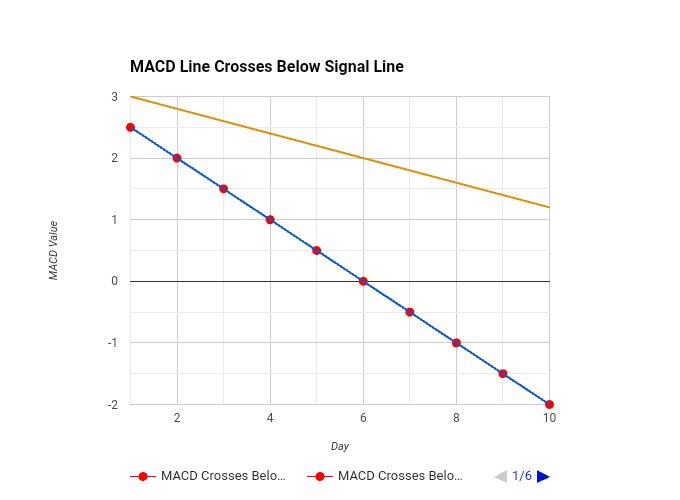
MACD Crossovers
- A sell signal occurs when the MACD line crosses below the signal line. This indicates a potential shift from bullish to bearish momentum.
- Traders often use this crossover as a signal to exit long positions or consider short positions.
- As with buy signals, false sell signals can happen, especially in volatile markets.
Bearish Divergence
- Bearish divergence occurs when the price of the crypto asset makes higher highs, but the MACD forms lower highs.
- This divergence suggests that the buying pressure is weakening, and a potential trend reversal to the downside may be approaching.
- Always seek confirmation from other indicators or price action.
Using Histogram to Confirm Signals
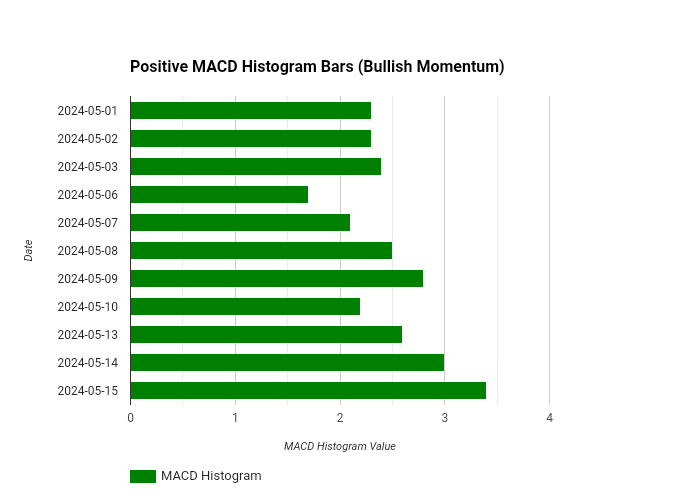
Histogram Bar Patterns
- The histogram represents the difference between the MACD line and the signal line.
- Tall bars indicate strong momentum (either bullish or bearish), while short bars suggest weaker momentum.
- Positive histogram bars (above the zero line) indicate bullish momentum, and negative bars (below the zero line) indicate bearish momentum.
Confirming Strength of Trends
- When the histogram bars increase in height, it confirms the strength of the trend suggested by MACD crossovers.
- For example, if the MACD line crosses above the signal line, and the histogram bars become taller, it reinforces the bullish signal.
Conversely, decreasing histogram bars may signal weakening momentum.
“Over 4,600 merchants worldwide now accept cryptocurrency payments, demonstrating a growing trend in mainstream adoption.”
Advanced MACD Trading Strategies
These advanced MACD (Moving Average Convergence Divergence) for crypto trading strategies, when combined with other indicators, will produce optimal results.
Moving Average Convergence Divergence Crossover Strategy
This is a straightforward trading method used to spot buy and sell signals.
MACD Crossover strategy helps traders identify changes in market trends and make informed trading decisions.
Entry and Exit Rules
Buy Signal (Bullish):
- Wait for the MACD line to cross above the signal line (MACD crossover).
- Confirm with other indicators or price patterns.
- Enter a long position when the crossover occurs.
Sell Signal (Bearish):
- Wait for the MACD line to cross below the signal line (bearish crossover).
- Consider exiting long positions or even opening short positions.
- Use additional confirmation to avoid false signals.
Setting Stop-Loss and Take-Profit Levels
Stop-Loss:
- Set a stop-loss order below the recent swing low (for long positions) or above the recent swing high (for short positions).
- This protects you from significant losses if the trade goes against you.
Take-Profit:
- Set a take-profit order at a reasonable target level based on your analysis (e.g., previous resistance levels, Fibonacci extensions, or trend channels).
- Lock in profits when the price reaches your desired level.
Moving Average Convergence Divergence Strategy
MACD divergence strategy is a common trading approach that helps identify potential trend reversals.
It involves comparing the MACD indicator with the price movement of an asset. This strategy helps traders anticipate changes in market direction.
Spotting Divergence Signals
Bullish Divergence:
- Observe when the price makes lower lows, but the MACD forms higher lows.
- This suggests weakening selling pressure and a potential trend reversal.
- Consider going long or tightening stop-loss levels.
Bearish Divergence:
- Look for higher highs in price while the MACD forms lower highs.
- Indicates weakening buying pressure and a potential trend reversal to the downside.
- Consider exiting long positions or even shorting.
Implementing Divergence Strategies
- Combine divergence signals with other technical tools (e.g., RSI, trendlines) for confirmation.
- Be patient; divergence signals may take time to play out.
- Avoid overtrading; focus on quality signals.
Also Read: Gann Indicators Explained: Your Guide to Profitable Trading Strategies
Moving Average Convergence Divergence Histogram Strategy
MACD histogram strategy is a simple and popular trading method. It uses the Moving Average Convergence Divergence (MACD) indicator to find buy and sell signals.
Utilizing Histogram Peaks and Troughs
Buy Signals:
- Look for tall histogram bars (above the zero line) after a bullish crossover.
- Indicates strong bullish momentum.
- Consider entering or adding to long positions.
Sell Signals:
- Short histogram bars (below the zero line) after a bearish crossover suggest bearish momentum.
- Consider exiting long positions or even shorting.
- Use additional confirmation.
Incorporating Histogram Analysis
- Pay attention to the histogram’s trend (rising or falling).
- Combine histogram analysis with other MACD signals.
- Adjust your trading decisions based on the histogram’s behavior.
“The market capitalization of stablecoins, cryptocurrencies pegged to fiat currencies, surpassed $2 trillion in May 2024, signifying their role in facilitating crypto transactions .”
Risk Management with Moving Average Convergence Divergence
MACD is a powerful tool, but like any tool, it needs to be wielded responsibly.
Position Sizing
When trading cryptocurrencies, it’s crucial to manage your risk effectively. Position sizing refers to determining the appropriate amount of capital to allocate to a specific trade based on your risk tolerance.
Here’s how you can calculate position size:
Risk Tolerance
Assess how much you’re willing to risk on a single trade. This is usually expressed as a percentage of your total trading capital.
For example, if your risk tolerance is 2%, and your total capital is $10,000, your maximum risk per trade would be $200 (2% of $10,000).
Stop-Loss Placement
Use MACD signals to set your stop-loss level. When the MACD line crosses below the signal line, it may indicate a potential downtrend.
Place your stop-loss order slightly below a significant support level or the recent swing low. Adjust the stop-loss level as the trade progresses based on MACD signals.
Position Size Calculation
Divide your maximum risk per trade (in dollars) by the difference between your entry price and stop-loss price. This gives you the number of units (coins) you can buy. For instance:
Entry Price: $500
Stop-Loss Price: $480
Maximum Risk: $200
Position Size = $200 / ($500 – $480) = 4 units
Setting Stop-Loss Orders
Stop-loss orders are crucial for protecting your capital. Based on MACD signals, consider the following when setting stop-loss levels:
MACD Crossovers
When the MACD line crosses below the signal line, it suggests a potential downtrend. Set your stop-loss order below key support levels or recent swing lows.
Volatility Consideration
Adjust your stop-loss placement based on the volatility of the cryptocurrency. More volatile assets may require wider stop-loss levels.
Trailing Stop-Loss
Consider using a trailing stop-loss strategy. As the price moves in your favor, adjust the stop-loss level to lock in profits.
Trailing stop-loss orders follow the price at a fixed distance (e.g., 5% below the highest price reached).
Managing Profit Targets
While MACD helps with risk management, it’s also essential for setting realistic profit targets.
MACD Histogram
Pay attention to the MACD histogram. A positive histogram indicates bullish momentum. Consider taking partial profits when the histogram starts declining, suggesting a potential trend reversal.
Price Targets
Use MACD signals to identify potential price targets. Look for resistance levels or previous highs where the price might encounter selling pressure.
Consider taking profits near these levels.
Letting Winners Run
While taking partial profits is prudent, don’t exit the entire position too early. If the trend remains strong, consider trailing your profit target higher to capture more gains.
“The play-to-earn gaming sector, where players can earn crypto rewards, has garnered over 1 million daily active users, showcasing the potential of blockchain gaming.”
Backtesting and Optimization
Before risking real capital, it’s crucial to test your MACD-based strategies on historical data. This process, called backtesting, is like building a time machine for your trades.
Importance of Backtesting
Historical Performance Assessment
Backtesting allows you to simulate how a particular trading strategy would have performed in the past using historical price data.
By applying your chosen strategy to historical data, you gain insights into its effectiveness.
Validation and Confidence
Backtesting validates whether your approach would have generated profits or losses under real-world conditions. It builds confidence in your strategy by demonstrating its viability over time.
Identifying Strengths and Weaknesses
Through backtesting, you can identify the strengths and weaknesses of your MACD-based approach.
Did it capture trends effectively? Did it miss out on profitable opportunities? Analyzing these aspects helps refine your strategy.
Optimization Techniques
While the default MACD parameters (typically 12, 26, and 9) work reasonably well, fine-tuning these parameters can potentially enhance performance. Here’s what you need to know:
Fine-Tuning Parameters
Experiment with different values for the fast and slow moving averages (usually the 12-period and 26-period EMA) and the signal line (often the 9-period EMA).
Adjusting these parameters can optimize your strategy for specific market conditions.
Visual Inspection
Visually inspect the MACD indicator on historical charts. Look for instances where it provided accurate signals (crossovers) and where it failed. Adjust the parameters accordingly to improve accuracy.
Avoid Overfitting
Be cautious not to over-optimize your strategy. Overfitting occurs when you tailor your parameters too closely to historical data, making the strategy perform well only in the past but poorly in the future.
Use out-of-sample data to validate any parameter changes.
“The Security Token Offerings market is projected to reach $8.1 billion by 2024, showcasing the potential for blockchain technology to revolutionize traditional capital markets.”
Limitations of MACD (Moving Average Convergence Divergence) for Crypto
MACD, like any tool, has limitations. While it offers valuable insights, it also has shortcomings to avoid while making trading decisions.
Prone to False Signals
MACD generates buy and sell signals based on crossovers and divergences. However, these signals aren’t guaranteed predictions of future price movements.
Especially during volatile market conditions or periods of consolidation (where the price moves sideways), MACD can generate false signals.
These false signals can lead traders to make losing trades if they’re not careful.
Lacks Predictive Power
MACD is a lagging indicator. It relies on historical price data to calculate its moving averages and generate signals.
This means it reflects what has already happened in the market, rather than predicting what will happen next. While it can identify trends and potential reversals, it doesn’t guarantee future price movements.
Volatility Struggle
Cryptocurrency markets are known for being volatile. During periods of high volatility, the MACD lines can fluctuate erratically, making it challenging to interpret the signals.
These erratic movements can generate more false signals and make it difficult to identify true trends.
Finding the Right Settings
Moving Average Convergence Divergence utilizes multiple parameters for its moving averages and signal line. While there are standard settings (12, 26, 9), traders can adjust these parameters to suit their trading style and the specific cryptocurrency.
However, there’s no single “golden setting” for the Moving Average Convergence Divergence.
Optimizing these parameters can be time-consuming, and even then, it won’t eliminate false signals entirely. Over-optimizing can lead to curve-fitting, where the settings appear effective on historical data but fail in real-time trading.
“The number of verified cryptocurrency users on centralized exchanges has surpassed 500 million, indicating a surge in active trading.”
MACD vs RSI
Moving Average Convergence Divergence and Relative Strength Index are two popular technical indicators that serve different purposes but can be valuable tools for traders and investors.
| Aspect | Moving Average Convergence Divergence | Relative Strength Index |
| Type | Trend-following oscillator | Momentum oscillator |
| Calculation | Compares two moving averages | Compares average gains to average losses |
| Components | MACD line, signal line, histogram | Single line (oscillates between 0-100) |
| Interpretation | Crossovers, divergences, histogram bars | Overbought (>70) and oversold (<30) levels, divergence |
| Signals | Crossovers, divergences, histogram patterns | Overbought and oversold levels, divergence |
| Trend Strength | Measures the strength and direction of a trend | Measures the speed and change of price movements |
| Timeframe Sensitivity | Suitable for various timeframes | More responsive in shorter timeframes |
| Usage | Identifying trend changes, confirming trends | Identifying overbought and oversold conditions, potential trend reversals |
Integrating MACD with Other Indicators
Combining other technical indicators with Moving Average Convergence Divergence for crypto trading, can strengthen your analysis and provide more well-rounded trading signals.
It can be combined with Moving Averages, RSI, Bollinger Bands and so on.
Moving Averages (SMAs and EMAs)
Moving averages (MAs) smooth out price data by calculating the average over a specified number of periods.
Combining Moving Average Convergence Divergence with Moving Averages provides additional confirmation of trend direction and potential reversals.
Types of Moving Averages
- Simple Moving Average (SMA): The average of closing prices over a specific period (e.g., 50-day SMA).
- Exponential Moving Average (EMA): Similar to SMA but gives more weight to recent prices.
When the Moving Average Convergence Divergence line crosses above the EMA or SMA, it reinforces a bullish signal. Conversely, when the MACD crosses below the EMA or SMA, it confirms a bearish signal.
Also Read: Cryptocurrency High-frequency Trading Tactics For Every Trader
Relative Strength Index (RSI)
RSI measures the strength and speed of price movements. It oscillates between 0 and 100.
Using RSI to confirm MACD signals, if MACD shows a bearish crossover and RSI is above 70, it strengthens the bearish signal.
If MACD shows a bullish crossover and RSI is below 30, it reinforces the bullish signal.
You can also look for divergence between RSI and MACD. When RSI makes higher lows while MACD makes lower lows, it suggests potential trend reversal upward.
Also, when RSI makes lower highs while MACD makes higher highs, it indicates potential trend reversal downward.
Bollinger Band
They consist of three lines:
- Middle Band (SMA): Represents the average price.
- Upper Band: Calculated as the middle band + (2 × standard deviation of prices).
- Lower Band: Calculated as the middle band – (2 × standard deviation of prices).
Bollinger band expand during high volatility and contract during low volatility.
When the MACD shows a bullish crossover and the price is near the lower Bollinger Band, it suggests a potential buying opportunity.
Conversely, when the MACD shows a bearish crossover and the price is near the upper Bollinger Band, it reinforces a potential selling opportunity.
“Venture capitalists invested a record $33 billion into blockchain startups in the first half of 2024, highlighting the growing confidence in the technology’s potential.”
Frequently Asked Questions
What is the best timeframe to use with MACD?
The best time frame depends on your trading strategy. Shorter timeframes like 1-hour or 4-hour charts are suitable for day trading, while longer time frames such as daily or weekly charts are better for swing trading.
How do I know when to buy or sell using MACD?
Look for MACD line crossovers above the signal line for buy signals and below the signal line for sell signals. Additionally, bullish or bearish divergences between MACD and price can confirm buy or sell signals, respectively.
Can MACD be used alone for trading decisions?
While MACD provides valuable insights, it’s often used in combination with other technical indicators or fundamental analysis for more reliable trading decisions.