

You buy the breakout. The candle turns red. You panic-sell the bottom. Weeks later the chart is exactly where you feared it was going, except you are no longer on board.
If that sounds familiar, you are not making random mistakes. You are being played by a pattern that has operated in every market since the 1930s.
Richard Wyckoff spent decades watching the big operators work, codified exactly what they do, and handed the playbook to anyone willing to read it.
This is that playbook, updated for the realities of 2026 crypto markets.
Related Reads: Crypto Remittances: Your Bank is Charging You 6.49% to Send Your Own Money, A Simple Guide to Elliott Wave Theory.
What Is the Wyckoff Method and Why Does It Still Work in 2026?
The Wyckoff Method is a technical analysis framework developed by Richard D. Wyckoff in the 1930s.
It explains how large institutional operators, the Composite Man, systematically accumulate or distribute assets in predictable phases, leaving readable footprints in price action and volume that retail traders can identify and trade alongside.
Richard Wyckoff started on Wall Street at age 15. By the time he founded the Magazine of Wall Street and later the Stock Market Institute, he had watched legends like J.P.
Morgan and Jesse Livermore operate up close. What he saw was not random. Large operators needed time and range to build positions without moving the market against themselves.
That requirement of time and range creates structure that any trained eye can see.
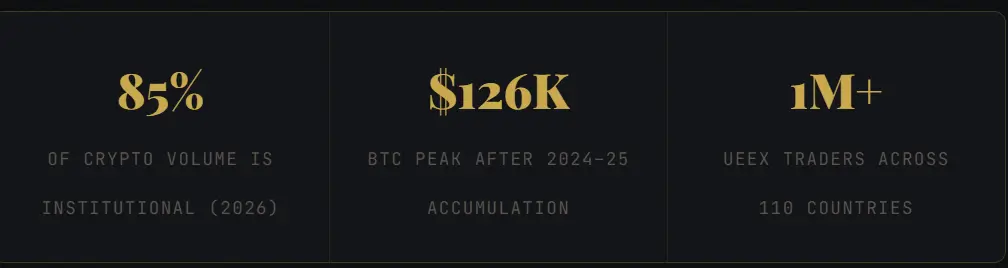
Fast-forward to 2026 and the numbers actually make Wyckoff analysis more powerful, not less. Institutional participation now accounts for roughly 70 to 85 percent of total crypto market volume.
Spot Bitcoin ETFs, sovereign wealth funds, corporate treasury desks, and high-frequency quantitative funds dominate the order book.
Their accumulation and distribution phases are longer, deeper, and more technically clean than ever because the players are bigger.
Read Also: A Comprehensive Guide to Harmonic Patterns in Crypto Trading
What Are the Three Laws That Govern the Wyckoff Method?
1. Law of Supply and Demand.
Prices rise when demand exceeds supply and fall when supply exceeds demand. When they are balanced, price consolidates in a range.
This is not complex economics, it is the mechanical reason accumulation and distribution ranges exist.
Smart money cannot buy enormous positions without absorbing supply, and cannot sell without supplying demand. The range is the battlefield.
2. Law of Cause and Effect
Every significant price move (the effect) has a preceding period of preparation (the cause). The wider and longer the trading range, the more powerful the resulting trend.
Wyckoff used Point-and-Figure charts to measure the horizontal cause and project potential price targets.
A shallow two-week consolidation produces a modest 10 to 15 percent move. A multi-month accumulation range like Bitcoin’s 2022 base can produce a multi-hundred-percent markup.
3. Law of Effort versus Result
Volume is effort. Price movement is result. When they harmonise, high volume with large price movement in the direction of the trend, the trend is healthy.
When they diverge, high volume with little price progress, institutions are quietly absorbing the opposite side of the trade.
A Bitcoin bar showing massive sell volume with a tiny downward close signals that powerful buyers are absorbing every sell order.
That is the tell of an institutional Selling Climax.In crypto, Wyckoff’s rules show you when to buy and sell.
What Are the Five Phases of Wyckoff Accumulation?
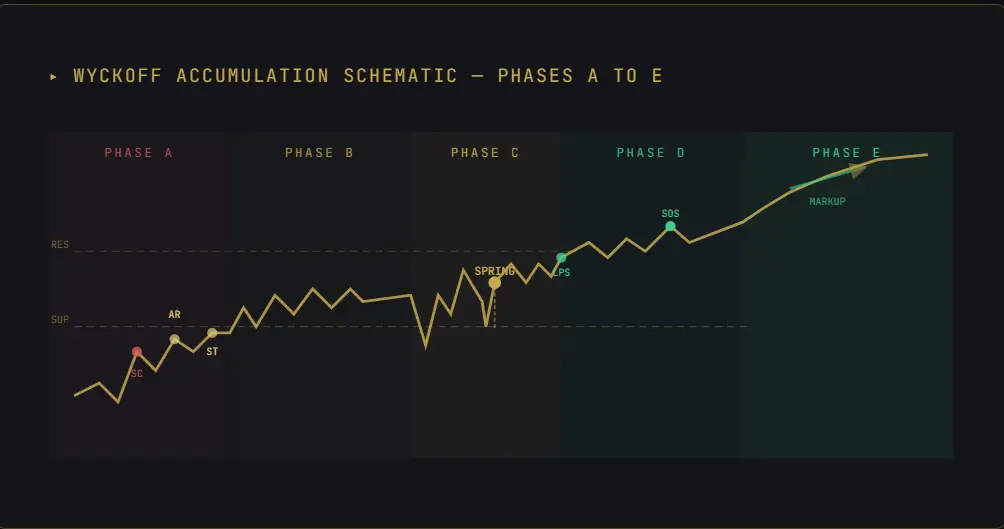
Phase A: Stopping the Downtrend
A Selling Climax (SC) on high volume absorbs panic sellers. The Automatic Rally (AR) follows, then the Secondary Test (ST) establishes the trading range boundaries.
This is where many retail traders start capitulating.
Phase B: Building the Cause
The longest, most frustrating phase. Price churns sideways. Institutions are quietly accumulating, absorbing all available supply.
Volume gradually decreases as the float tightens. Retail traders call this dead market.
Phase C: The Spring (The Trap)
The most critical event. Price briefly breaks below range support, triggering stop losses and convincing weak hands to sell, then snaps back above it.
When confirmed with a volume spike and bullish close, this is the highest-probability entry signal in the entire schematic.
Phase D: Early Markup
Signs of Strength (SOS) appear as price pushes to the top of the range on increasing volume.
Last Points of Support (LPS) form higher lows. Each pullback is shallow and low-volume, a signal that supply has been absorbed.
Phase E: Full Markup Breakout
Price exits the accumulation range on high volume.
The trend is confirmed. Institutions have their full position and the markup begins in earnest. Retail FOMO buyers arrive at the party late exactly when smart money wants them.
What Is Wyckoff Distribution and How Does It Differ from Accumulation?
Wyckoff distribution is the mirror image of accumulation. It occurs after an uptrend when institutional operators begin selling their holdings to retail buyers at inflated prices.
The range includes a Buying Climax, Automatic Reaction, Secondary Test, and the UTAD (Upthrust After Distribution),a false breakout above resistance that traps breakout buyers before the real markdown begins.
Here is the sequence institutions follow to exit large positions without crashing the price themselves.
1. Preliminary Supply (PSY).
The first visible sign that the uptrend is running out of steam. Volume spikes on up bars that fail to close at their highs. Big sellers are testing the market’s capacity to absorb their offers.
2. Buying Climax (BC)
A parabolic move higher on massive volume. Retail traders are euphoric. Institutional operators are quietly selling into every bid.
This is often the highest volume bar of the entire cycle and coincides with maximum media coverage and public excitement.
3. Automatic Reaction (AR)
The first sharp decline from the Buying Climax. It establishes the lower boundary of the distribution range and reveals that buyers are no longer powerful enough to sustain the prior trend.
4. Secondary Test (ST) and UTAD
The Secondary Test revisits the Buying Climax zone on lower volume confirming demand is genuinely weakening.
The UTAD is the cruel-est move in the schematic: a breakout above the BC that triggers breakout buying orders from retail traders just before the markdown accelerates downward.
5. Sign of Weakness (SOW) and Last Point of Supply (LPSY)
Price breaks below range support on heavy selling volume.
Any subsequent rally is shallow, low-volume, and resolves lower. This is the last opportunity to exit longs before the markdown takes full control.
Who Is the Composite Man and Why Should Crypto Traders Care?
The Composite Man is Wyckoff’s conceptual metaphor for the aggregate behaviour of all large institutional market participants operating as a single entity with a coherent plan.
Wyckoff was not describing a conspiracy. He was describing market mechanics.
When you have a whale holding 1 percent of Bitcoin’s circulating supply who needs to exit, their selling creates a pattern regardless of intent.
When a sovereign wealth fund is quietly accumulating Ethereum, their buying absorbs sell pressure in a way that is structurally visible to anyone reading volume correctly.
The Composite Man operates through several identifiable channels: spot Bitcoin ETF arbitrage desks, institutional perpetuals traders using Layer-2 scaling rails for low-slippage execution, and on-chain whale wallets that show up clearly in blockchain analytics.
What Is Wyckoff’s Five-Step Approach to Selecting Crypto Trades?
Wyckoff’s five-step trading approach involves:
1. Determine the market’s current position and probable future direction.
Is Bitcoin in accumulation, markup, distribution, or markdown? Every altcoin trade should be assessed relative to where BTC sits in its cycle.
Trading a long in an altcoin during a Bitcoin distribution phase is swimming against the tide.
2. Select assets in harmony with the trend.
During a markup phase, focus on assets showing relative strength, those making higher lows while BTC consolidates, or breaking range resistance while the rest of the market churns.
Wyckoff called this selecting the leaders.
3. Identify assets with a sufficient cause for the objective
Use the horizontal width of the trading range as a proxy for the magnitude of the coming move.
A range that is twenty weeks wide at a meaningful price level will produce a larger markup than one that is three weeks wide. Smaller cause, smaller effect.
4. Confirm the asset is ready to move
Check for Springs completed, Last Points of Support holding on declining volume, and a Sign of Strength already printed. Do not enter a Phase B range hoping for Phase C. Wait for the evidence.
5. Time the entry to a market turning point
Even the perfect individual setup requires macro alignment. If the broad crypto market is on a Sign of Weakness, even the strongest accumulation candidate will struggle to break out.
Patience at this step is where most retail losses are avoided.
How UEEX Products Map to Each Wyckoff Phase
Here is how to align your tools with your market reading.
Phase B — Spot Trading
Accumulate small spot positions with wide stops during range-building. Low leverage, high patience. UEEX’s deep liquidity ensures minimal slippage on limit orders.
Phase C — Spot + Low Futures
Add to spot at the Spring confirmation. Use a small Futures position with a tight stop below the Spring low for defined-risk exposure to the first move.
Phase D — Futures (Trending)
Signs of Strength breakouts are ideal for UEEX Futures at 5 to 20x leverage.
The structure gives clear stop placement at the LPS with defined upside targets from the P&F count.
Phase E — Futures or Copy Trading
Full markup momentum trades. Use UEEX Copy Trading to follow experienced traders whose live positions align with Phase E breakout setups in real time.
Distribution — Shorts via Futures
UTAD and SOW signals are textbook short setups on UEEX Futures. The defined resistance levels give clean entry zones with precise stop placements above the UTAD high.
All Phases — UEEX Asset Vault
Hold core long-term positions in UEEX’s Independent
Asset Vault during markup phases while trading shorter-term Wyckoff setups with your active capital.
What Are the Most Common Wyckoff Mistakes That Cause Traders to Lose Money?
The four most damaging Wyckoff mistakes are: entering Phase B ranges too early (before the Spring confirms), treating every dip in a range as the Spring, ignoring the broader market cycle when reading individual assets, and abandoning the framework during Phase B’s extended sideways churn which is exactly when discipline is most required.
Read Also: Mastering Cryptocurrency Breakout Analysis: Expert Tips and Tricks
Frequently Asked Questions
Does the Wyckoff Method work for altcoins, not just Bitcoin?
Yes, but with an important qualifier. Altcoins with sufficient liquidity and trading volume will show clear Wyckoff structures because institutional market makers operate in those markets.
What timeframe is best for Wyckoff analysis in crypto?
Major Wyckoff structures on Bitcoin and large-cap assets are most reliable on the daily and weekly charts for accumulation and distribution ranges.
Phase C Spring signals and Phase D Signs of Strength can be confirmed on the 4-hour chart for more precise entries. Anything below the 1-hour chart introduces too much noise to read institutional intent reliably.
Put Your Wyckoff Analysis to Work on UEEX
You have the framework. UEEX gives you the execution. Trade Spot markets for accumulation phase entries, Futures with up to 125x leverage for Phase D breakouts, and Copy Trading to follow experienced practitioners in real time. Over 1 million traders in 110 countries already call UEEX home.


