You’ve watched a perfectly set-up trade reverse the moment you hit buy.
The candlesticks looked right. The trend looked right. But what looked right and what the market was actually about to do were two completely different things.
That gap, between guessing and knowing, is exactly where harmonic patterns live. They won’t give you certainty. No tool does.
But they will give you a mathematical framework so precise that your entries, stops, and profit targets stop being opinions and start being coordinates.
This guide covers every major harmonic patterns in crypto trading, the exact Fibonacci ratios that define them, how to execute against a Potential Reversal Zone (PRZ).
Harmonic patterns are geometric price formations built from precise Fibonacci retracement and extension ratios across five pivot points (X, A, B, C, D).
They identify high-probability reversal zones (PRZs) where multiple Fibonacci levels cluster.
In crypto, they work because market participants share the same psychological anchors, which repeat across every liquid asset and timeframe.
The concept traces back to Harold Gartley, who described a repeating five-wave structure in his 1935 book Profits in the Stock Market.
Scott Carney expanded this into a full methodology in the 1990s and 2000s, introducing the Bat, Crab, and Shark patterns and formalizing the Potential Reversal Zone as a trading concept.
Join UEEx
Experience the World’s Leading Digital Wealth Management Platform
Cryptocurrencies, unlike traditional equities, trade 24 hours a day, seven days a week, across global liquidity pools.
That continuous price action produces cleaner harmonic geometry than many traditional markets because there are no forced opens or closes to disrupt the wave structure.
Bitcoin’s run past $126,000 in 2025 generated textbook Butterfly and Crab completions at multiple timeframes, which trained traders exploited for high-conviction entries.
How Do Fibonacci Ratios Power Harmonic Analysis?
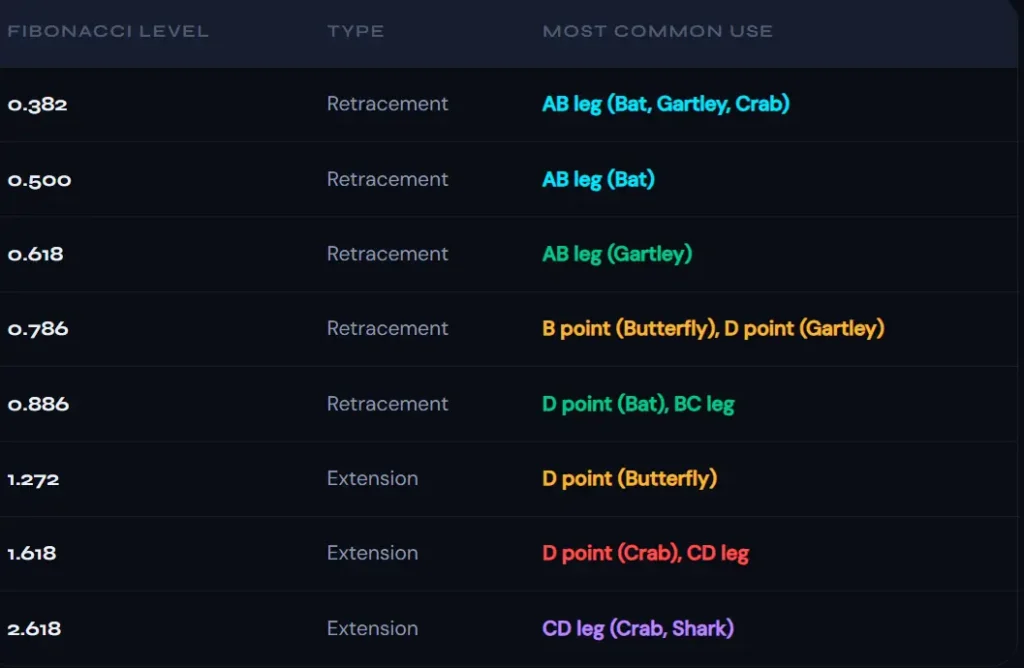
Fibonacci ratios (0.382, 0.500, 0.618, 0.786, 0.886, 1.272, 1.618, 2.618) are the building blocks of every harmonic pattern.
Each leg of an XABCD structure must hit a specific ratio within a defined tolerance of roughly plus or minus three percentage points for the pattern to be valid. A miss on any single leg invalidates the setup.
The ratios themselves are derived from the Fibonacci sequence, where 0.618 equals 34 divided by 55, and 0.786 is the square root of 0.618.
These numbers appear with stunning regularity in natural growth patterns, and market prices, driven by human behavior, mirror them.
Here is how each ratio is used in practice:
Kindy note: the tighter the ratio alignment, the stronger the signal. A Gartley where point D lands exactly at 0.786 of XA carries more conviction than one where D arrives at 0.77 or 0.80. Precision is the edge.
6 Core Harmonic Patterns Every Crypto Trader Should Know
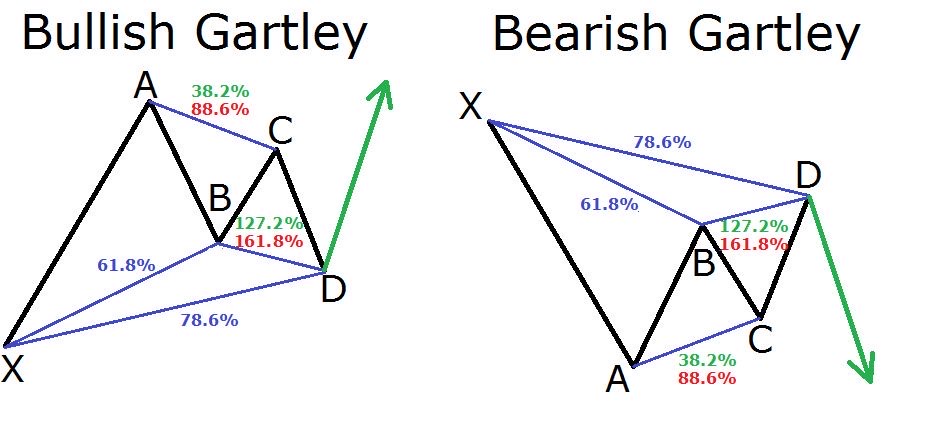
1. The Gartley Pattern
The original harmonic, dating to 1935. Point D lands at a 0.786 retracement of XA, making it one of the shallower D completions.
The Gartley looks like an M (bullish) or W (bearish) on the chart. It is favored for its relatively high win rate when all ratios align precisely.
AB = 0.618 of XA D = 0.786 of XA BC = 0.382 to 0.886
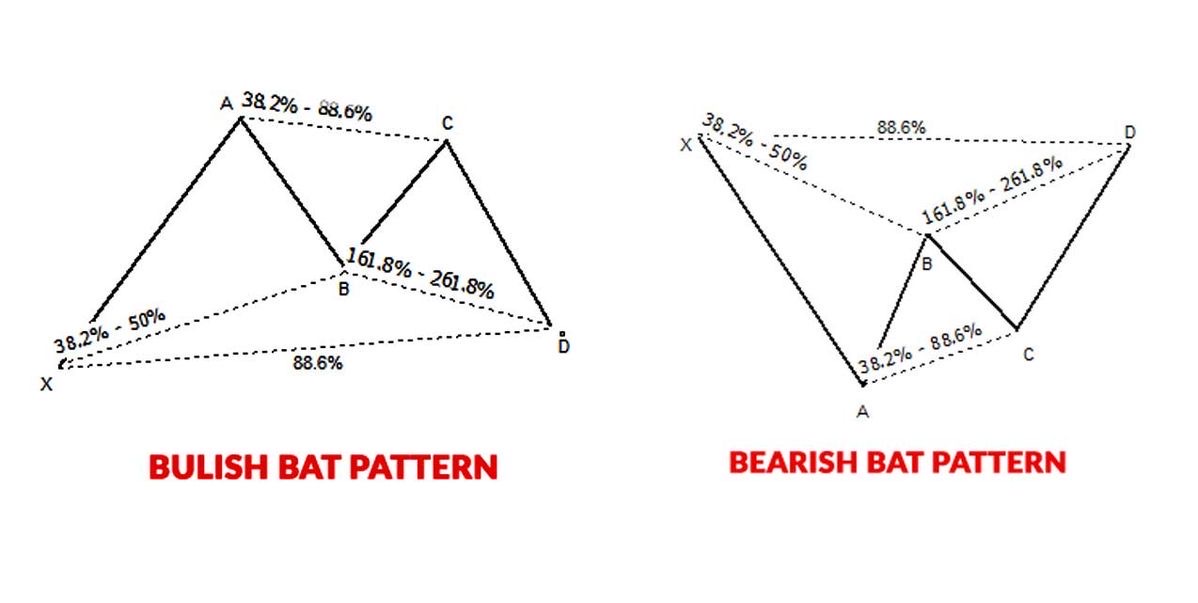
2. The Bat Pattern
Discovered by Scott Carney in 2001, the Bat is widely regarded as the most reliable harmonic pattern.
Point D reaches an 0.886 retracement of XA, producing a tighter entry zone and a smaller required stop-loss. That combination makes it the best risk-to-reward setup among the five-point patterns.
AB = 0.382 to 0.500 of XA D = 0.886 of XA CD = 1.618 to 2.618 of AB
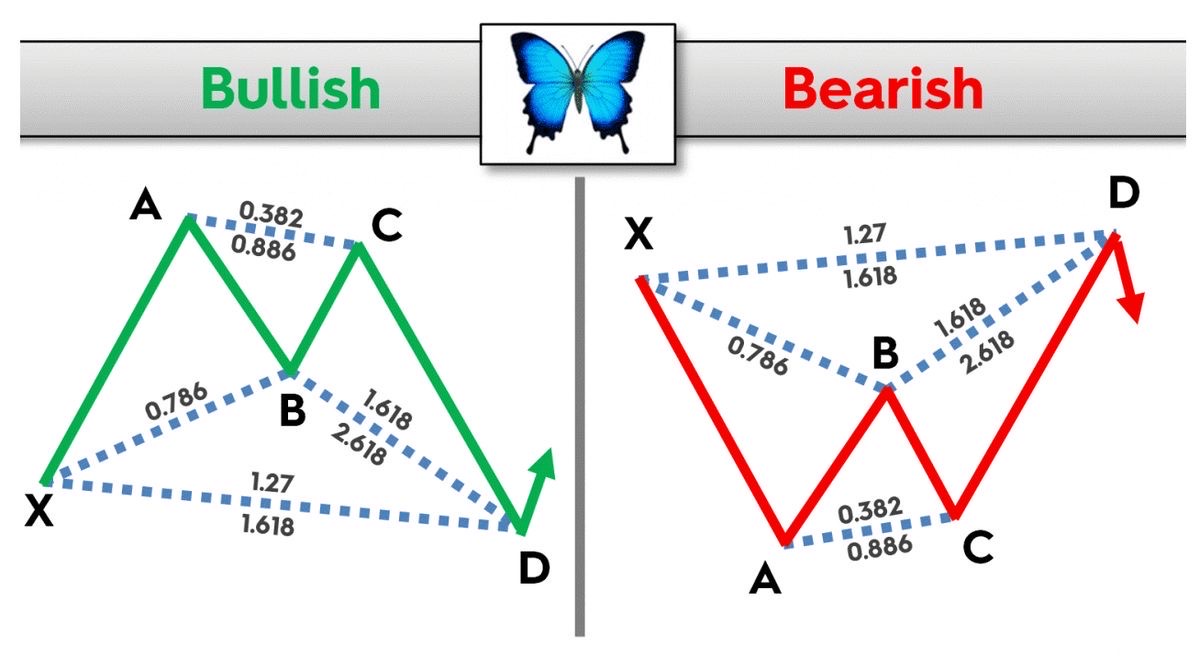
3. The Butterfly Pattern
Developed by Bryce Gilmore, the Butterfly is the exhaustion hunter. Point D extends beyond the origin point X, reaching a 1.272 extension of XA.
This makes it ideal for catching trend endings and major tops or bottoms. The further extension means a wider stop is required, but take-profit targets are correspondingly larger.
B = 0.786 of XA D = 1.272 of XA CD = 1.618 to 2.618 of AB
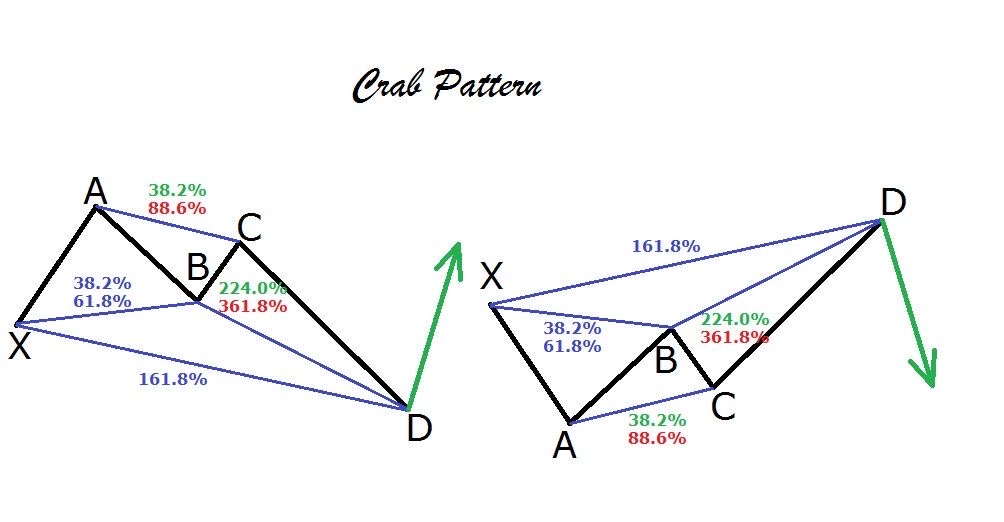
4. The Crab Pattern
Scott Carney considers the Crab his most precise pattern. Point D extends to a 1.618 Fibonacci extension of XA, far beyond the starting point.
The extreme extension is followed by sharp reversals, and the tight stop at D produces an outstanding reward-to-risk ratio. It is especially relevant in volatile altcoin markets.
AB = 0.382 to 0.618 of XA D = 1.618 of XA CD = 2.618 to 3.618 of AB
5. The Shark Pattern
The Shark is one of the newer patterns, introduced in 2011. It does not follow the standard XABCD labeling in the same way, using the 0 and C swing legs to define a 1.13 or 1.618 reciprocal ratio at point D.
It is rarer but offers high-probability setups when it does appear, particularly on the four-hour and daily crypto charts.
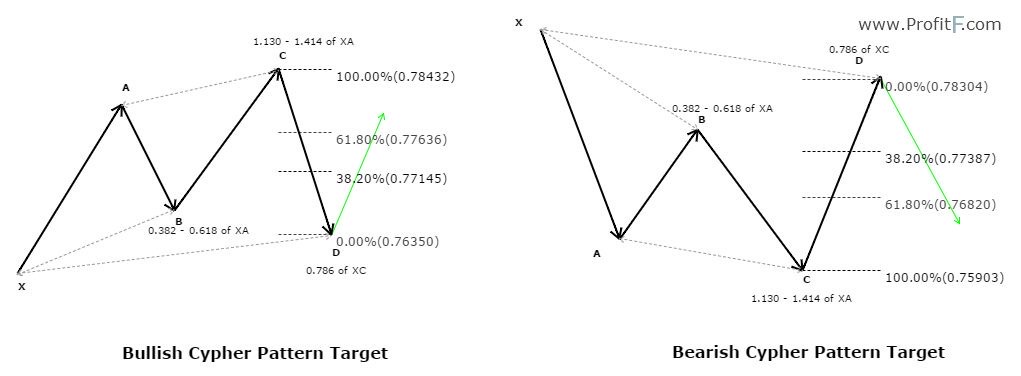
6. The Cypher Pattern
The Cypher pattern is defined by a point C that extends beyond point A, reaching a 1.272 to 1.414 extension of XA. Point D then retraces to the 0.786 level of XC.
It is a cleaner pattern than the Shark for many traders because point D aligns with a well-known retracement ratio, giving a clear entry trigger and an obvious invalidation level.
C = 1.272 to 1.414 of XA D = 0.786 of XC High precision entry
How to Identify Harmonic Patterns in Crypto Trading on a Crypto Chart?
1. Find a clean, impulsive XA leg
Look for a strong directional move with minimal pullbacks. This is your foundation. The larger and more impulsive the XA leg, the more reliable the eventual pattern completion at D.
2. Apply Fibonacci retracement on the XA leg
Draw from X to A. Note where the ensuing AB retracement ends. Does it land at 0.618 (Gartley), 0.382 to 0.500 (Bat), 0.786 (Butterfly), or 0.382 to 0.618 (Crab)?
This first check narrows the candidate pattern to one or two types.
3. Validate the BC leg
The BC leg should retrace 0.382 to 0.886 of AB across most patterns. Use the Fibonacci retracement tool on the AB leg. A BC that exceeds 0.886 of AB invalidates most standard patterns.
4. Project the D point range
Use Fibonacci extension on the BC leg to project where CD will end. Cross-check this projected D level against the D-point retracement of XA for your candidate pattern.
The tighter the convergence, the stronger the PRZ.
5. Monitor the PRZ with alerts, not your eyes
Set price alerts at the PRZ and walk away. Staring at the chart increases the temptation to enter early. When the alert fires, return to evaluate the confirmation candle objectively.
Join UEEx
Experience the World’s Leading Digital Wealth Management Platform
How Do You Manage Risk Effectively When Trading Harmonic Patterns?
Effective harmonic risk management means placing a stop-loss just beyond point D (the pattern invalidation level), sizing your position so that loss represents no more than 1% to 2% of total capital, and scaling out profits at defined Fibonacci targets.
A 45% win rate sounds low until you pair it with a 3:1 reward-to-risk ratio. At those numbers, you are profitable over any statistically significant sample.
The edge comes not from winning more trades but from winning more on the trades you win than you lose on the ones you do not.
Position sizing is the non-negotiable foundation. Decide the maximum loss you are willing to take on this specific trade (say, 1% of your portfolio).
Divide that amount by the distance from your entry to your stop in dollar terms. That gives you your position size.
No harmonic pattern, no matter how textbook-perfect, justifies exceeding your risk parameters.
Join UEEx
Experience the World’s Leading Digital Wealth Management Platform
Why Are Harmonic Patterns Useful in Crypto Trading?
Accuracy: Harmonic patterns rely on precise Fibonacci ratios, which can improve the accuracy of entry and exit points.
Volatility Management: Given the volatility in cryptocurrencies, harmonic patterns help traders by providing a more reliable indication of price reversals.
Works in Multiple Timeframes: Harmonic patterns can be applied to various timeframes, whether you’re a day trader or a long-term investor.
“The hard work in trading comes in the preparation. The actual process of trading, however, should be effortless.”
How to Improve Trading Strategy Using Harmonic Patterns
Harmonic patterns are highly effective at predicting price movements across various timeframes. To further enhance their accuracy, it’s important to interpret harmonic chart patterns while considering factors such as current price, trend, volatility, and, most importantly, market sentiment.
The efficiency of harmonic patterns can also be boosted by incorporating additional technical analysis tools. Indicators like the RSI, along with support and resistance levels, can help validate the buy/sell signals generated by harmonic patterns.
Lastly, consistent practice in reading and accurately identifying these patterns is key to maximizing the benefits of harmonic trading. By 2030, the worldwide market is expected to grow by 12.5% in compound annual growth rate (CAGR), as noted by Grand View Research.
There is no better time than now to improve your trading knowledge by knowing all the basics of harmonic patterns.
How Does UEEX Make Harmonic Pattern Trading More Effective?
1. Precise stop-loss execution
Harmonic patterns require stops placed just beyond point D at a specific price. UEEX Futures supports stop-limit orders down to the smallest price increment, so your invalidation level is honored exactly.
2. Up to 125x leverage on Futures
A clean Bat or Gartley setup with a tight 0.5% stop becomes a high-conviction, capital-efficient trade with appropriate leverage applied.
UEEX’s liquidation engine an real-time margin monitoring keep exposure visible and manageable
3. USDT and USDC settlement:
All P&L settles in stablecoins, which eliminates the compounding volatility risk of holding native crypto as margin. Your account value is stable between trades
4. Copy Trading for harmonic specialists
UEEX’s 1M+ user base across 110 countries includes verified signal providers who specialize in harmonic and Fibonacci-based strategies. Follow their trades automatically with defined risk per position.
5. Independent Asset Vault and Proof-of-Reserves
Capital security is non-negotiable. UEEX’s cold storage architecture and published proof-of-reserves audits mean your funds are not at counterparty risk while your trade is setting up over several days.
6. DeFi Cloud Mining and UEEX Savings
Capital not deployed in an active harmonic setup can earn yield through UEEX Savings or DeFi Cloud Mining rather than sitting idle.
Are You Ready to Execute Your First Harmonic Trade?
UEEX gives you the precision tools, stable settlement, and deep liquidity that harmonic trading demands. Join over one million traders in 110 countries who have made UEEX their primary trading platform.
Join UEEx
Experience the World’s Leading Digital Wealth Management Platform
Abeeb is a goal-oriented content writer with over 4 years of experience in crafting compelling and insightful content across various genres, including tech, news, entertainment, and blockchain. Known for building strong connections with clients and stakeholders, Abeeb is dedicated to delivering clear, concise, and impactful writing that captivates audiences.
Disclaimer: This article is intended solely for informational purposes and should not be considered trading or investment advice. Nothing herein should be construed as financial, legal, or tax advice. Trading or investing in cryptocurrencies carries a considerable risk of financial loss. Always conduct due diligence before making any trading or investment decisions.