

After Bitcoin ETFs launched in January 2024, Bitcoin surged to $73,000 in March but then fell to $51,000 by August. What causes this volatility?
While many investors and traders know that crypto prices can change drastically, they often don’t understand the reasons behind these fluctuations. Read on to learn how to understand the causes of crypto price volatility and the knowledge to handle the risks and opportunities effectively.
Key Takeaways
- Crypto price volatility is the cryptocurrency market’s rapid and significant fluctuations.
- Various factors contribute to crypto price volatility. These include market demand, regulatory changes, economic factors, and investor sentiment. Understanding these factors can help predict and analyze price movements.
- Technical analysis involves studying chart patterns, indicators, and historical price data to predict future price movements.
- While crypto price volatility is likely to persist, factors such as increased regulation, institutional adoption, and technological advancements may stabilize the market in the long run.
What is Crypto Volatility?
Crypto volatility refers to the degree of variation in the price of cryptocurrencies over time. It is a measure of how much the price of a cryptocurrency fluctuates, either increasing or decreasing, within a specific period. Volatility in the cryptocurrency market is typically much higher than in traditional financial markets, leading to significant price swings that can occur within minutes or hours.
Related: Crypto Volatility Analysis: A Complete Guide.
Here are some key points about crypto volatility:
High Price Fluctuations
Cryptocurrencies can experience large price movements quickly—sometimes within minutes or hours. This can lead to significant gains or losses for traders and investors. For example, In December 2017, Bitcoin’s price surged from $13,000 to nearly $20,000 within a week, only to plummet to $14,000 a few days later. This rapid fluctuation resulted in huge profits for some traders and significant losses for others.
Market Sentiment
Crypto markets are heavily influenced by investor sentiment, which can change rapidly based on news, rumors, or significant events. Positive news might lead to rapid price increases, while negative news can cause sharp declines.
For example, In February 2021, Tesla announced it had purchased $1.5 billion in Bitcoin and would accept it as payment, leading to a significant price surge. Conversely, in May 2021, when Tesla suspended Bitcoin payments due to environmental concerns, Bitcoin’s price dropped sharply.
Liquidity
Many cryptocurrencies have relatively low liquidity, meaning there aren’t always enough buyers and sellers to facilitate trades smoothly. This can lead to more significant price swings, as even small trades can greatly impact the market price.
For example, Smaller altcoins often experience extreme volatility. For instance, during the ICO boom in 2017, many tokens saw wild price swings due to low liquidity, where a single large trade could significantly move the price.
Regulatory News
Announcements related to government regulations can cause prices to fluctuate wildly. For example, prices typically drop if a major economy announces a cryptocurrency crackdown.
For example, In September 2017, China’s announcement of a ban on ICOs and cryptocurrency exchanges caused a significant drop in Bitcoin and other cryptocurrency prices, illustrating the impact of regulatory news on market volatility.
Technological Changes and Innovations
Developments such as hard forks, new protocols, or major updates can also influence volatility. Investors might react positively or negatively to these changes depending on their perceived impact on a cryptocurrency’s future.
For example, the Ethereum network’s transition to Ethereum 2.0, a major upgrade to its protocol, led to price fluctuations as investors speculated on its future impact. Hard forks like Bitcoin Cash’s split from Bitcoin in 2017 also caused significant price movements.
Market Size and Maturity
The cryptocurrency market is relatively young and still developing compared to traditional financial markets like stocks or commodities. Its small size and youth contribute to its volatility as it matures and becomes more integrated with traditional finance.
For example, the entire cryptocurrency market cap is still much smaller than that of major traditional markets. For instance, a single large transaction by an institutional investor can cause more significant price changes in the crypto market compared to the more mature stock market.
Related Article: The Ultimate Guide to Crypto Price Comparison in 2024
What are Market Manipulation and Speculation
Market manipulation and speculative trading play a significant role in driving the unpredictable nature of cryptocurrency price fluctuations. Understanding these factors is crucial for investors and traders navigating the volatile crypto market.
Pump and Dump Schemes
A common form of market manipulation in crypto is the “pump and dump” scheme. In this scheme, a group artificially boosts a cryptocurrency’s price through hype, causing a buying frenzy. Once the price peaks, they sell their holdings, leading to a sharp drop and significant losses for late investors.For instance, In January 2018, the cryptocurrency Verge (XVG) experienced a classic pump and dump. A coordinated effort on social media and chat groups pushed the price from $0.10 to $0.30 within hours. Once the price hit a peak, the promoters sold off their holdings, causing the price to crash back to $0.10, leaving many investors with significant losses.

Whale Manipulation
Another form of manipulation in the crypto market involves whales, individuals, or entities with significant cryptocurrency holdings. Whales have the power to influence prices through large-scale buying or selling activities.
By strategically executing significant trades, whales can create artificial buying or selling pressure, leading to rapid price changes. This manipulation tactic exploits the market’s relatively low liquidity, making moving prices in the desired direction easier.
For instance, In September 2017, a Bitcoin whale reportedly sold 30,000 BTC on various exchanges. This massive sell-off created panic in the market, causing Bitcoin’s price to drop from $4,600 to $4,000 in a matter of hours.
Read More: 5 Best Crypto Screeners in 2024
Once the price stabilized, the whale bought back BTC at the lower price, profiting from the price difference and illustrating the impact of whale manipulation.

Strategies for Managing Volatility Risks in Crypto Markets
Managing and mitigating risks in volatile crypto markets involves strategic planning, understanding market dynamics, and using financial tools effectively. Below, I’ll discuss several risk management techniques, explore useful tools, and provide insights on developing long-term investment strategies.
Stop-Loss Orders
A stop-loss order is placed with a broker to buy or sell once the asset reaches a certain price. It is designed to limit an investor’s loss on a position in a security. Stop-loss orders in highly volatile markets like crypto can prevent significant losses during sudden downturns.
For example, If you buy Bitcoin at $70,000 and set a stop-loss order at $68,000, the order will automatically sell your Bitcoin if the price drops to $68,000, limiting your loss to $2,000.
Position Sizing
This involves determining how much of your capital to allocate to a specific investment. Proper position sizing is crucial to managing risk and avoiding excessive exposure to any single asset. It’s advisable to risk only a small percentage of your portfolio on any single trade.
If you have a $10,000 portfolio, you may risk only 2% ($200) on any single trade. This way, your overall portfolio remains largely intact, even if a trade goes against you.
Portfolio Diversification
Diversifying your portfolio by investing in a variety of assets can reduce risk. In crypto, this could mean investing across different coins and sectors (like DeFi, NFTs, and smart contracts platforms) or diversifying into other asset classes like stocks or bonds.
For instance, instead of putting all your funds into Bitcoin, you could allocate 50% to Bitcoin, 25% to Ethereum, 15% to DeFi tokens, and 10% to traditional assets like stocks or bonds.
Read Also: Mean Reversion Strategies For Profiting in Cryptocurrency
Technical Analysis and Trading Patterns
Technical analysis and identifying trading patterns are crucial in understanding and predicting cryptocurrency price movements. By analyzing historical price data and market trends, traders can gain insights into potential future price movements and make informed decisions.
Candlestick Charts and Trend Lines
One common tool used in technical analysis is the candlestick chart. Candlestick charts display price movements over a specific period, providing valuable information about market sentiment and potential reversals. Traders often look for patterns, such as bullish or bearish engulfing patterns, to identify potential buying or selling opportunities.
Trend lines are another important aspect of technical analysis. By drawing lines that connect the highs or lows of price movements, traders can identify the market’s overall direction. An upward trend line indicates a bullish market, while a downward trend line suggests a bearish market.
Indicators and Oscillators
Traders also rely on various indicators and oscillators to analyze cryptocurrency prices. Common indicators include moving averages, relative strength index (RSI), and stochastic oscillators. These indicators help traders identify overbought or oversold conditions, trend reversals, and potential entry or exit points.
Support and Resistance Levels
Support and resistance levels are significant price levels that traders closely monitor. Support levels act as a floor, where buying pressure is expected to outweigh selling pressure, potentially leading to a price increase. On the other hand, resistance levels act as a ceiling, where selling pressure is expected to exceed buying pressure, potentially leading to a price decrease.
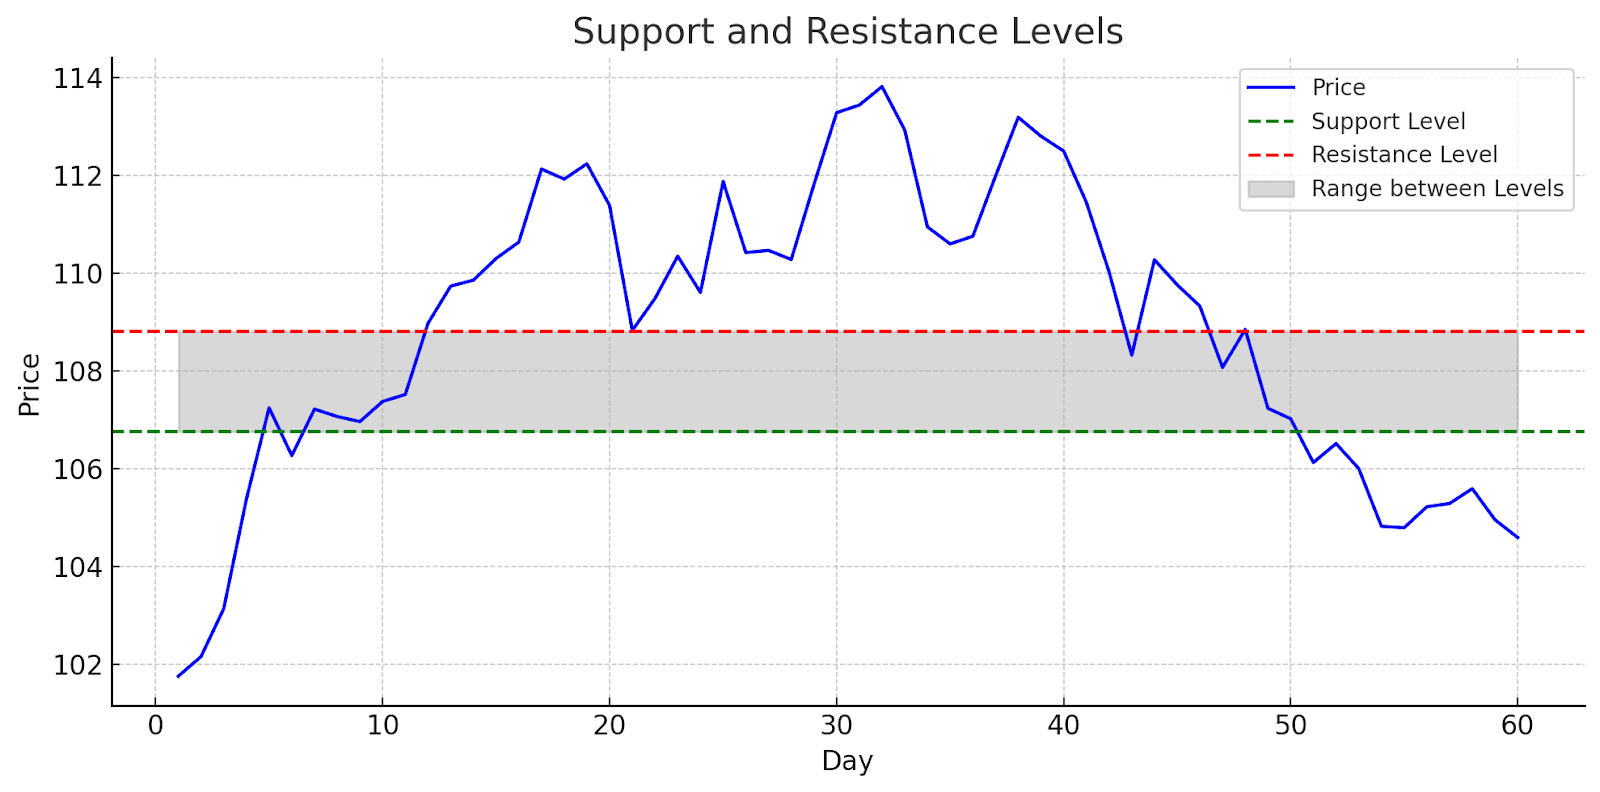
Chart Patterns
Chart patterns, such as triangles, flags, and head and shoulders patterns, provide valuable insights into potential future price movements. Price fluctuations form these patterns and can indicate trend reversals, continuation patterns, or potential breakouts.
Read Also: Trading Cryptocurrency with Demand and Supply Zones Analysis

Conclusion
The crypto market is still new, underdeveloped, and very volatile. This volatility is a normal part of its growth, offering both challenges and opportunities for traders and investors.
As the market grows, many causes of volatility will decrease. We’re already seeing more involvement from big investors and more regulation, which will help make the market more stable over time.
To better understand crypto market volatility, sign up with UEEx today!


