

In March 2020, Bitcoin plunged to around $3,800 due to the COVID-19 pandemic but quickly rebounded, forming a V-shaped recovery and reaching new highs by the end of 2020.
Traders who identified this reversal capitalized on the dip, with Bitcoin exceeding $20,000 by December 2020.
Trend reversals are shifts in the price direction of an asset, moving from one trend to another. In this blog post, we will explore how to spot trend reversals in crypto.
Summary
- Bitcoin’s recovery from $3,800 in March 2020 to over $20,000 by year-end shows the power of spotting trend reversals early.
- Key indicators for identifying trend reversals include MACD, RSI, volume analysis, divergence, and candlestick patterns.
- Patterns like Head & Shoulders, Double Tops/Bottoms, and Rising/Falling Wedges help traders predict significant market shifts.
- A failed Bitcoin reversal in 2021 shows the risks of relying solely on technical indicators without considering broader market sentiment and external factors.
Five Key Indicators for Spotting Trend Reversals
Identifying trend reversals in cryptocurrency markets requires using technical indicators that can offer insights into shifts in momentum and market sentiment. Here are some of traders’ most effective tools to spot potential reversals.
Moving Average Convergence Divergence (MACD)

The Moving Average Convergence Divergence (MACD) is one of the most popular indicators for detecting trend reversals. It consists of two lines, the MACD line and the signal line, which are derived from moving averages. When these lines cross, it signals a potential change in momentum.
When the MACD line crosses above the signal line, it indicates a potential bullish reversal. Conversely, when it crosses below the signal line, it suggests a bearish reversal.
How to Use MACD for Detecting Reversals
To use MACD effectively, traders look for:
- Crossover points: Bullish and bearish crossovers signal momentum shifts.
- Divergence: When the price of a crypto asset is rising, but the MACD is falling (or vice versa), it signals a potential trend reversal.
- Histogram: The MACD histogram shows the difference between the MACD line and the signal line. If the histogram switches from positive to negative or vice versa, it can indicate an upcoming reversal.
Relative Strength Index (RSI)

The Relative Strength Index (RSI) is another key tool for spotting reversals by identifying overbought or oversold conditions in the market. The RSI ranges from 0 to 100, and it indicates momentum.
- Overbought conditions: When the RSI is above 70, it suggests the asset is overbought, signaling a potential bearish reversal.
- Oversold conditions: When the RSI is below 30, it suggests the asset is oversold, indicating a potential bullish reversal.
How RSI Indicates Potential Reversals
Traders use RSI to identify extreme market conditions. A sharp move above 70 or below 30 often signals that a reversal may be imminent as the market is likely to correct itself.
Additionally, watching for divergence between RSI and price movement can offer further confirmation. For example, if the price is rising but RSI is decreasing, a bearish reversal may be on the horizon.
Volume Analysis

Volume analysis refers to the total amount of a cryptocurrency traded within a given time frame, and it helps gauge the strength of a price move.
Here are some importance of Trading Volume:
- High volume during a price increase or decrease suggests strong market participation, making the move more likely to be sustained.
- Low volume may indicate a lack of conviction in the current trend, signaling a potential reversal.
Using Volume to Confirm Reversals
A common strategy involves looking for volume spikes at critical points in the market. If a price change (up or down) is accompanied by significant volume, it suggests that a reversal may be imminent.
Conversely, if price movements occur on low volume, the reversal might not be strong, and the current trend could continue.
Divergence

Divergence occurs when the price of a cryptocurrency moves in the opposite direction of an indicator, such as MACD or RSI. There are two types of divergence: bullish and bearish.
- Bullish divergence: This occurs when the price of an asset is making lower lows, but the indicator (e.g., MACD or RSI) is making higher lows. This signals weakening downside momentum and the potential for an upward reversal.
- Bearish divergence: Occurs when the price is making higher highs, but the indicator is making lower highs. This suggests a weakening upside momentum and the possibility of a downward reversal.
How Divergence Signals a Possible Trend Change
Traders look for divergence as an early sign that the current trend is losing strength. Combining divergence with other indicators like volume analysis or candlestick patterns provides more robust confirmation of a potential reversal.
Candlestick Patterns

Candlestick patterns are essential visual indicators used in technical analysis to predict trend reversals. They are formed by the price movement within a particular timeframe and often signal turning points in the market.
Popular Candlestick Patterns That Signal Reversals
- Hammer: A bullish reversal pattern that forms after a downtrend. It has a small body and a long lower shadow, indicating buyers have started to push the price back up.
- Doji: A candlestick with little to no body, indicating indecision in the market. A Doji after a prolonged trend can signal a potential reversal.
- Engulfing Patterns: A bullish engulfing pattern occurs when a small red candlestick is followed by a large green one, engulfing the previous candle. This suggests a potential bullish reversal. Conversely, a bearish engulfing pattern signals a bearish reversal.
Expert Opinion: Technical Indicators
While technical indicators are useful, trend reversals in cryptocurrency markets usually rely on more than one factor. As Jeffrey Castillo, CEO of CheatCodesLab, explains,
“Beginners should look for multiple signs lining up, not just one. A true trend reversal comes with a shift in market sentiment, not just a brief price change”.
Castillo highlights the importance of watching both price movements and market sentiment, such as trade volume spikes, social media shifts, and technical patterns like the cup and handle. In 2018, he identified a trend reversal in Ethereum and gained over 300% by acting on these signs.
Castillo advises, “Temporary dips are normal in crypto. Wait for clear signs that the overall trend is shifting before acting. When multiple indicators align and point to a new uptrend, that’s the moment to move.”
Common Trend Reversal Patterns
Recognizing chart patterns is a vital skill in cryptocurrency trading for identifying trend reversals. Below are some of the most common reversal patterns that traders use to predict significant shifts in market direction.
Head and Shoulders

The Head and Shoulders pattern is one of the most reliable indicators of a trend reversal in both crypto and traditional markets. It typically signals a shift from an uptrend to a downtrend.
- Recognition of Head and Shoulders in Crypto Markets: This pattern forms after an uptrend and consists of three peaks. The middle peak (the “head”) is higher than the two outside peaks (the “shoulders”). This structure shows a weakening upward momentum, indicating that a bearish reversal may follow.
- Significance of the Neckline in Confirming Reversals: The neckline connects the lows between the peaks. A break below the neckline confirms the reversal. Traders often wait for the price to close below the neckline to enter short positions, as it indicates that the previous uptrend has likely ended.
Double Top and Double Bottom

Double tops and double bottoms are classic chart patterns that signal potential reversals, often marking the exhaustion of an existing trend.
- Double top: This pattern appears after an uptrend, where the price forms two peaks at nearly the same level. It indicates that the upward momentum is weakening and a bearish reversal could occur.
- Double bottom: Occurs after a downtrend, where the price forms two troughs at a similar level. It signals that the downward momentum is fading, and a bullish reversal might be on the horizon.
How to Spot Breakouts from These Patterns
A breakout from a double top happens when the price falls below the support level between the two peaks. Similarly, a breakout from a double bottom occurs when the price rises above the resistance level formed between the two troughs.
Confirming the breakout helps ensure the trend is reversing, and traders can enter long or short positions accordingly.
Related Read: How to Easily Identify Key Support and Resistance Levels – UEEx Technology
Triple Top and Triple Bottom

Triple tops and triple bottoms are variations of double tops and bottoms but with an additional peak or trough, making them more reliable, though less common.
- Triple top: This pattern occurs when the price hits a resistance level three times, forming three peaks of equal height after an uptrend. It suggests that buying pressure has weakened, signaling a bearish reversal.
- Triple bottom: Similar to the triple top but occurs after a downtrend, forming three troughs of equal depth. This signals that sellers are losing control, hinting at a bullish reversal.
Why Triple Formations Are Less Common but More Reliable
Triple tops and bottoms take longer to form than their double counterparts, making them less frequent. However, they tend to be more reliable as they represent a prolonged battle between buyers and sellers, leading to a more decisive breakout once the pattern is completed.
Rising and Falling Wedges

Rising and falling wedges are continuation or reversal patterns that signal tightening price movement, often leading to a breakout.
- A rising wedge occurs when the price is making higher highs and higher lows, but the trendlines converge. This signals a potential bearish reversal as the upward momentum weakens.
- A falling wedge occurs when the price makes lower highs and lower lows, with the trendlines converging. It suggests a bullish reversal as the downward momentum loses strength.
How Wedges Lead to Price Breakout Predictions
Rising wedges often result in a breakdown below the lower trendline, confirming a bearish reversal. On the other hand, falling wedges lead to a breakout above the upper trendline, confirming a bullish reversal. In both cases, the breakout direction typically signals the end of the current trend and the start of a new one.
Strategies for Trading Trend Reversals
Successfully trading trend reversals requires a well-thought-out approach. Different strategies cater to varying risk tolerances and market conditions. Below are some effective strategies for navigating trend reversals in the cryptocurrency market.
Conservative vs. Aggressive Trading Strategies
When trading trend reversals, understanding the distinction between conservative and aggressive strategies is essential for shaping your trading outcomes.
When to Enter or Exit a Trade
- Conservative Strategy: This approach involves waiting for clear signs of a trend reversal before entering a trade.
For example, a conservative trader may wait for the price to break a key level, like the neckline of a head and shoulders pattern or the resistance of a double bottom. While this leads to fewer trades, it’s generally safer and helps avoid false signals.
- Aggressive Strategy: Aggressive traders enter trades earlier, based on initial signs of a reversal, such as specific candle patterns that suggest a trend shift. While this can result in higher profits, it also comes with greater risk, as there’s less confirmation and a higher chance of false signals.
Stop-Loss and Profit Target Strategies for Trend Reversals
Conservative traders might set their stop-loss orders just above the recent high for short positions (or below the recent low for long positions) to limit losses if the reversal fails. Aggressive traders, on the other hand, may place tighter stop-losses to capitalize on smaller price movements.
Profit targets should also be defined based on the reversal pattern. Conservative traders may aim for more modest gains, perhaps targeting a previous support or resistance level, while aggressive traders might set higher targets, expecting stronger price movements post-reversal.
Combining Indicators for Higher Accuracy
Relying on a single indicator can result in misleading signals, especially in the volatile crypto market. Traders can significantly improve the accuracy of their trend reversal predictions by using multiple indicators in tandem.
Different indicators often generate conflicting signals. For example, while the RSI may give a bullish signal, the MACD could simultaneously suggest bearish momentum. Relying on just one indicator can lead to premature trade entries or exits, increasing the likelihood of losses.
How to Build a Strategy Using Multiple Signals
- Select Complementary Indicators: Choose indicators that provide different types of insights. For instance, combine a momentum indicator like the MACD with a trend indicator such as moving averages and a volatility measure like Bollinger Bands. This blend offers a more well-rounded perspective of market conditions.
- Confirming Signals: Use multiple indicators to confirm a potential trend reversal. For example, if the price forms a double bottom pattern, check whether the RSI indicates oversold conditions and if the MACD shows bullish divergence. This multi-layered approach can enhance your confidence in trading decisions.
- Backtesting and Adjustment: After developing a strategy, backtest it using historical data to evaluate its effectiveness. Adjust the parameters based on performance to fine-tune the strategy before applying it to live trades.
Mistakes to Avoid in Trend Reversal Identification
Identifying trend reversals can be challenging, and several common pitfalls can lead traders astray. Here are key mistakes to avoid:
Misinterpreting Retracements as Reversals
One of traders’ most frequent errors is confusing a retracement with a reversal. A retracement is a temporary reversal within an ongoing trend, while a reversal indicates a significant change in market direction.
Failing to distinguish between the two can result in premature entries, leading to potential losses. To mitigate this, always look for strong confirmation signals before deciding that a retracement has transitioned into a full reversal.
“Longer trend reversals can be harder to spot as they happen gradually and discretely, not suddenly”.
Over-reliance on a Single Indicator
While indicators are valuable tools for traders, relying solely on one can produce misleading signals. Each indicator has its strengths and weaknesses, and market conditions can impact their reliability.
For example, let’s say, the Relative Strength Index (RSI) indicates overbought conditions, but the price could still continue to rise. Instead, use a combination of indicators to create a more robust trading strategy, enhancing your ability to spot genuine reversals.
Ignoring Market Sentiment or External Factors
External factors like news events, regulatory changes, or macroeconomic trends can significantly influence price movements. When analyzing potential trend reversals, failing to consider these factors can lead to misguided decisions. Always stay informed about the broader market context and how it may affect your trading strategy.
Case Study: A Failed Trend Reversal Trade in Bitcoin (2021)
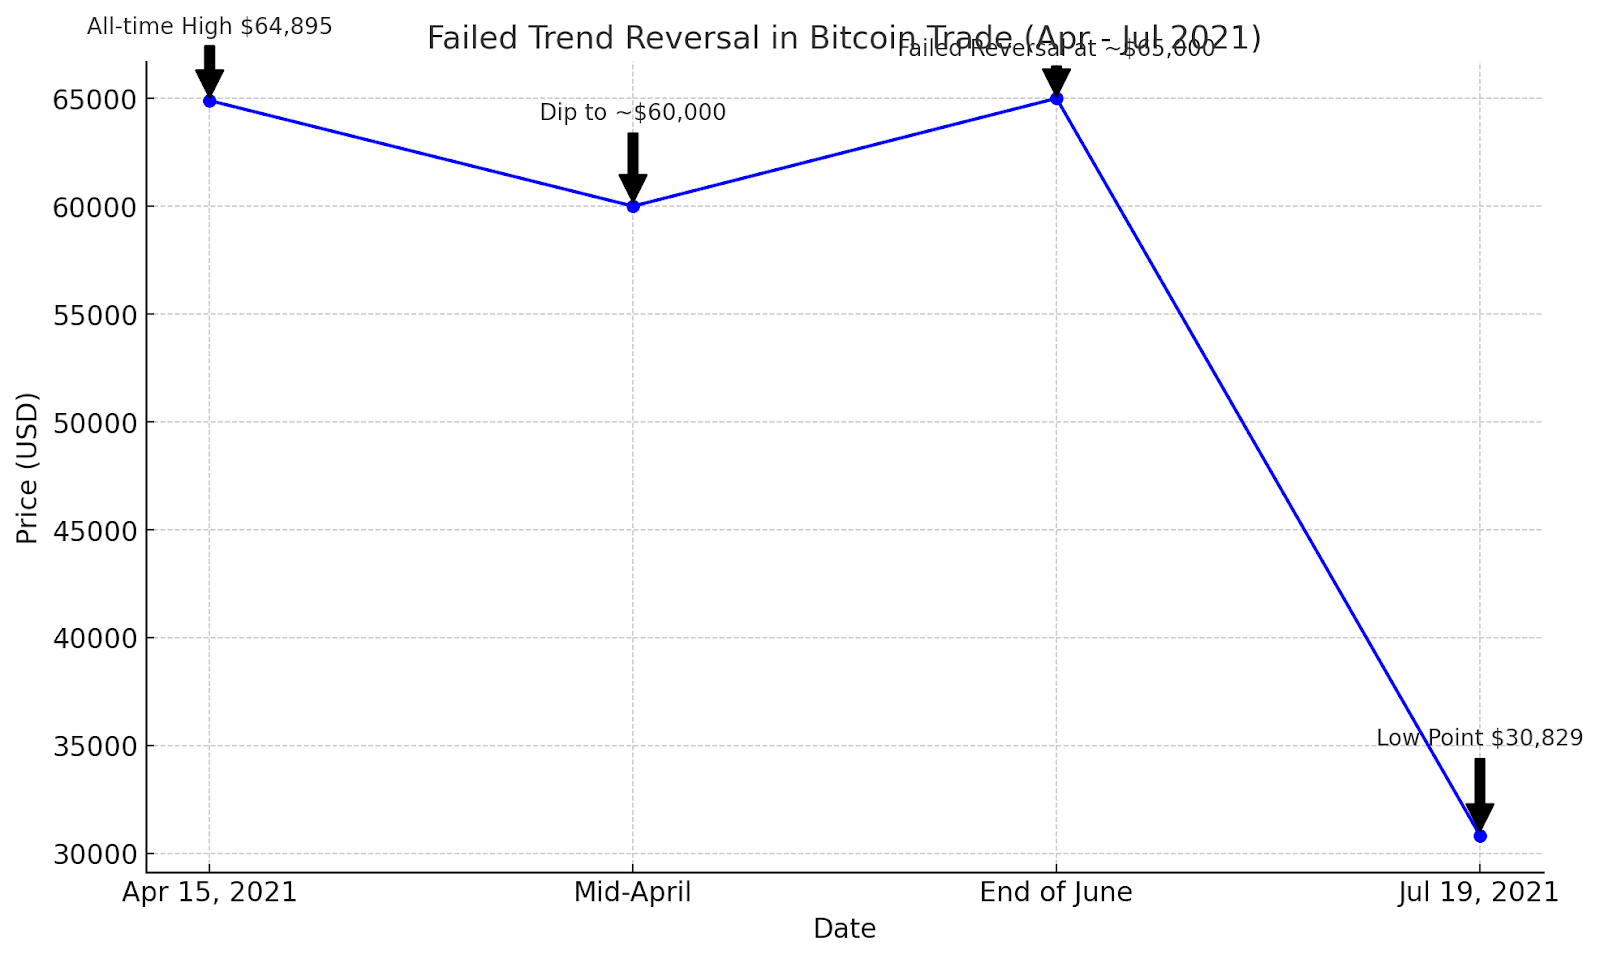
A well-known example of a failed trend reversal trade in Bitcoin occurred in early 2021, illustrating the risks of relying solely on technical indicators. Here’s what happened:
Expectation of a Reversal
After Bitcoin reached an all-time high of around $64,895 on the 15th of April 2021, many traders anticipated a trend reversal. Technical analysts observed patterns and signals, such as the Relative Strength Index (RSI) indicating overbought conditions, suggesting that a price correction might be imminent.
Failed Reversal
Despite these signals, Bitcoin’s price did not reverse as expected. Instead, it defied expectations and continued to climb, eventually reaching new highs. Traders who bet on a reversal and shorted Bitcoin suffered significant losses as the price surged past $64,000.
Market Sentiment and Institutional Interest
One of the key reasons for this failed reversal was the strong market sentiment, largely driven by institutional interest. For example, Tesla’s announcement of significant Bitcoin purchases in early 2021 fueled further buying pressure, overriding technical signals that suggested a pullback.
“Positive or negative news can trigger reversals, and being aware of these factors can provide an edge.”
This case demonstrates the importance of not relying exclusively on technical indicators like RSI. Broader market factors, such as institutional involvement and overall sentiment, can heavily influence price movements. It also highlights the inherent volatility and unpredictability of the cryptocurrency market, where even well-established patterns can fail.
Related Read: How to Use Historical Data for Accurate Crypto Trend Line Analysis – UEEx Technology
Conclusion
As demonstrated by Bitcoin’s failed reversal in 2021, relying solely on technical signals can lead to significant losses, especially in a market influenced by external factors like institutional interest.
Rushing into a trade without adequate confirmation can also lead to costly mistakes. Take your time to research and analyze different aspects of the market, including patterns, indicators, and sentiment. Cultivating this discipline will enhance your ability to identify genuine trend reversals while minimizing risks.
FAQs
What is the best indicator for spotting a trend reversal?
There isn’t one “best” indicator, but popular ones include the Moving Average Convergence Divergence (MACD), Relative Strength Index (RSI), and Volume Analysis. Combining these indicators with patterns like Head and Shoulders or Double Tops/Bottoms can provide more reliable signals.
How does MACD help in detecting a trend reversal?
The MACD helps by showing momentum shifts through crossovers between the MACD line and signal line. A bullish crossover (MACD line crossing above the signal line) indicates a potential upward reversal, while a bearish crossover suggests a downward reversal.
How does RSI signal a potential trend reversal?
RSI indicates overbought or oversold conditions. When the RSI goes above 70, the market is considered overbought, signaling a potential bearish reversal. When it falls below 30, the market is oversold, signaling a possible bullish reversal.
What role does volume play in trend reversals?
Volume analysis shows the strength behind price movements. High volume during price increases or decreases suggests that the move is likely to continue, while low volume may signal a lack of conviction, indicating a possible trend reversal.
How can divergence be used to spot trend reversals?
Divergence occurs when the price of a crypto asset moves in the opposite direction of an indicator like the MACD or RSI. Bullish divergence suggests a potential upward reversal, while bearish divergence signals a downward reversal.
How do conservative and aggressive trading strategies differ when spotting trend reversals?
Conservative traders wait for more confirmation before entering a trade, reducing the risk of false signals. Aggressive traders act on early signals like specific candlestick patterns, aiming for higher profits but with more risk.
What are some risks of relying on technical indicators alone for spotting reversals?
Relying solely on technical indicators without considering broader market sentiment or external factors (like news or regulations) can lead to false signals. Combining indicators with fundamental analysis and market awareness is essential.
How can I minimize risks when trading trend reversals?
To minimize risks, consider using stop-loss orders to limit potential losses, trade with a clear strategy, and avoid over-leveraging. Also, look for confirmation of reversals from multiple indicators before entering a trade.

")


