

Crypto technical analysis chart patterns are important aspects of crypto trading. Many traders rely on intuition and guesswork when trading crypto, only to find themselves on the wrong side of a trade.
The lack of a solid analytical framework can lead to impulsive decisions, resulting in significant losses. But what if you could tap into a powerful tool that helps you decipher the markets and make informed investment decisions?
One of the most effective ways to analyze the markets is by using chart patterns. In this article, we’ll explore chart patterns and provide you with a guide on how to use them for crypto technical analysis.
Recommended reading: Top Cryptocurrency Technical Analysis Platforms: A Guide
Key Takeaways
- Chart patterns are visual representations of price movements that can help predict future crypto market trends.
- Common bullish patterns include ascending triangles, cup and handle, and double bottoms.
- Bearish patterns to watch for are descending triangles, head and shoulders, and double tops.
- Combining chart pattern analysis with other technical indicators can improve trading accuracy.
- Risk management is crucial when trading based on chart patterns in the volatile crypto market.
What are Chart Patterns?
Chart patterns are graphical representations of price movements that form recognizable shapes on trading charts. These patterns emerge due to the collective actions of buyers and sellers in the market, reflecting underlying supply and demand dynamics.
“Chart patterns are the language of the market. By understanding this language, you can begin to decipher the market’s next move.”
– John J. Murphy, Technical Analysis of the Financial Markets.
Types of Chart Patterns
Chart patterns can be broadly categorized into three types:
Reversal Patterns
Reversal patterns indicate a potential change in the market trend. These patterns can be used to identify a change in the direction of the market, from an uptrend to a downtrend or vice versa. Some common reversal patterns include:
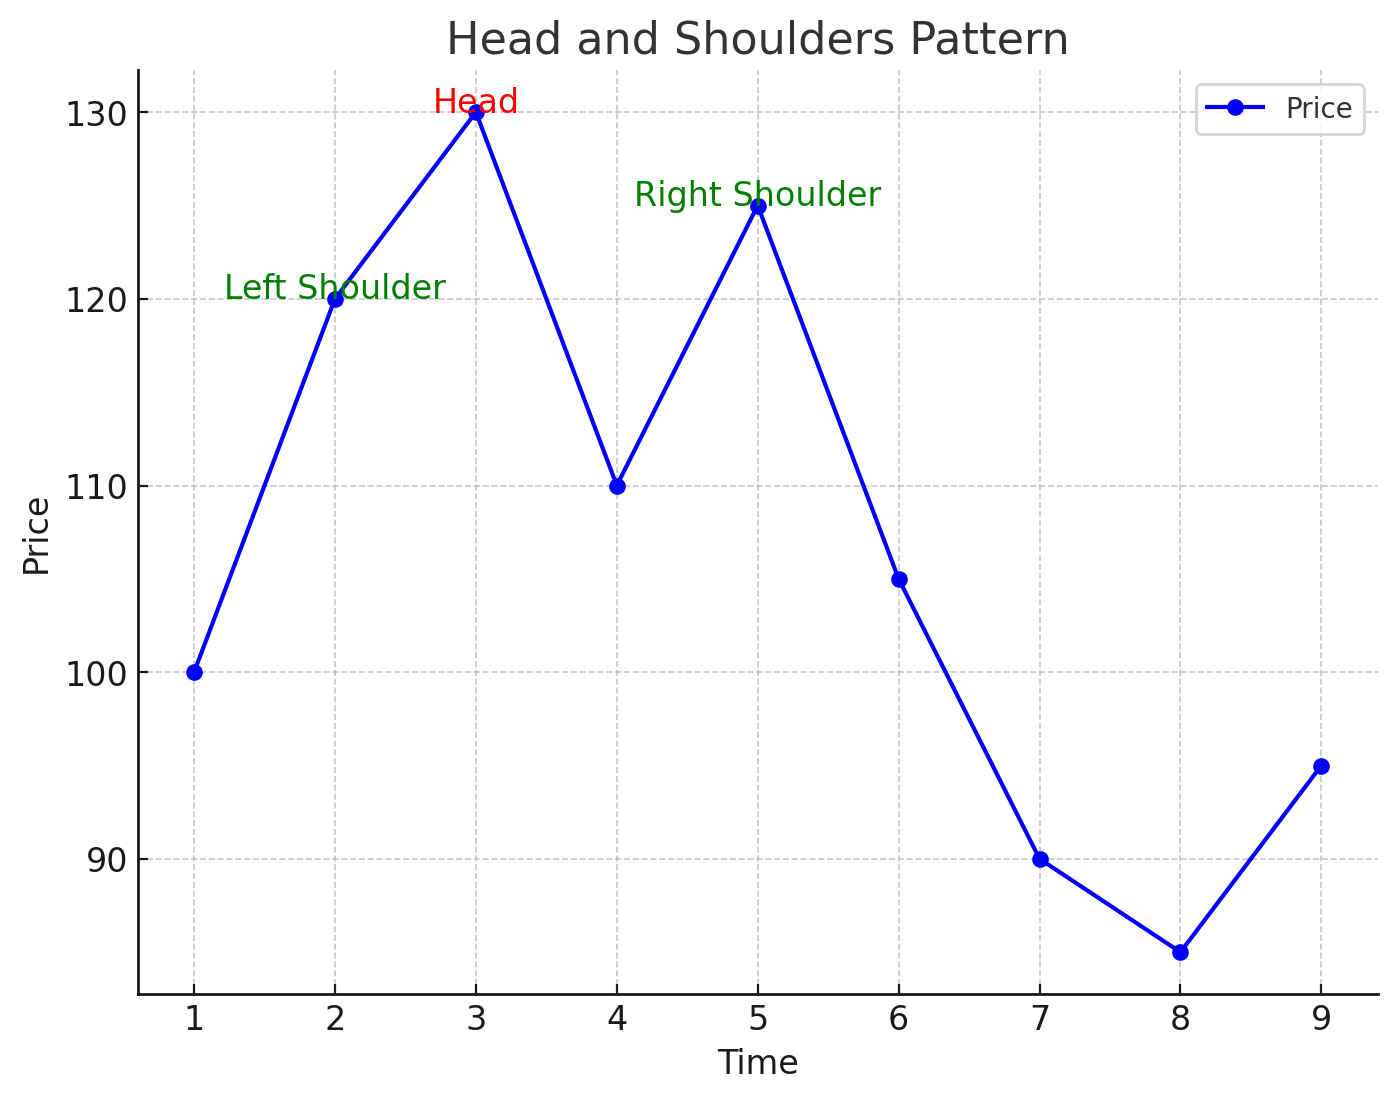
Head and Shoulders
A head and shoulders pattern is a bearish reversal pattern that forms when a stock or cryptocurrency makes a new high, followed by a lower high, and then a lower low.
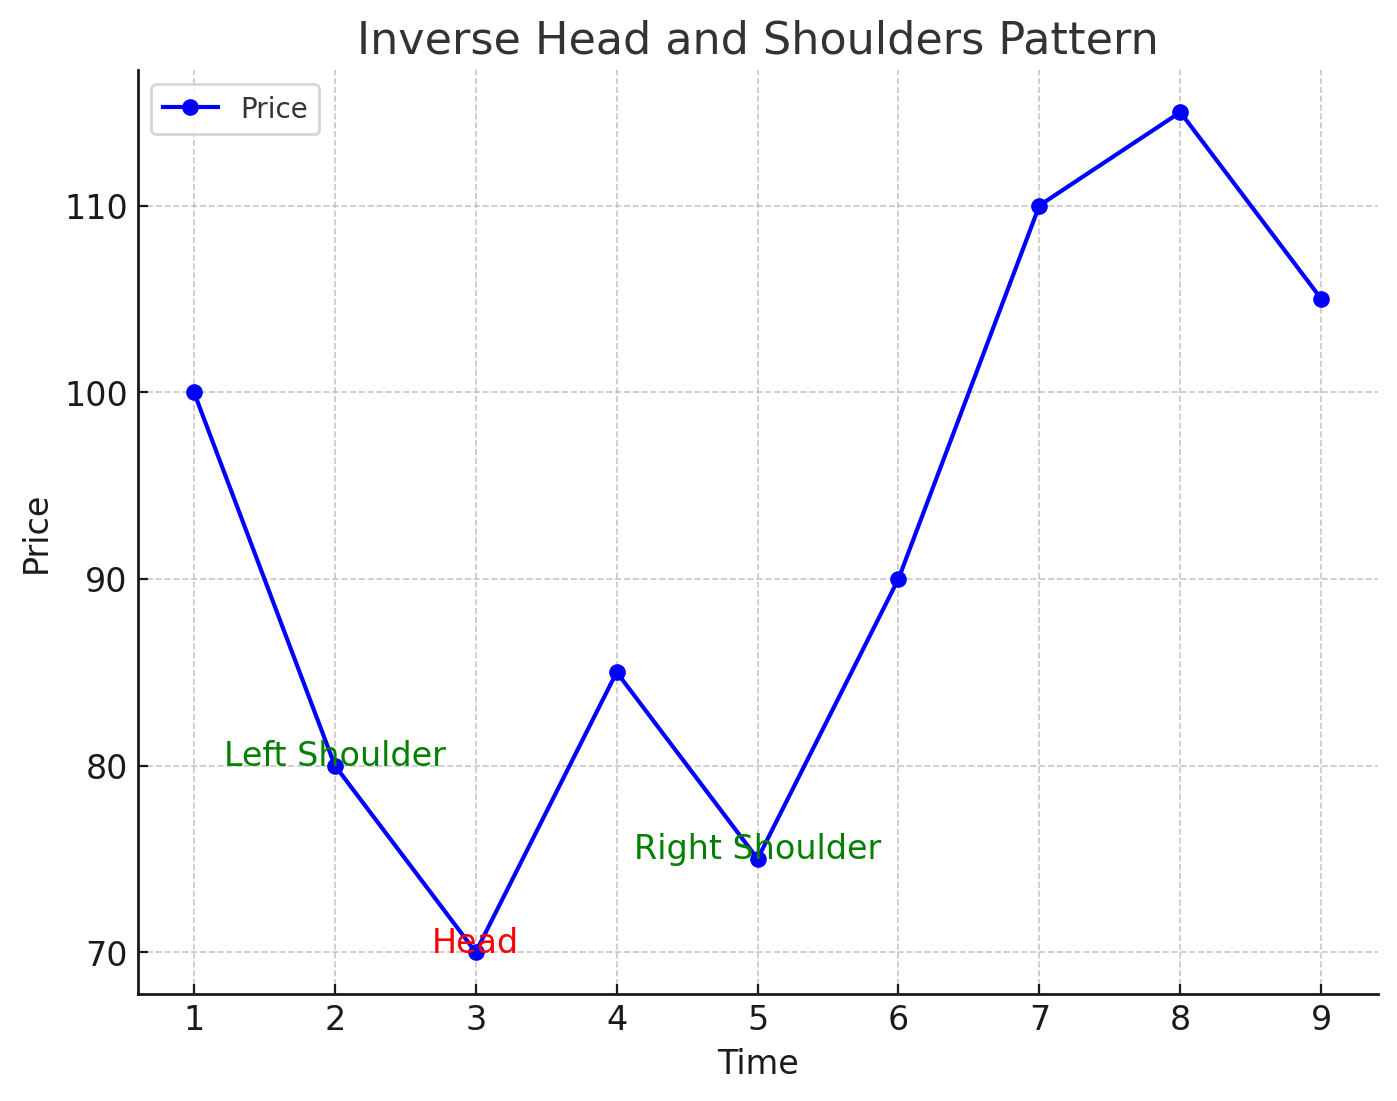
Inverse Head and Shoulders
An inverse head and shoulders pattern is a bullish reversal pattern that forms when a stock or cryptocurrency makes a new low, followed by a higher low, and then a higher high.
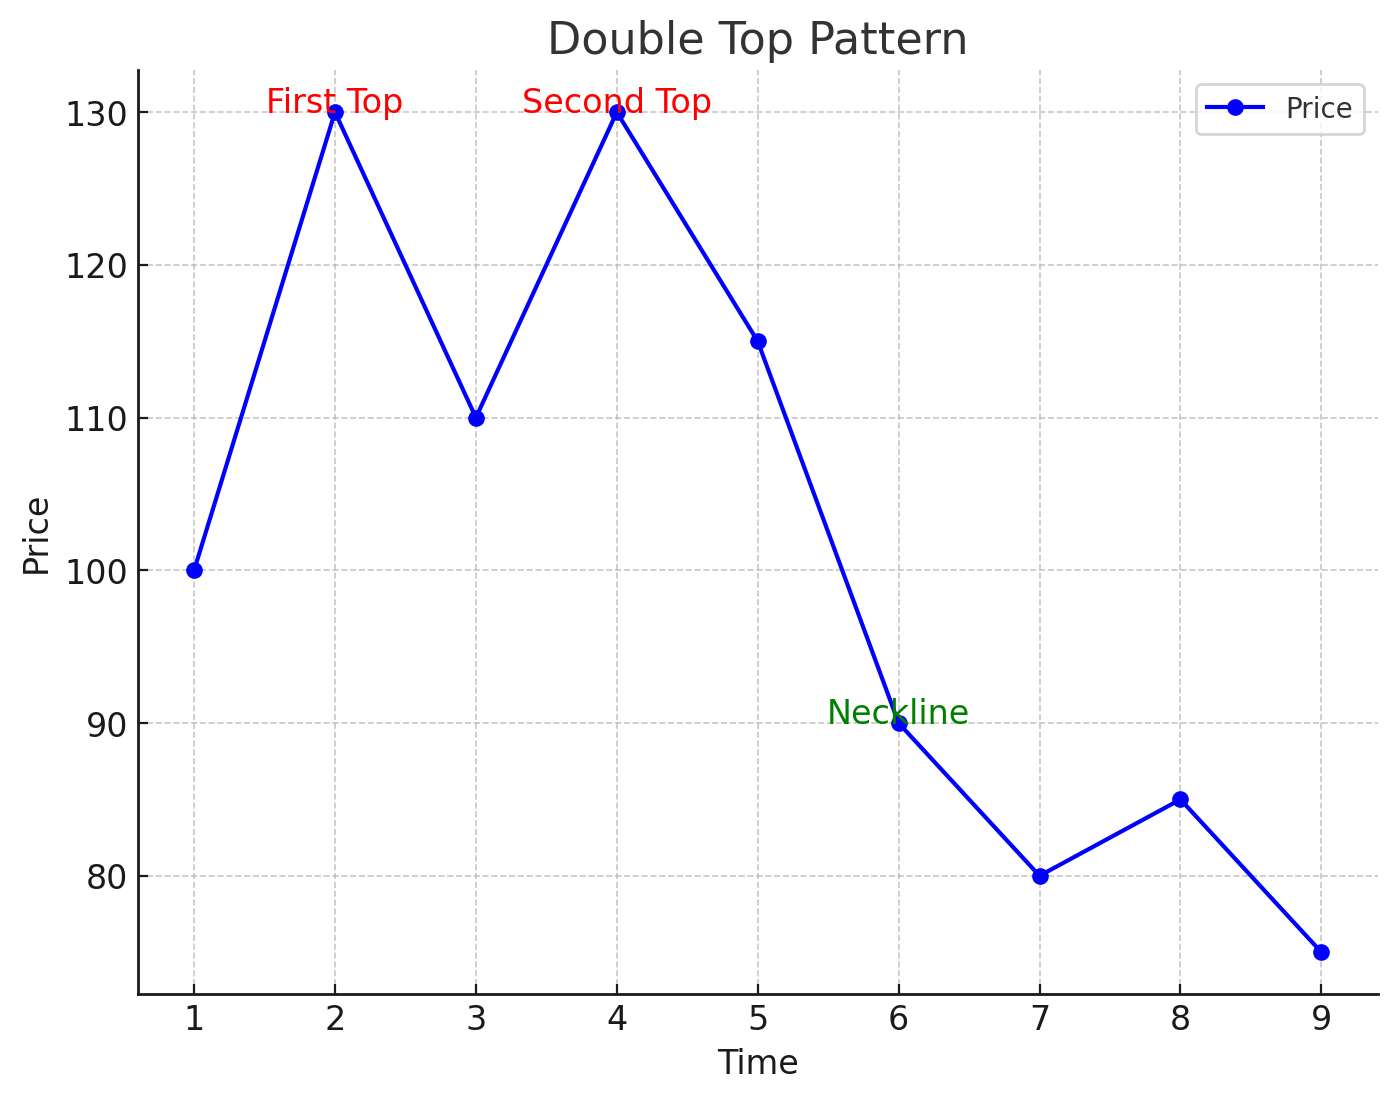
Double Top
A double top pattern is a bearish reversal pattern that forms when a stock or cryptocurrency makes two consecutive highs, followed by a decline.
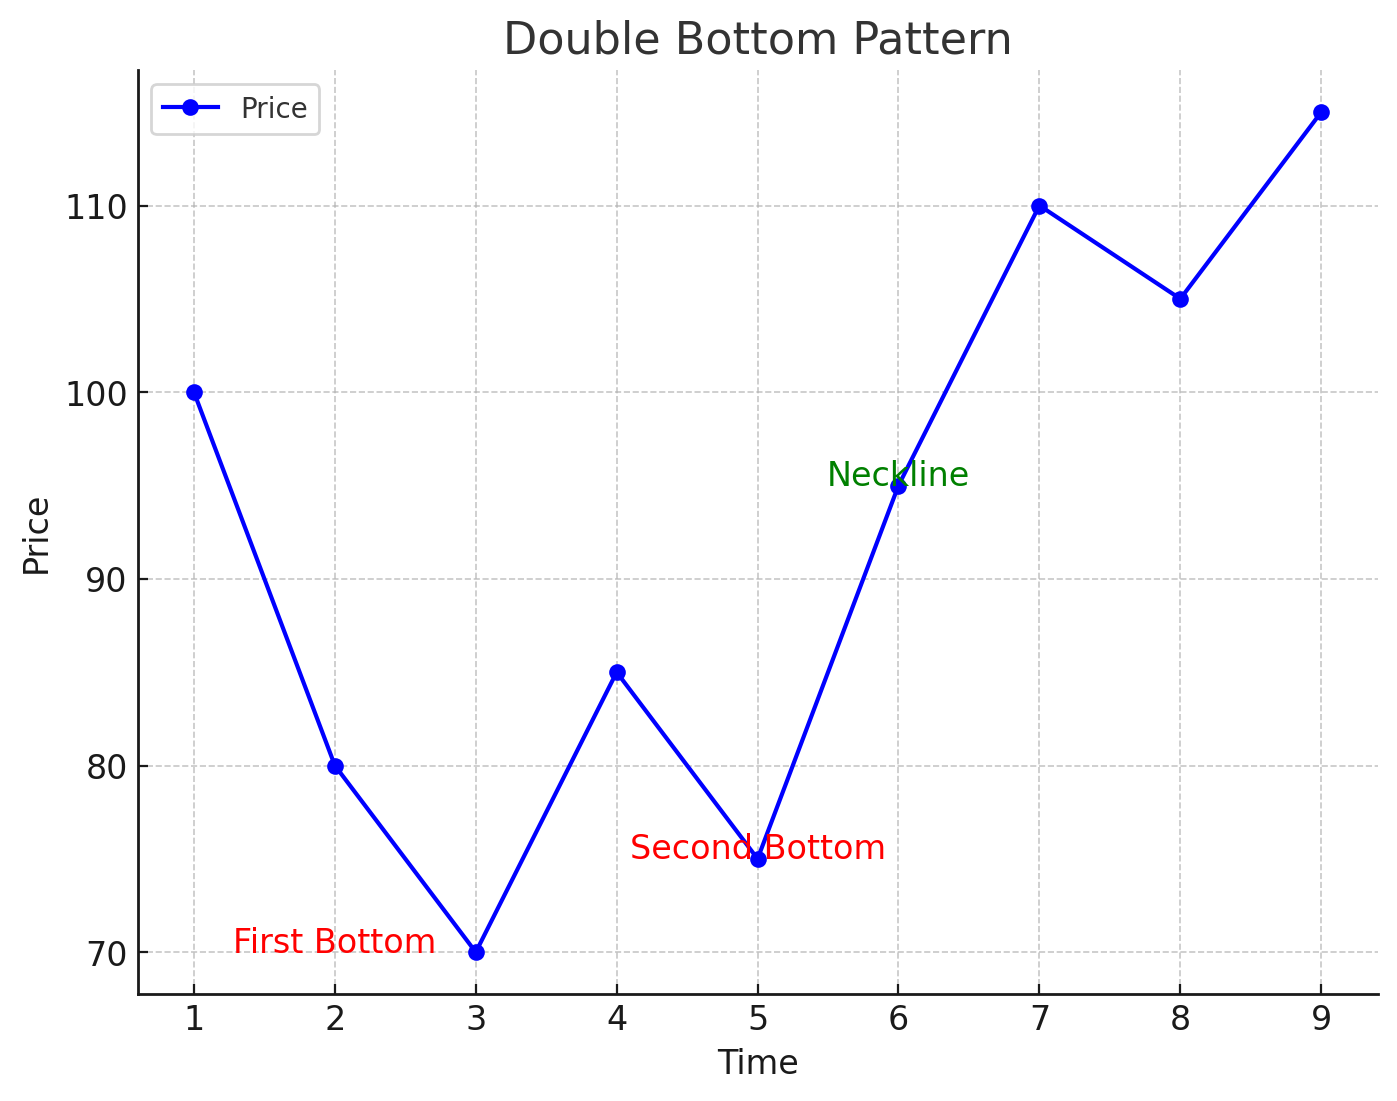
Double Bottom
A double bottom pattern is a bullish reversal pattern that forms when a stock or cryptocurrency makes two consecutive lows, followed by a rally.
Continuation Patterns
Continuation patterns indicate a continuation of the current market trend. These patterns can be used to identify a continuation of the current trend rather than a reversal. Some common continuation patterns include:
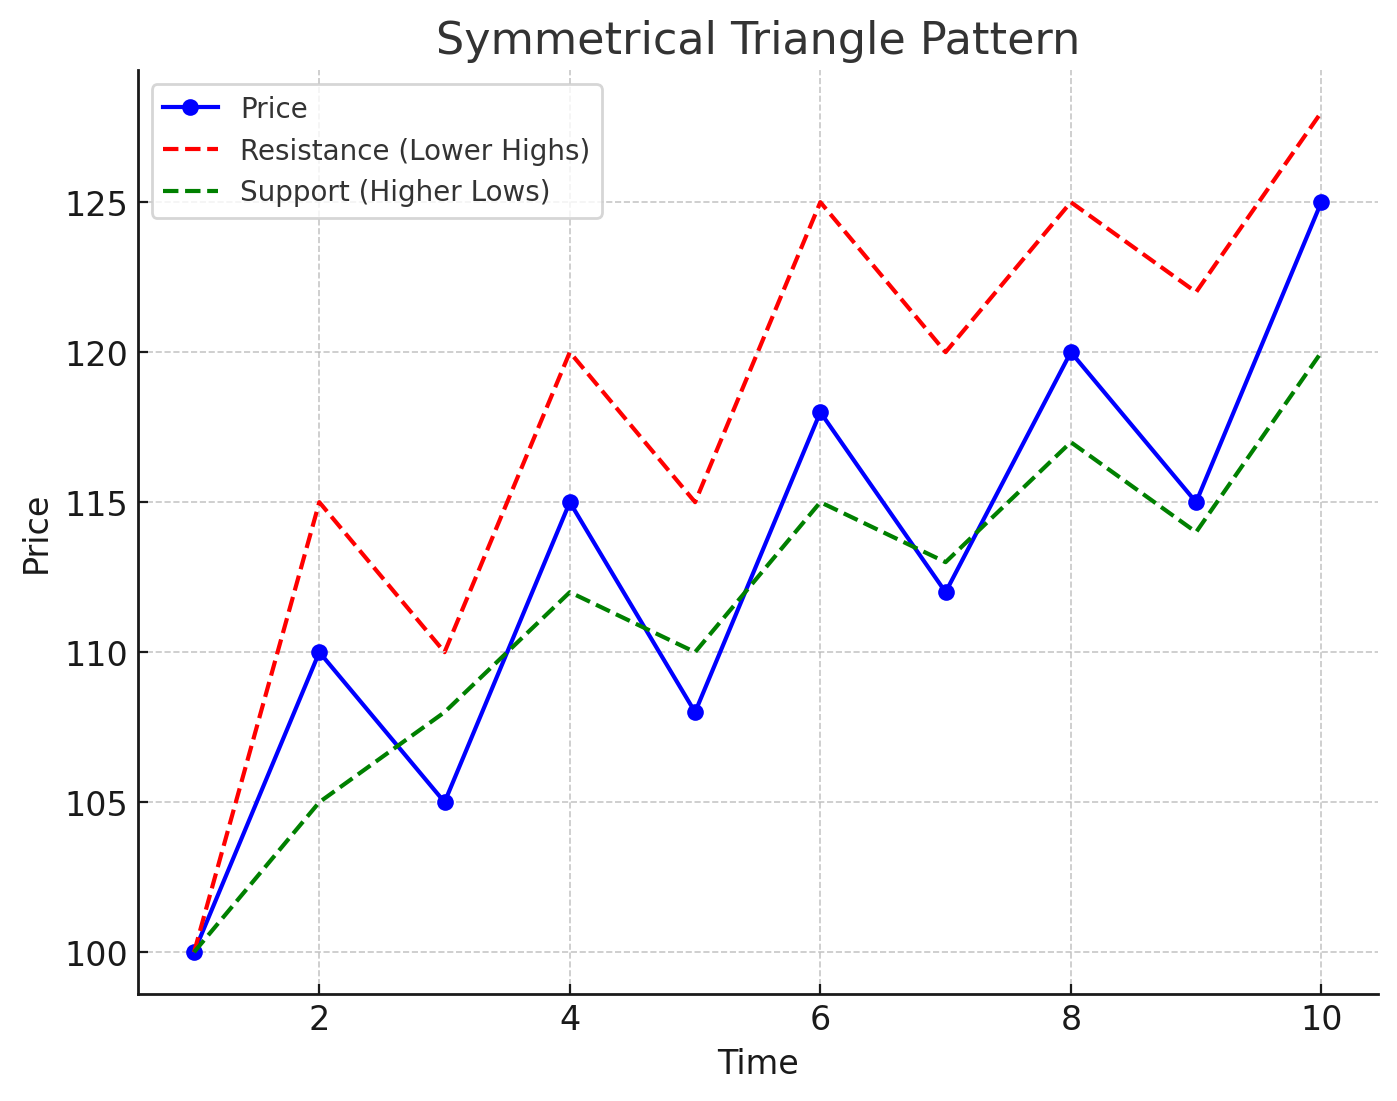
Triangles
A triangle pattern is a continuation pattern that forms when a stock or cryptocurrency makes a series of higher lows and lower highs, indicating a consolidation phase.
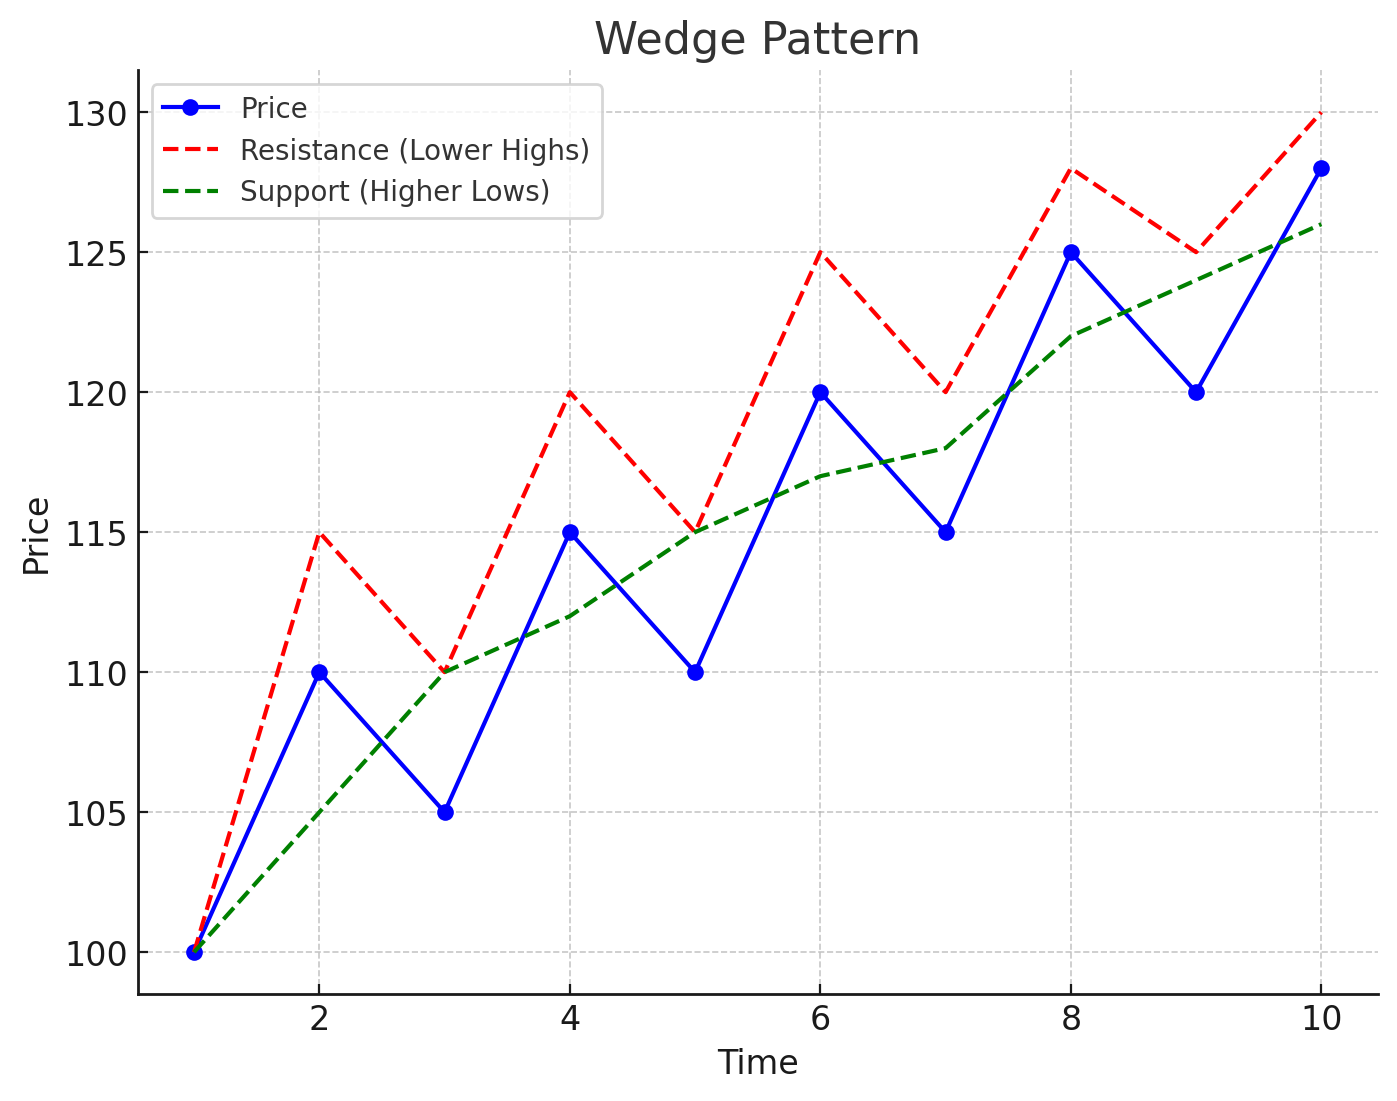
Wedges
A wedge pattern is a continuation pattern that forms when a stock or cryptocurrency makes a series of lower highs and higher lows, indicating a consolidation phase.
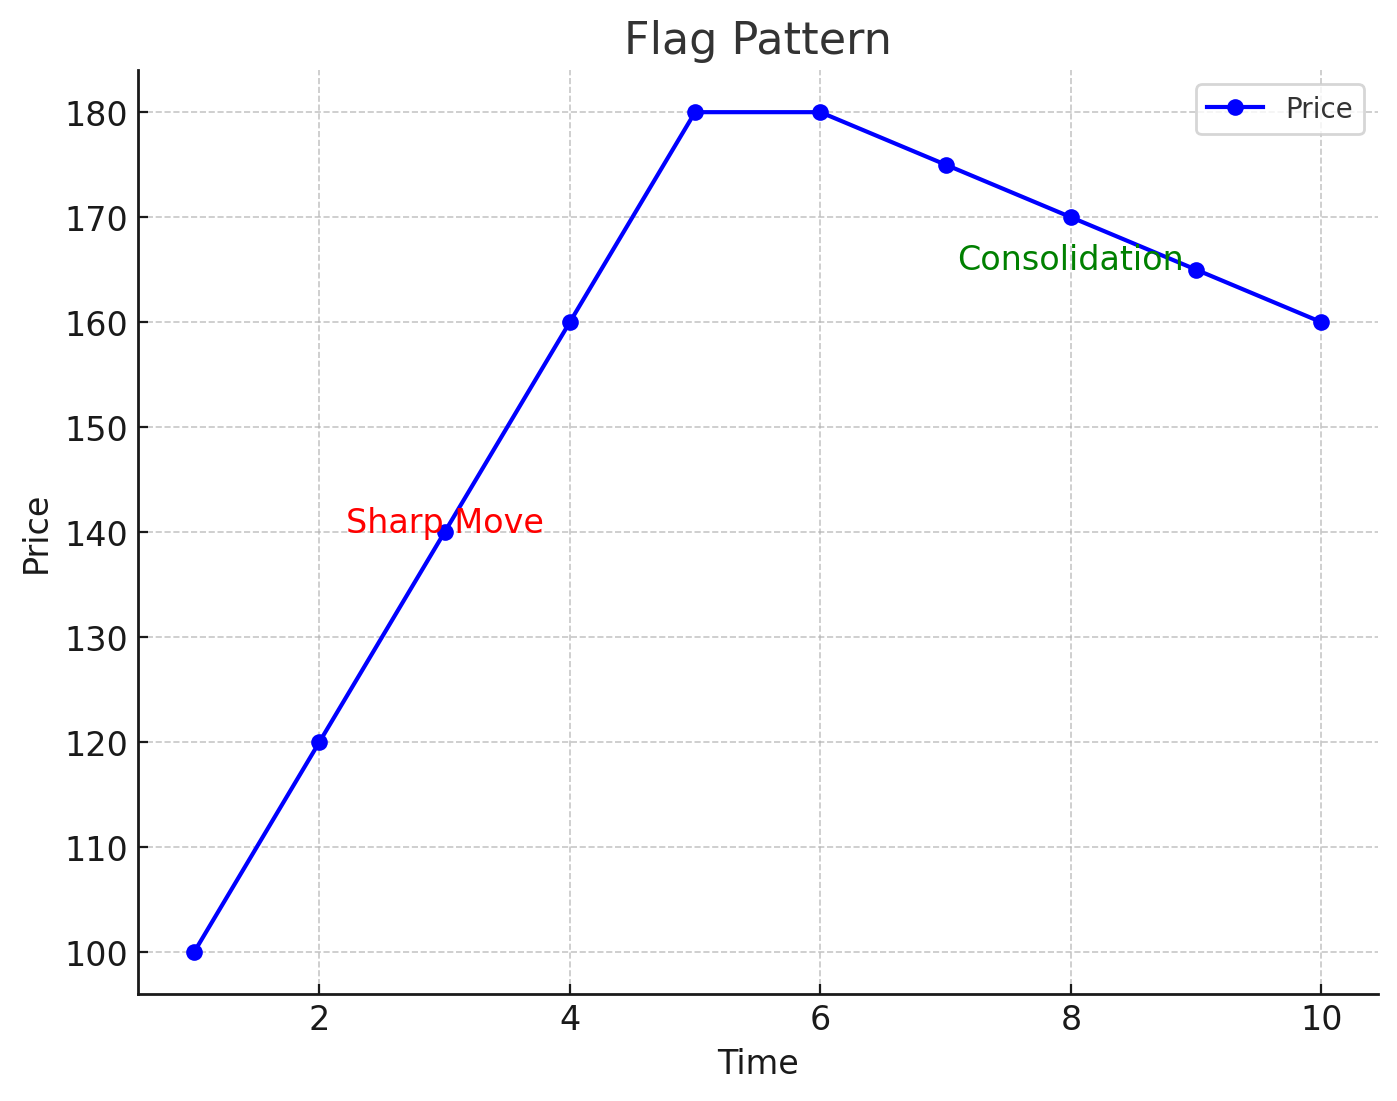
Flags
A flag pattern is a continuation pattern that forms when a stock or cryptocurrency makes a sharp move, followed by a consolidation phase.
Timeframes and Pattern Reliability
It’s important to note that chart patterns can form across various timeframes, from minutes to months. Generally, patterns that form over longer periods are considered more reliable predictors of future price movements.
“The longer the time frame of a chart, the more reliable the signals generated.”
– Martin J. Pring, Technical Analysis Explained.
Categories of Chart Patterns
Chart patterns can be classified into two main categories: bearish and bullish.
Bullish Chart Patterns
Bullish patterns suggest that the price of a cryptocurrency is likely to rise. Here are some of the most common and reliable bullish patterns to watch for:
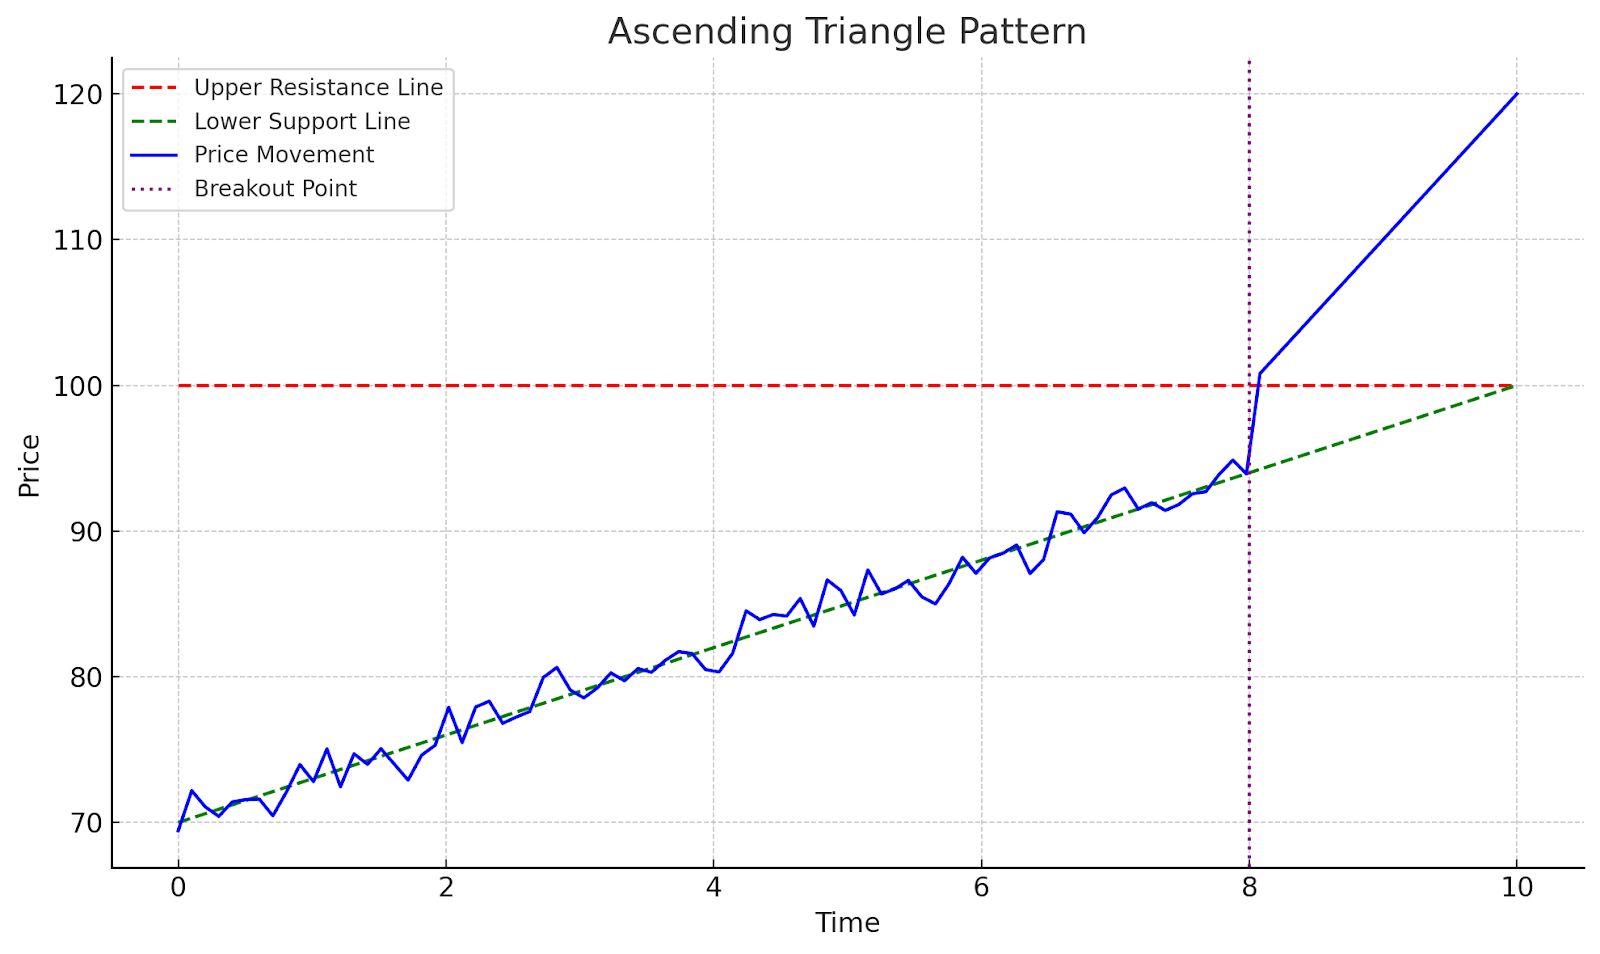
Ascending Triangle
The ascending triangle is a continuation pattern that usually forms during an uptrend. A flat upper resistance line and a rising lower support line characterize it.
How to identify:
- Look for a series of higher lows forming the lower trendline
- The upper trendline should be relatively flat, connecting a series of equal highs
- Volume typically decreases as the pattern forms
Trading strategy:
- Enter a long position when the price breaks above the upper resistance line
- Set a stop-loss just below the last swing low within the pattern
- Target a price move equal to the height of the triangle added to the breakout point
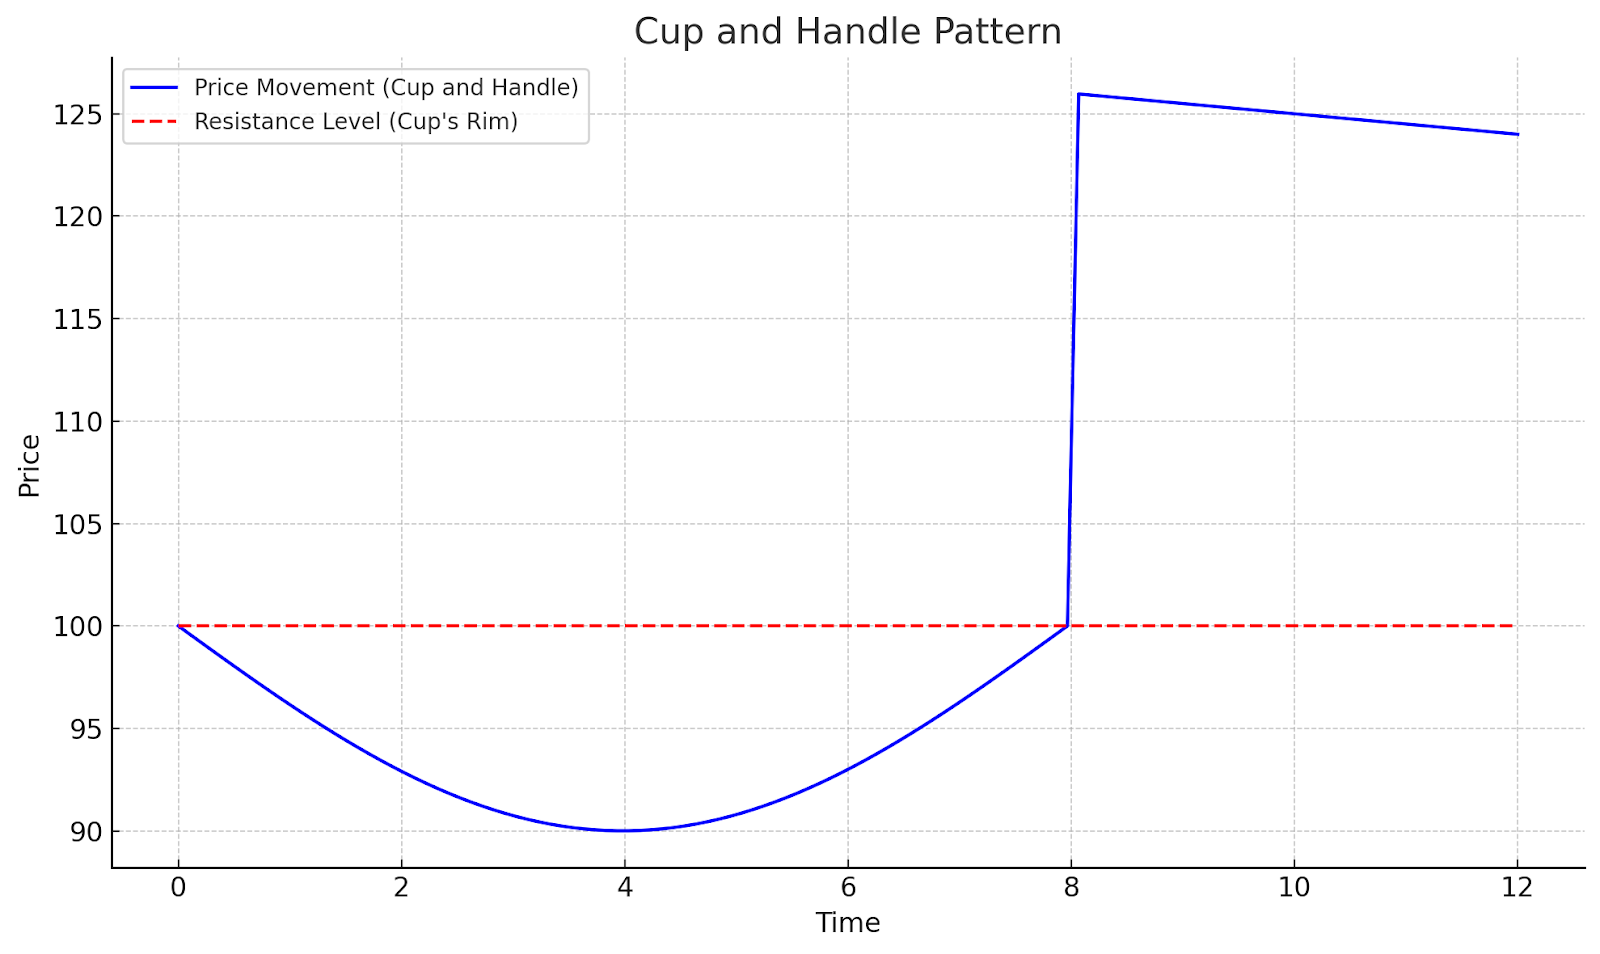
Cup and Handle
The cup and handle are bullish continuation patterns that resemble teacups on the chart. It consists of a rounded bottom (the cup) followed by a short downward trend (the handle).
How to identify:
- Look for a U-shaped price movement forming the cup
- The handle should form on the right side of the cup, sloping slightly downward
- The pattern typically takes several weeks to several months to form
Trading strategy:
- Enter a long position when the price breaks above the resistance level formed by the cup’s rim
- Place a stop-loss below the lowest point of the handle
- Set a price target equal to the distance from the bottom of the cup to its rim, added to the breakout point
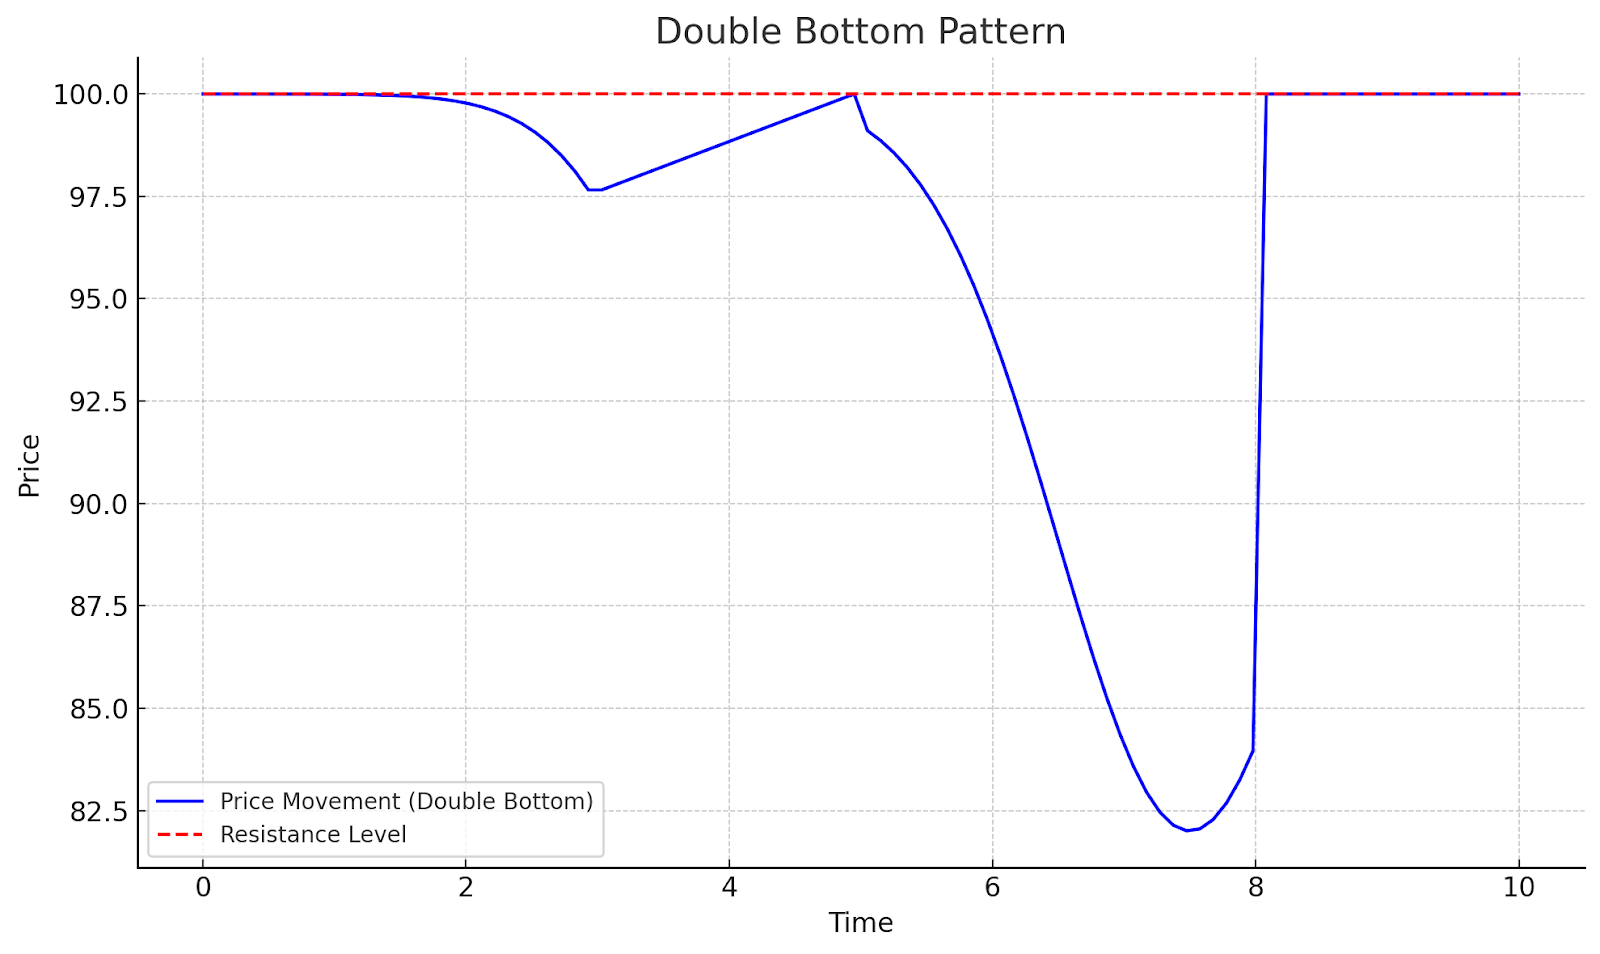
Double Bottom
The double bottom is a reversal pattern that signals the end of a downtrend and the beginning of an uptrend. It resembles the letter “W” on the chart.
How to identify:
- Look for two consecutive lows at approximately the same price level
- The second low should be slightly higher than the first, indicating weakening selling pressure
- Volume often increases on the second low and during the subsequent rally
Trading strategy:
- Enter a long position when the price breaks above the resistance level formed by the peak between the two lows
- Set a stop-loss just below the second low
- Target a price move equal to the distance from the bottom to the resistance level, projected upward from the breakout point.
Bearish Chart Patterns
Bearish patterns indicate that the price of a cryptocurrency is likely to fall. Here are some key bearish patterns to be aware of:
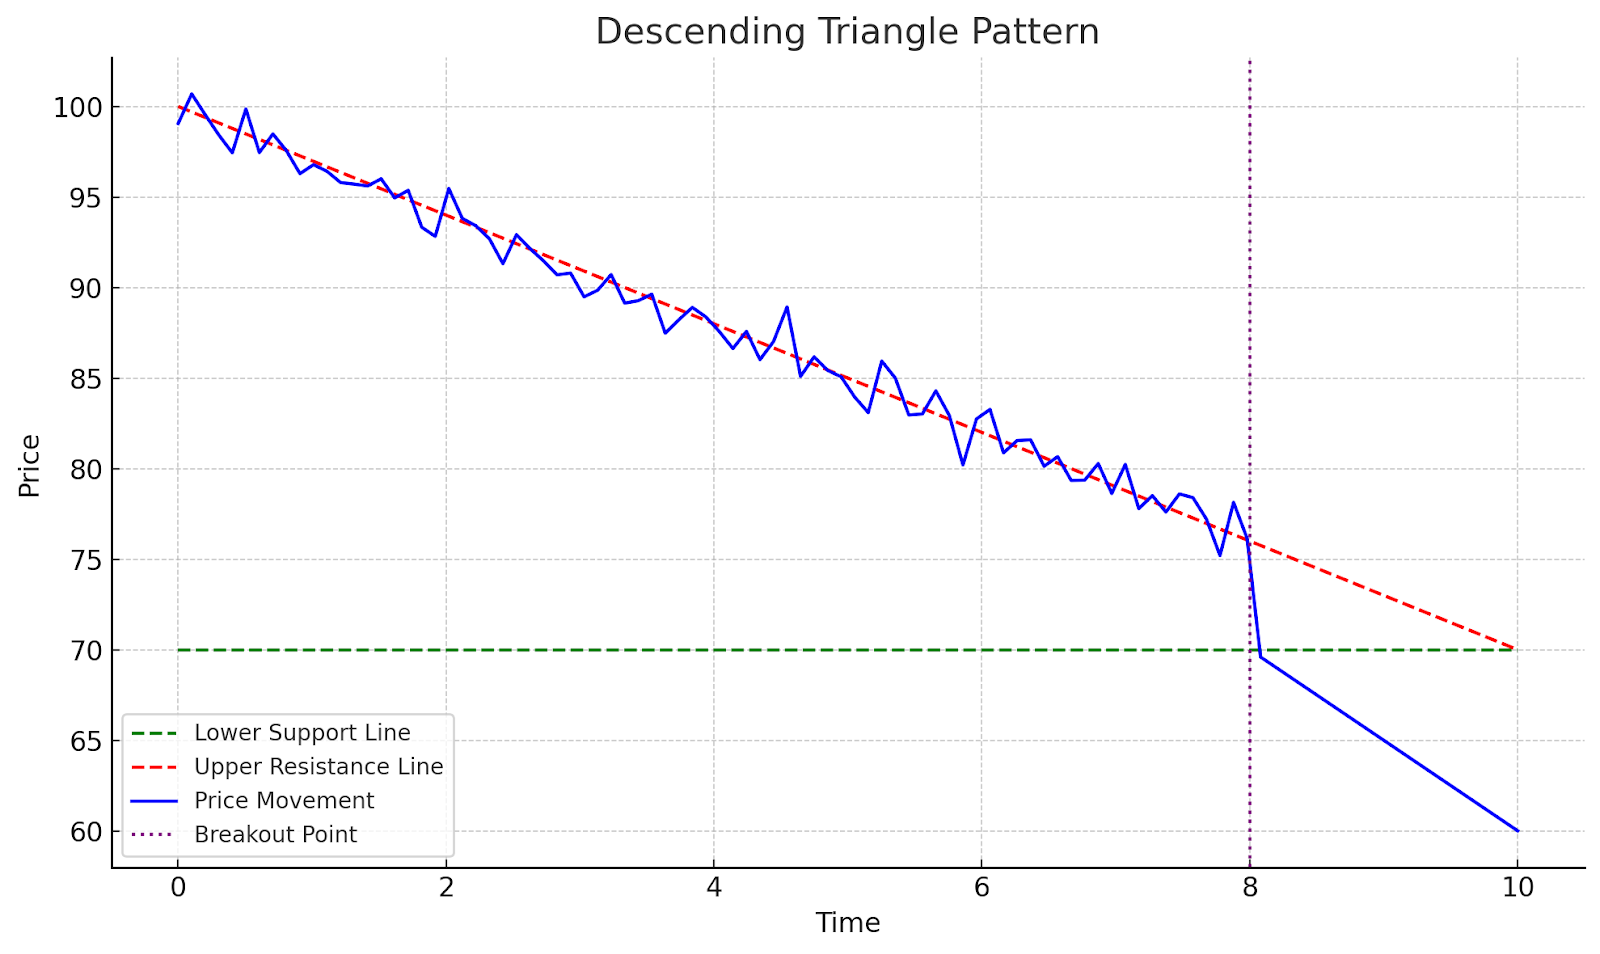
Descending Triangle
The descending triangle is a continuation pattern that typically forms during a downtrend. It’s characterized by a flat lower support line and a descending upper resistance line.
How to identify:
- Look for a series of lower highs forming the upper trendline
- The lower trendline should be relatively flat, connecting a series of equal lows
- Volume often decreases as the pattern forms
Trading strategy:
- Enter a short position when the price breaks below the lower support line
- Place a stop-loss just above the last swing high within the pattern
- Set a price target equal to the height of the triangle projected downward from the breakout point
Head and Shoulders
The head and shoulders pattern is a reversal pattern that signals the end of an uptrend and the potential beginning of a downtrend. It consists of three peaks, with the middle peak (the head) being higher than the two surrounding peaks (the shoulders).
How to identify:
- Look for a peak (left shoulder), followed by a higher peak (head), then another lower peak (right shoulder)
- The neckline connects the lows between the shoulders and the head
- Volume typically decreases as the pattern forms and increases on the breakdown
Trading strategy:
- Enter a short position when the price breaks below the neckline.
- Set a stop-loss above the right shoulder.
- Target a price move equal to the distance from the head to the neckline, projected downward from the breakout point.

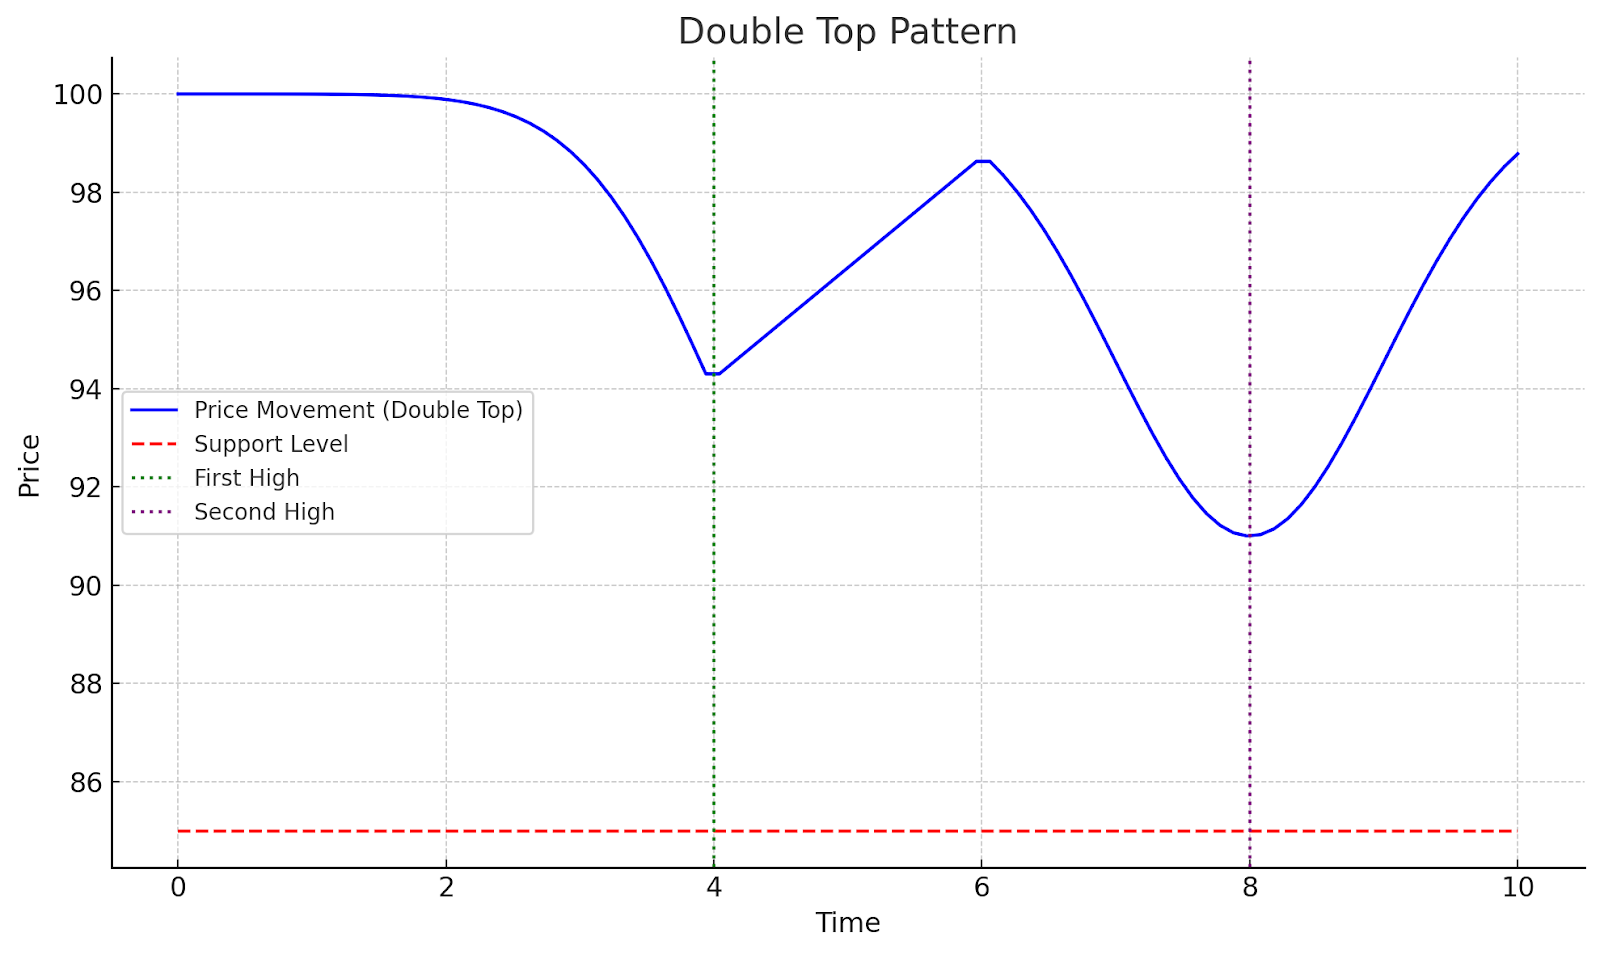
Double Top
The double top is a reversal pattern that signals the end of an uptrend and the potential beginning of a downtrend. It resembles the letter “M” on the chart.
How to identify:
- Look for two consecutive highs at approximately the same price level
- The second high should be slightly lower than the first, indicating weakening buying pressure
- Volume often decreases on the second high and increases during the subsequent decline
Trading strategy:
- Enter a short position when the price breaks below the support level formed by the trough between the two highs
- Place a stop-loss just above the second high
- Set a price target equal to the distance from the top to the support level, projected downward from the breakout point
Combining Chart Patterns with Other Technical Indicators
While chart patterns can be powerful tools on their own, combining them with other technical indicators can provide additional confirmation and improve the accuracy of your trading decisions.
Recommended reading: Choosing the Best Crypto Technical Analysis Course in 2024
Moving Averages
Moving averages can help confirm trend direction and potential support/resistance levels. For example, a bullish chart pattern forming above a rising 200-day moving average may be considered more reliable than one forming below it.
Relative Strength Index (RSI)
The Relative Strength Index (RSI) can help identify overbought or oversold conditions. A bullish chart pattern forming when the RSI is oversold (below 30) may signal a stronger potential for an upward move.
Volume
Volume plays a crucial role in confirming chart patterns. Generally, the volume should increase in the direction of the breakout to confirm the validity of the pattern.
“Volume is the fuel that drives the market. Without it, even the most beautifully formed patterns can fail.”
– Tom Bulkowski, Encyclopedia of Chart Patterns.
Risk Management in Crypto Chart Pattern Trading
While chart patterns can be valuable tools for predicting price movements, it’s crucial to remember that no pattern is foolproof, especially in the volatile cryptocurrency market.
Setting Stop-Losses
Always use stop-loss orders to limit potential losses if a trade moves against you. A common practice is to place stop-losses just beyond key support or resistance levels identified by the chart pattern.
Position Sizing
Determine the appropriate position size based on your risk tolerance and the specific risk-reward ratio of each trade. Never risk more than you can afford to lose on a single trade.
Confirming Breakouts
Wait for confirmation of a breakout before entering a trade. False breakouts are common, especially in the crypto market. Consider using a time filter (e.g., waiting for a daily close above or below the pattern boundary) or a percentage filter (e.g., requiring a 3% price move beyond the pattern boundary) to reduce the risk of false signals.
Recommended reading: Bitcoin Technical Analysis: A Comprehensive Guide
Conclusion
Chart patterns are powerful tools in the arsenal of crypto traders, offering valuable insights into market psychology and potential future price movements. However, it’s important to remember that chart patterns should not be used in isolation.
Combining pattern analysis with other technical indicators, fundamental analysis, and a solid understanding of market dynamics can greatly enhance your trading strategy. With time and dedication, you’ll find that chart patterns can become an invaluable part of your crypto trading toolkit.
FAQs
Yes, chart patterns can be reliable tools for cryptocurrency trading. While no method is 100% accurate, chart patterns have proven effective in predicting potential price movements in the crypto market. However, they should be used in conjunction with other forms of analysis for best results.
The most reliable chart pattern for crypto trading varies depending on market conditions and individual cryptocurrencies. However, patterns such as the head and shoulders, double tops/bottoms, and triangles are generally considered among the most reliable when properly identified and confirmed.
The time it takes for a chart pattern to form in the crypto market can vary widely. Some patterns may develop over a few hours or days, while others may take weeks or even months to fully form. Generally, patterns that form over longer periods are considered more reliable.
Chart patterns can be used for long-term crypto investing to help identify potential entry and exit points. However, long-term investors should also consider fundamental analysis, market trends, and broader economic factors when making investment decisions.
To improve your chart pattern recognition skills:Study historical charts to familiarize yourself with different patternsPractice identifying patterns in real-time market conditionsKeep a trading journal to track your pattern identifications and outcomesCombine pattern analysis with other technical indicators for confirmationStay updated on market news and events that may impact pattern formation and validity


")


