Chart patterns have been guiding traders for over a century, ever since Charles Dow and Richard Schabacker developed the foundational market theory. However, in the realm of crypto, price action unfolds in a much faster, round-the-clock environment, where traditional financial instruments can barely keep up.
While a Head and Shoulders pattern takes three to four months to consolidate on the S&P 500 and only takes three to four weeks to form on a Bitcoin chart, its subsequent breakout and resolution rarely follow a similar timeline.
Due to systemic derivative leverage and liquidation pressures, crypto-specific patterns and formations often resolve quicker than their traditional market counterparts by several orders of magnitude, meaning days or even hours for a typical crypto position to fully realize its price objective following a breakout.
Thus, the opportunities to profit from them are much narrower and often require execution at specific points within a developing price action scenario.
However, as all traders quickly learn, being able to identify developing patterns before they resolve is the only reliable way to profit from them. For crypto-specific markets, this means that traders are constantly trying to adapt their skill set to the unique demands imposed by the asset class’ unique characteristics.
In 2026, the structural properties of the crypto market changed for the second time within a year, again favoring institutional traders over retail ones. At any given time, centralized exchanges and derivatives represent over 75% of liquidity in crypto markets. Meanwhile, the institutional presence in the spot markets often depends on specific on-ramps and off-ramps used to transfer funds between fiat and crypto ecosystems.
Furthermore, the massive inflows of capital from the listing of the spot Bitcoin and Ethereum ETFs have smoothed out liquidity gaps of crypto assets, allowing for higher success rates of high-grade patterns compared to traditional finance.
In this article, you will learn to trade the 13 most reliable crypto patterns, including the precise mechanics for pattern-specific entries, stops, and targets. We will discuss how the 24-hour nature of crypto trading impacts volume dynamics, teach you to harness the power of AI scanners, and analyze real-world examples from the latest market cycle.
Join UEEx
Experience the World’s Leading Digital Wealth Management Platform
While some historical guides claim success rates above 70-80% for patterns like the Inverse Head & Shoulders, empirical crypto backtesting shows that the realistic probability of hitting a full measured profit target is closer to 50-60%.
Avoid trading on weekends and use only daily and 4h charts for pattern breakout trading. Volumes on Saturday/Sunday tend to be much lower, increasing the likelihood of fakeout breakouts.
Harness the power of human and advanced AI trading tools to scan for patterns across thousands of altcoins while maintaining strict risk management and stop-loss rules. TrendSpider and altFINS are great examples of such pattern-scanning tools.
What Are Crypto Chart Patterns?
Crypto chart patterns are graphical figures that appear on crypto price charts. They represent the aggregate buying and selling pressure on a particular asset, which means they reflect the forces of supply and demand. Understanding them enables traders to determine the best entry points and price targets for opening and closing trades.
Price charts represent the continuous interaction of market participants. Thus, each price movement reflects the psychology of traders, market makers, and institutional investors who speculate on the asset’s value. Every chart pattern is formed by the continuous struggle for dominance between buyers and sellers.
Support and resistance levels are the key price points within a chart pattern, which represent the collective psychology of market participants. Support is the price level at which buyers dominate sellers. This situation arises because some market players believe that the asset is undervalued, and purchasing it at this price is profitable.
Consequently, a considerable number of buyers enter the market, which pushes prices back up. On the other hand, resistance is the price level at which sellers exceed buyers. This happens when some market participants believe that the asset is overvalued, and they want to sell it to take profits or protect gains.
For this reason, bears drive prices down. Having understood how valuable support and resistance levels are, we take a closer look at the details of chart pattern formation.
How Do Crypto Patterns Differ from Those in Traditional Finance?
Even though chart patterns are universal, they manifest themselves differently in crypto than in traditional finance because of some critical differences.
First, there is no downtime in crypto trading, which impacts price movements and pattern formation. Second, crypto patterns are more volatile since the crypto market is unpredictable. Third, crypto patterns often experience extreme liquidity waves, especially during Asian and European trading sessions.
24-Hour Trading Activity
Unlike stock exchanges, crypto trading runs around the clock, with rare exceptions. This characteristic impacts such aspects of trading as liquidity waves, volatility, and chart pattern formation. Since there is no downtime, crypto price action rarely consolidates, creating a continuous wave of bullish or bearish trends.
As a result, chart patterns emerge and evolve faster than in traditional finance. Moreover, this round-the-clock activity creates liquidity waves, which are different for crypto exchanges in Asia, Europe, and America. For example, Asian traders are the first to react to news, but American exchanges are closed until the next trading day.
High Volatility
Crypto market volatility is significantly higher than that of traditional financial instruments. Hence, patterns often fail to hold on tighter ranges than their counterparts in the equity market. For instance, a typical bull flag in the stocks or major indices rarely retraces beyond the 38.2% level of the preceding impulse wave before resuming the uptrend.
However, in crypto, the formation often extends beyond the 50% Fibonacci retracement level and frequently beyond the 61.8% mark. Therefore, it is advisable to utilize wider stop-loss percentages in crypto trading compared to the traditional markets. Alternatively, traders can consider placing stops below major pivots on higher timeframes.
Algorithmic Trading
Crypto trading involves a substantial volume of algorithmic activity controlled by quantitative models. High-frequency algorithms and market makers often exploit retail technical analysis patterns by sweeping liquidity, which can make these formations significantly less reliable on lower timeframes.
Institutional algorithms analyze price charts to identify where retail stop-losses are clustered, often leading to “stop hunts” that resolve before the intended pattern direction manifests.
3 Main Types Of Crypto Chart Patterns
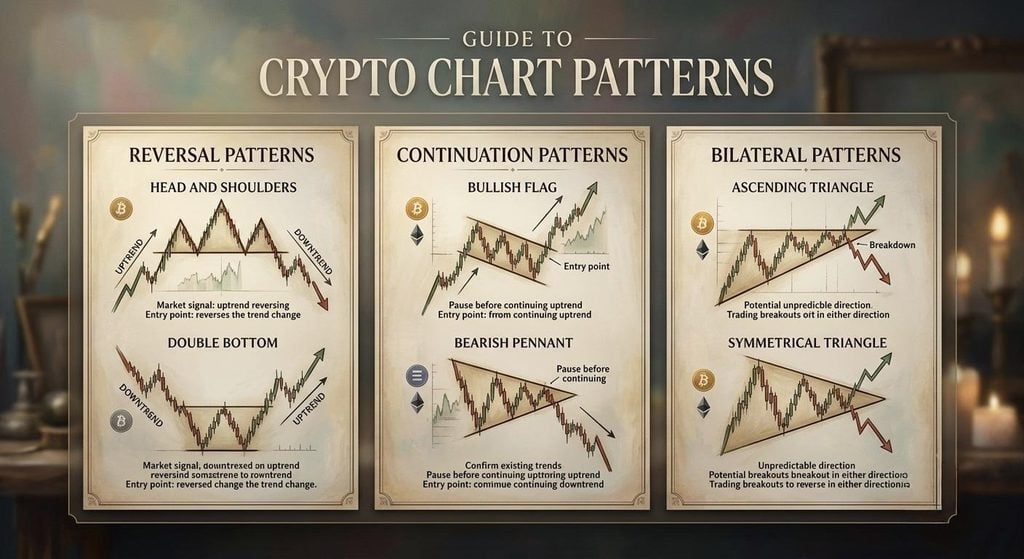
You can determine the fundamental factors influencing price action and choose the most effective strategies by knowing the primary categories of cryptocurrency patterns. Chart patterns are generally divided into three main types: reversal, continuation, and bilateral.
Three Main Types of Crypto Chart Patterns
Reversal Patterns: They indicate the possibility of a trend reversal and predict bearish or bullish movements. Examples of such formations are head and shoulders, double tops, double bottoms, rising wedges, and falling wedges. Reversal patterns suggest that the buying and selling pressures have changed places, so bears have taken over bulls, or vice versa.
Continuation Patterns: They mean that after consolidation, the price will continue to move in the direction of the ongoing trend. Examples of continuation patterns include bull and bear flags, pennants, and ascending triangles. Such formations occur when bears or bulls take a break and return to attack after the price consolidates.
Bilateral Patterns: Symmetrical triangles and rectangles are examples of bilateral patterns. They indicate that the market is in a state of indecisiveness and that a price breakout is expected, but the direction cannot be predicted.
The 13 Most Common Crypto Chart Patterns
1. Inverse Head and Shoulders
The inverse head and shoulders formation is one of the most reliable patterns predicting price movement in crypto trading. It consists of a head, left and right shoulders, and a neckline. The left shoulder is formed when pressure from bears pushes the price down to create a local price minimum, followed by a price increase and a reaction at the local maximum.
The head is formed by a stronger bearish movement, which pushes the price lower, followed by a price reaction at the local minimum. The right shoulder is formed by a weaker bearish wave, which creates another local minimum, followed by the price reaction at the local maximum. Finally, the neckline is formed by connecting two reaction lines at local maxima.
The inverse head and shoulders formation is a very strong indicator of a bull movement because it suggests that the bears are exhausted and unable to push the price lower. Thus, the buying pressure exceeds the selling pressure, pushing the price upward.
Usually, the entry point is determined by the daily or 4-hour candle closing above the neckline. The stop-loss is placed at 3-5% below the local minimum at the right shoulder. The target price can be calculated by measuring the distance from the head’s minimum to the neckline and adding it to the closing price of the candle, which determines the breakout.
2. Cup and Handle
The Cup and Handle formation consists of the cup and the handle. The Cup is formed by a smooth, gradual price decline followed by an equally gradual return to the previous level. The handle is formed by a consolidation, which is displayed by the price’s slow downtrend or a consolidation channel forming below the cup’s resistance.
The Cup formation means that bears are temporarily in control of the price, with institutions accumulating supply. Institutional buyers keep the price steady within a narrow range, eliminating weak bears. The handle indicates that bears are forcing the price down to shake out retail traders.
Traders should enter long when the price breaks out above the handle’s upper border or closes above the cup’s resistance level. The stop-loss order should be placed below the lowest point of the handle, and the target price should be set by measuring the vertical distance from the Cup’s lowest point to the resistance level and adding this distance to the breakout price.
3. Ascending Triangle
An Ascending Triangle formation is a bullish continuation pattern predicting a price breakout to the upside. The formation is characterized by a horizontal resistance level and an ascending support trendline intersecting at the apex of the triangle. The Ascending Triangle is formed when bulls push the price higher, but bears keep control of the situation, limiting price growth.
The Ascending Triangle formation reflects the bullish power struggle, where bulls keep pushing the price upward, but bears refuse to let the price exceed the horizontal resistance level. As a result, each wave of buying is met with strong selling pressure, pushing the price down to form higher lows.
For the Ascending Triangle, take a long position when a daily or 4-hourly candle breaches and closes above the horizontal level. Also, it makes sense to set the stop-loss order slightly below the lowest point of the pattern formation, not far from the most recent bottom. As for the profit target, you measure the widest distance between swing points on the lower side of the triangle and add this value to the breakout point.
4. Bull Flag
The Bull Flag is a bullish continuation pattern consisting of a sharp, high-volume upward advance (the flagpole) followed by a tight, downward-sloping consolidation channel (the flag). This consolidation represents temporary profit-taking by buyers and a lack of selling pressure, ideally retracing no more than 38% to 50% of the flagpole.
Traders should enter a long position when a candle breaks out and closes above the flag’s upper resistance line on surging volume. To manage risk, the stop-loss is placed just below the lowest low of the consolidation channel or the nearest higher low. The profit target is calculated using the measured move approach: calculate the vertical height of the flagpole and project that exact distance upward from the breakout point.
5. Head and Shoulders
A Head and Shoulders formation is a bearish reversal pattern predicting a trend change from bullish to bearish. It consists of three consecutive peaks: the Left Shoulder, the Head (the highest peak), and the Right Shoulder (a lower peak). These peaks are connected by a support line known as the Neckline.
The Head is formed by a stronger bullish wave that pushes the price to a higher peak, followed by a decline back to the neckline level. The Right Shoulder is formed by a weaker bullish wave that creates a lower peak than the head, followed by a price decline toward the neckline. Finally, the Neckline is formed by connecting the two reactionary lows.
The Head and Shoulders formation predicts a bearish trend, as bulls are unable to withstand the pressure from bears. Such a scenario is very common when institutional investors dominate the market and control price movements to maximize profits. Institutional players limit losses by taking profits with stop-loss orders, pushing the price down when the volume grows.
Traders should enter a short position when the price breaks and closes firmly below the neckline. A structural stop loss is placed just above the right shoulder peak for risk management purposes. The downside profit target is calculated using the measured move approach. You measure the vertical distance from the highest peak of the formation to the level of the neckline. Then subtract this distance from the neckline breakout price to arrive at the downside profit target level.
6. Descending Triangle
A Descending Triangle formation is a bearish continuation pattern associated with price consolidation within a narrowing range formed by a horizontal support level and a descending demand trendline intersecting at the apex of the triangle. The formation is formed by consecutive lower highs on the demand side and the horizontal supply level.
The Descending Triangle formation predicts bearish activity as bears continue to push the price lower, creating lower highs with every wave of selling pressure. Institutional investors control most of the trades in crypto, so they drive the price down to increase their profits. The presence of a horizontal supply level within the Descending Triangle indicates that some buyers are willing to purchase at this price.
On the other hand, bears dominate the market which is why they create lower highs to facilitate supply. Once the price breaks below the horizontal supply level, bears sell aggressively again. Traders should enter a short position when a daily or 4-hour candlestick breaks and closes firmly below the horizontal support floor.
To achieve a favorable risk-to-reward ratio, the profit target must be set based on the relationship between the target distance and the risk distance. While placing a stop-loss above the pattern’s lower high is standard for risk management, the final ratio is determined by the distance to the take-profit target relative to the entry and stop levels. The downside profit target is estimated by measuring the vertical height of the pattern at its opening base and subtracting this from the breakout price.
7. Double Top / Double Bottom
The “M-shaped” (Double Top) and “W-shaped” (Double Bottom) patterns of this chart type suggest an extreme in momentum. They depict two consecutive points or valleys tied together at a common horizontal level with a reactionary neckline in between.
A Double Top shows that bulls were unable to print a new peak despite their best efforts, while a Double Bottom shows that bears were incapable of pushing the price to a fresh low. The failure to surpass a key level provokes a wave of stop-losses from the counter-trend side, creating a powerful reversal.
It’s advisable to take the trade at the close of the high timeframe candlestick pierce through the structure’s neckline (the middle peak for the Double Bottom and the middle valley for the Double Top). Also, set your stop-loss above the two tops in case of a Double Top and below the two bottoms in case of a Double Bottom as the distance is commonly measured from the neckline breakout.
Avoid short-selling the second peak or go long on the second valley before the neckline breakout, which could lead to large drawdowns due to the aggressive reactionary move that happens right after.
8. Falling Wedge
The Falling Wedge is a classic bullish pattern built by two converging, downward-sloping lines. The resistance trendline is typically steeper than the support trendline. When appearing within a downtrend, it suggests seller exhaustion and a likely upward breakout. A long position is initiated after a candle closes above the upper descending resistance line.
9. Rising Wedge
It features a bearish pattern formed by two converging, ascending trendlines, with the lower trendline (connecting higher swing lows) steeper than the upper trendline (connecting higher swing highs). This pattern suggests that buying pressure is dissipating, with the bears slowly accumulating control over the instrument.
Professional traders take caution while counting on the upside breakout from the formation because it often acts as a trap set by retail bulls. Thus, a high-probability short setup is seen when there is a high timeframe candlestick close below the lower ascending trendline on higher volume.
10. Rectangle
The rectangle formation occurs when the price consolidates within the confines of a rectangular box, limited by a horizontal resistance connecting several consecutive peaks and a horizontal support connecting several consecutive valleys. This pattern suggests that the market is at an impasse, with neither bulls nor bears being able to gain control over the price.
In reality, this chart formation marks the accumulation phase for big whales and market makers, who use the range to buy at the bottom and sell at the top. Avoid trading the range mean reversion within the confines of the Rectangle because the middle of the box is a no-man’s-land, where little to nothing should be bought or sold.
11. Symmetrical Triangle
It’s a neutral formation that occurs when the price consolidates within the confines of a triangle, limited by a descending trendline connecting several lower highs and an ascending trendline connecting several higher lows. The market is at an impasse, with neither bulls nor bears being able to gain control over the asset.
Furthermore, buyers are pushing the price upward, while sellers are countering every bullish attempt. The price oscillates within the confines of two trendlines, with the trading range continuously shrinking until one side takes control and the price breaks out violently in one direction.
12. The Pennant
The pennant is a continuation formation that consists of a long, steep impulse higher or lower known as the flagpole, and a brief consolidation phase that sees the trendlines converge at almost an angle, limiting price action within a narrow range. The flagpole represents a rapid move driven by strong bulls or bears, while the consolidation represents a brief pause before the trend resumes.
Due to the short range and extremely short period of consolidation, these patterns are primarily found in fast-moving markets where the underlying trend has a powerful thrust and is therefore unlikely to reverse.
Traders should initiate a trade when a 4-hourly candlestick breaks out and closes beyond the identified level. For effective risk management, it makes sense to set a stop-loss order below the identified swing low (in case of long positions) or above the swing high (in case of short trades).
The main profit target is determined using the measured move principle, whereby traders measure the height of the pole (distance between the lowest and highest points) and then move up/down the same number of pips from the breakout point.
13. Diamond Top
It’s a complex and rare bearish reversal formation that almost exclusively appears at tops, particularly within cyclical markets.
It has two phases: a broadening phase, where the price consolidates within a widening range, printing higher swing highs and lower swing lows and forming an unstable diamond shape, and a contracting phase, where the price consolidates within a narrow range, printing lower highs and higher lows.
The first phase represents the weakening of the bulls and the strength of the bears, as the market becomes unstable. The second phase represents the bears accelerating and limiting the price action within an extremely tight range, restricting volatility and liquidity ahead of the institutional sell-off.
Crypto’s Trading Sessions And How They Differ From Traditional Finance
The crypto market does not follow the traditional hours of the stock exchange. It operates continuously throughout the day, week, or even month. As a result, pattern behavior is different because price formations emerge, resolve, and target their profit levels at a faster pace.
A key difference between cryptocurrencies and conventional financial instruments is that crypto exchanges operate 24/7, which amounts to 168 hours per week as opposed to 32.5 hours per week for a traditional stock market.
Therefore, the price structure formation time for crypto tends to be shorter than that of the S&P 500 index by 20-40 days on average, not because of higher liquidity, but rather leverage and volatility.
Also, a lot of traders focus on volume when estimating the health of a particular pattern. In traditional finance, the former is generally distributed in a U-shaped pattern throughout the trading day, with the vast majority of shares exchanged at the open and close of the session.
While this is partially true for crypto, with the former witnessing a spike at the opening of US equities, volume distribution in crypto is much more dynamic as it is driven by liquidation cascades, expiration dates of derivatives, and on-chain activity.
As such, weekends present a particular challenge for crypto traders when institutional desks close on Fridays, eliminating liquidity and creating opportunities for whale manipulation. This dynamic is known as “weekend trapping” and is particularly prominent in crypto because traders often erroneously interpret weekends as normal technical patterns, while in reality, they offer no liquidity and should be avoided.
Join UEEx
Experience the World’s Leading Digital Wealth Management Platform
The relentless, 24/7 nature of crypto means that massive, profitable breakouts routinely occur while you are completely offline. Automation bridges this gap, serving as a tireless sentinel that monitors the order books around the clock across dozens of exchanges simultaneously. Also, it strips away human emotion and the hesitation that ruins execution.
With institutional capital driving an estimated 70% to 80% of daily global cryptocurrency volume via quantitative and high-frequency algorithms, retail traders cannot compete on pure execution speed. However, deploying AI scanners helps retail participants bridge the analytical gap by automating pattern recognition across hundreds of pairs, systematically turning subjective chart reading into objective algorithmic alerts.
When working on crypto patterns, the modern trader needs a suite of scanners capable of rapidly identifying high-probability setups, minimizing the need for constant screen watching:
altFINS: The ultimate big-league technical analysis tool, actively scanning over 1000 altcoins for 26 different patterns across multiple time frames (from 15m to daily candles). Notably, it differentiates between forming patterns (the shape is still developing within the chart) and breaking patterns (actual breakout confirmation has occurred).
It also includes useful metric performance probabilities on the chart itself to help you quickly filter out low-success-rate patterns.
TradingView (Native Patterns and Pine Script): The world’s largest charting platform also features built-in pattern recognition algorithms that can detect and draw flags, wedges, triangles, and other standard formations with ease. This is the most flexible solution as one can use the community-driven pattern marketplace or write one’s own Pine Script code to scan for specific patterns with particular confirmation requirements.
TrendSpider & 3Commas – TrendSpider’s premier utility lies in its ability to automatically draw multi-timeframe trend lines, virtually eliminating guesswork in defining long-term support/resistance.
Combined with a crypto execution bot like 3Commas, you can set up an automated trading workflow where patterns are detected and trades are executed without further human input. Stop loss and take-profit levels can also be dynamically updated by the bot to help lock in maximum risk-defined rewards.
While being fast and objective, algorithmic analysis has its limitations. In practice, the best patterns to trade are often a mix of both automated and manual analysis, where the trader’s intuition serves to filter out “noise” and unnecessary patterns, allowing one to focus on the most high-value setups.
How to Trade Chart Patterns the Right Way: Top 10 Common Mistakes and Fixes
In crypto, it is not enough to simply know the theory behind chart patterns; you must also understand how to practically apply this knowledge in real-life scenarios. Here are 10 common errors that prevent pattern traders from realizing consistent profits, along with some fixes:
Placing Trades Too Early Before Pattern Completion
The Mistake:
Trying to anticipate breakouts by buying/selling before the pattern completes, hoping that it will resolve expectedly.
The Consequence:
Backtesting has shown that approximately 35% to 40% of would-be completed patterns fail to break out, “closing” back within the confines of the pattern and often trapping bullish traders in a short position or vice versa.
The Fix:
Never place a trade before the breakout confirmation candle has appeared and closed on a higher timeframe than you are trading. For example, if you are looking to buy the breakout of an ascending triangle with a resistance level at $98,000, it would be unwise to buy at $97,500 just because it looks “close enough” to the target. Instead, wait for the daily close above $98,000 before initiating the trade.
Placing Trades Without Considering Trading Volumes
The Mistake:
Treat all pattern breakouts equally, without considering the trading volumes printed by the asset on the breakout candle.
The Consequence:
Patterns with weak institutional support behind them (i.e., low trading volumes on the breakout day) often turn out to be fakeouts. Essentially, such patterns have a reduced chance (by 20-25%) of fulfilling their projected price move after breaking out due to insufficient liquidity.
The Fix:
Always use 50%+ surge above the 20-day EMA volume as a minimum volume requirement for a breakout trade. If the breakout candle printed weaker than average trading volumes, it is best to skip it, as there is a substantial chance (up to 25%) that the pattern will fail.
Using Low-Timeframe Charts for Pattern Analysis
The Mistake:
Looking for patterns on very low timeframes such as 1m, 5m, or even 15m charts.
The Consequence:
Such micro-charts tend to be noisy and full of false positives due to market manipulation and high-frequency trading. As a consequence, trades placed based on them tend to either fail outright or exhibit greatly reduced profitability due to unfavorable risk/reward ratios.
The Fix:
Stick to high-probability, higher-timeframe patterns such as daily or weekly ones and use 4h charts for actual trading. Patterns on 1h and lower timeframes should generally be avoided due to their increased risk of failure.
Confirmation Bias or “Forcing” Patterns
The Mistake:
Looking too hard at a certain chart configuration in an attempt to induce a pattern where none was evident before.
The Consequence:
Trades initiated from confirmation bias tend to exhibit greatly reduced success rates due to being subjective and unconfirmed. Additionally, they tend to have poor risk management characteristics due to being “unconfirmed” by the market.
The Fix:
Never place a trade based on a pattern that requires you to squint at the screen to see it or that disappears when you look at higher timeframe charts. If you have to make exceptions in judgment or ignore obvious bearish/neutral elements to see a pattern, it is best to skip it. After all, there are plenty of confirmed patterns to trade, so there is no need to gamble with questionable ones.
Moving Stop-Loss Orders in the Direction of the Trade
The Mistake:
Moving the initial protective stop-loss in the direction of the trade to “let profits run.”
The Consequence:
This is an objectively bad practice that significantly increases the risk of losing trades while reducing the risk of winning ones. By “letting profits run,” the trader exposes themselves to further losses if the market moves against them.
The Fix:
Always put your initial stop-loss at the entry point and adjust it from there. Never attempt to move it further away in an effort to increase potential profits – this only invites disaster. If you hit your stop-loss, accept the loss and move on. Remember – every trade has its risks, but good risk management ensures that they are minimized.
Overleveraging Futures Positions
The Mistake:
Using excessively leveraged (20x or higher) futures contracts to open a long/short position when a pattern indicates a price move.
The Consequence:
Given the extremely high volatility of crypto, such positions stand to lose much more ground during a retest than a normal unleveraged position would, potentially liquidating the entire futures portfolio with little to no opportunity to recoup losses.
The Fix:
Only use leveraged contracts (if at all) when trading highly reliable patterns with small stop-loss sizes. Even then, 3x or 5x leveraged positions are advisable at most. Another option is to use unleveraged spot positions when possible.
Buying Breakouts After the Fact (“FOMO” Entries)
The Mistake:
Initiating a long position after a breakout candle has already appeared on the chart, simply because one was “late” to the trade.
The Consequence:
Late entries to bullish patterns such as channels, triangles, or wedges tend to have much worse risk/reward ratios than ones placed at the breakout point. This is due to the increased likelihood of retests after the breakout has happened, as well as the potential presence of other market forces affecting the price.
The Fix:
If you missed the entry point of a breakout pattern, it is best to simply wait for the next opportunity. Trying to buy “at the bottom of the move” is generally a losing strategy, one that is best avoided in favor of waiting for the next suitable setup.
Ignoring Larger Market Conditions
The Mistake:
Trading long on an altcoin during a bear market or when Bitcoin is dropping, despite obvious signs of bearish distribution.
The Consequence:
Crypto tends to be a correlated market, with Bitcoin’s movements often dictating the movement of the entire market. As such, trying to go long on an altcoin during a BTC bear market is generally unwise, as most coins tend to drop during such periods as well.
The Fix:
Before initiating any trade on an altcoin, check Bitcoin’s movements as well as the Bitcoin dominance index to assess whether a bear market is currently underway. If it is, wait for Bitcoin to stabilize before initiating any long trades.
Trading Too Many Patterns at Once
The Mistake:
Trying to scan for and trade multiple patterns across dozens of different coins at once.
The Consequence:
Divided attention leads to mistakes, including missing obvious entry points, placing trades with larger-than-projected risk, and generally being unprepared for the market conditions at the time of the trade.
The Fix:
Stick to a few reliable patterns and a smaller number of coins to trade them on, focusing on larger, safer setups rather than numerous smaller ones. Doing so reduces the risk of error while increasing the chances of success.
Lack of a Take-Profit Strategy
The Mistake:
Having no plan for exiting a winning trade, therefore exposing profits to market fluctuations and volatility.
The Consequence:
A winning pattern with no exit strategy can just as easily turn into a losing one if not managed properly. This is especially true for crypto, where trends tend to be short-lived.
The Fix:
As discussed earlier, the use of measured move calculations to estimate projected profit is an invaluable tool when trading patterns. By calculating the mathematical expectation of a pattern, one can use it to set a strict take-profit target, thus locking in profits while limiting exposure to market fluctuations.
Join UEEx
Experience the World’s Leading Digital Wealth Management Platform
Placing Trades Too Early: Attempting to trade before the breakout candle has closed on the intended timeframe, which can result in being trapped if the price closes back within the pattern.
Ignoring Trading Volumes: Trading breakouts without checking volume; breakouts with weak volume (below 50% surge above the 20-day EMA) are significantly more likely to fail.
Using Low-Timeframe Charts: Relying on 1m, 5m, or 15m charts, which are often noisy and prone to false positives from market manipulation.
Confirmation Bias (“Forcing” Patterns): Attempting to see a pattern where none exists, which leads to subjective and unconfirmed trade entries.
Moving Stop-Loss Orders: Adjusting initial stop-losses in the direction of the trade to “let profits run” increases risk and exposure to losses.
Overleveraging Futures: Using excessive leverage (e.g., 20x) makes positions highly susceptible to liquidation during standard price retests.
Buying Breakouts After the Fact (“FOMO”): Entering positions after the breakout candle has appeared often leads to poor risk/reward ratios and increased risk of retests.
Ignoring Larger Market Conditions: Attempting to trade long on altcoins while Bitcoin is in a bear market or dropping, disregarding the correlation between assets.
Trading Too Many Patterns: Attempting to scan and trade numerous patterns across too many coins simultaneously leads to divided attention and execution errors.
Lack of a Take-Profit Strategy: Failing to establish an exit plan exposes profits to sudden market volatility, particularly in short-lived crypto trends.
Conclusion
Trading crypto chart patterns requires understanding the market psychology and turning it into a calculable statistical edge. In today’s market, it is increasingly difficult due to the increased presence of institutional money, spot ETFs, and algorithmic pattern recognition scanners. As a result, most of the old tricks no longer work as well as they used to, and the market moves at a much faster pace.
Nevertheless, the fundamentals of pattern trading remain the same: if you know your probabilities, volume requirements, and risk management rules, you will be successful more often than not. To estimate the success rates of the patterns in reality, it’s essential to remove our biases and calculate their performance from an empirical standpoint.
FAQs
1. What is the most reliable crypto chart pattern?
While many guides to pattern trading recommend using the Inverse Head and Shoulders or Cup and Handle formations with supposedly 80%+ win rates, crypto-specific backtesting suggests your chances of actually catching a completed move to the measured profit target are closer to 50-55%
2. Do chart patterns work in crypto?
Chart patterns work in crypto due to the same psychological and institutional pressures that shape the price action of traditional markets. However, the increased volatility, leveraged short selling, and liquidity fragmentation across exchanges all combine to create more opportunities for false breakouts in crypto, requiring extra scrutiny of volume and higher timeframe context compared to stocks.
3. How long does it take to learn chart patterns?
Learning chart pattern basics takes 2-4 weeks if one studies them every day. Learning to identify patterns on a chart takes 2-3 months of hard work and practice. Learning to trade patterns for profit takes 6-12 months of pattern study. You can accelerate the process if:
Start trading with paper money.
Keep a trading journal.
Learn to use scanners (altFINS).
Study historical patterns.
Most people need around 100-200 pattern trades to become consistent.
4. Should I trade patterns on 5- or 15-minute charts?
While the 5 and 15-minute charts are dominated by chaotic price action due to high algorithmic traffic, higher timeframes are not an assurance of 80%+ win rates either. Multi-year crypto backtesting reveals that patterns on daily, 4-hourly and weekly charts possess realistic target-achievement probability of 50-55%.
To maximize reward-to-risk, one should look for major patterns on higher timeframes (4H or Daily) and wait for a breakout confirmation close. Subsequently, lower timeframes (e.g. 1 Hour) should be used to enter trades on the breakout retest with maximum precision
5. What is the difference between reversal and continuation patterns?
Reversal patterns indicate that the price will reverse and move in the opposite direction. They usually appear at the end of a strong trend. Examples include head and shoulders, double top/bottom, wedges, etc.
Continuation patterns indicate that the price will continue the current trend after a consolidation period. They appear midway through a trend and have the shape of a flag or a pennant. Reversal patterns are generally harder to trade due to higher risks, while continuation patterns have better-defined entry and exit points.
Disclaimer: This article is intended solely for informational purposes and should not be considered trading or investment advice. Nothing herein should be construed as financial, legal, or tax advice. Trading or investing in cryptocurrencies carries a considerable risk of financial loss. Always conduct due diligence before making any trading or investment decisions.
Trade with proof of Reserves
UEEx publish monthly audits and third party verification on every listed market.