

The ability to spot market shifts before they happen is the difference between seizing opportunities or watching them slip away. Markets don’t move in one direction forever, at some point, those trends reverse, and if you can spot these changes early, you can make smarter trading decisions.
This is where trend reversal indicators come into play.
The trend reversal indicators serve as the traders’ compass, identifying key signals when markets are about to turn allowing you to adjust your strategy, avoid losses, and capture profits. Knowing how to read these signals empowers you to anticipate the market’s next move, rather than merely reacting.
Let’s explore how these indicators can decode market momentum and give you a good edge.
Key Takeaways
- Trend reversal indicators are technical tools that help traders anticipate when market trends will shift, allowing for timely adjustments in trading strategies to capture profits or avoid losses.
- Layering multiple indicators strengthens the reliability of reversal signals, helping traders avoid false signals and make more confident decisions.
- False signals occur when individual indicators generate misleading trends. Cross-referencing multiple indicators helps filter out these false signals, particularly in volatile markets.
- Trend reversal indicators not only help traders react to the market but also allow them to anticipate the next moves, providing a significant advantage in fast-paced trading environments.
What Are Trend Reversal Indicators?

Source: Freepik
Trend reversal indicators are technical tools that help traders identify when a market trend, whether bullish, bearish, or sideways, is about to change direction. By signaling potential shifts early, traders can capitalize on new trends or exit positions before the market turns against them, ensuring you’re not caught off guard.
Unlike trend-following indicators, designed to keep you in a trade as long as the trend continues, trend-reversal indicators focus on spotting those pivotal moments when the market starts to reverse.
Think of them as an early warning system that alerts you to act quickly and align with the new market direction.
The strength of trend reversal indicators lies in their real-time analysis, offering traders valuable insights as market shifts unfold. By recognizing these signals as they happen, you can position yourself for the new trend and avoid chasing the market too late.
5 Most Reliable Trend Reversal Indicators
Source: TradingView
“A well-chosen trend reversal indicator is like a trusted advisor, providing invaluable insights into the market’s intentions and helping to navigate its complexities.”
Here are the 5 most reliable trend reversal indicators that traders commonly use to anticipate market direction changes:
Moving Averages
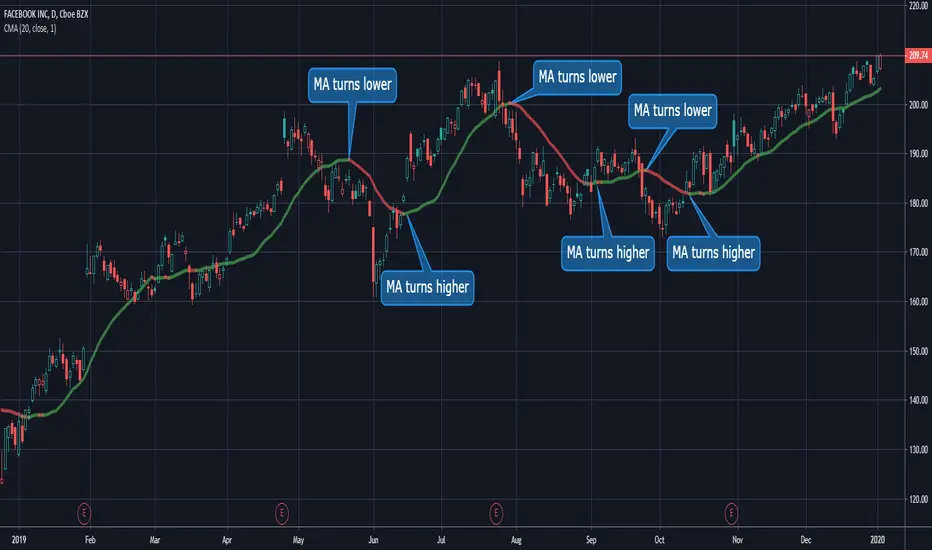
Source: TradingView
Moving averages are fundamental tools to identify trend reversals by smoothing out price action.
The Simple Moving Average (SMA) calculates the average price over a specific period, while the Exponential Moving Average (EMA) gives more weight to recent prices, making it more sensitive to market movements.
Traders often use crossovers to predict trend shifts. For example, if the 50-day SMA crosses below the 200-day SMA, it’s called a death cross and signals a potential bearish reversal. When the 50-day SMA crosses above the 200-day SMA, it’s called a golden cross and is a bullish reversal signal.
Using EMAs can provide more timely signals in fast-moving markets due to their sensitivity to recent price changes, making them useful for traders who want to catch early trend shifts.
Moving Average Convergence Divergence (MACD)
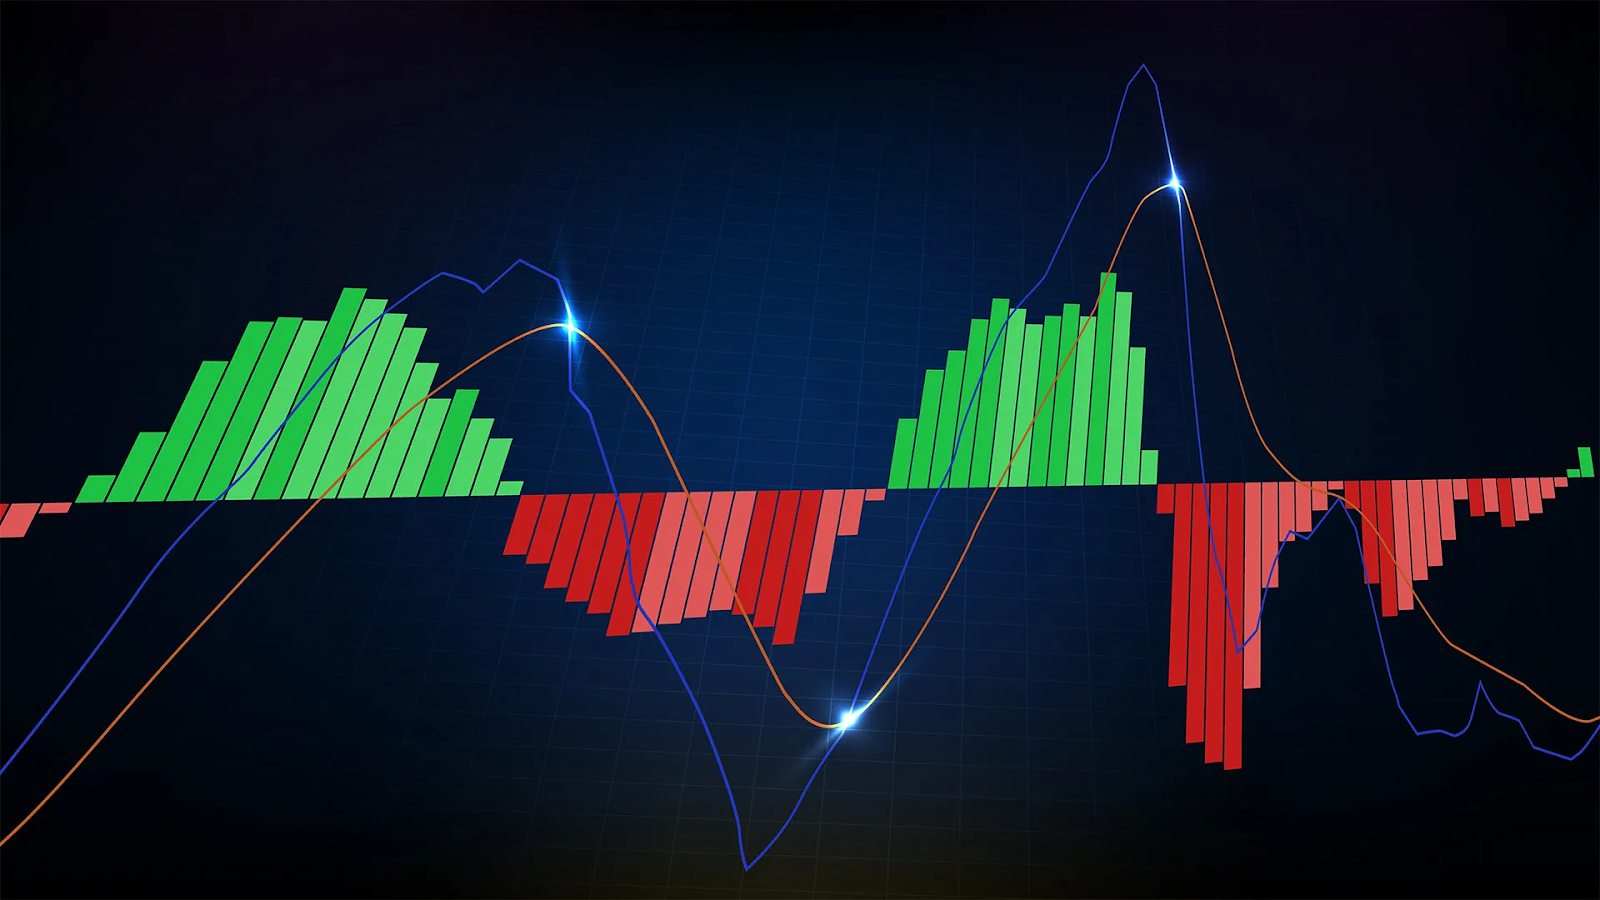
Source: Britannica
The MACD is one of the most popular trend reversal indicators, and it works by showing the relationship between two moving averages of a security’s price, typically the 12-day and 26-day exponential moving averages (EMAs).
The key signal for identifying reversals in MACD is the crossover.
When the MACD line (the difference between the two EMAs) crosses above the signal line (a 9-day EMA of the MACD), it signals a potential bullish reversal, meaning the market might start moving upwards.
When the MACD line crosses below the signal line, it indicates a potential bearish reversal, signaling that prices are about to drop.
Another powerful feature of MACD is its ability to detect bullish and bearish divergences.
A bullish divergence occurs when the price makes lower lows, but the MACD makes higher lows. It can be an early signal that selling pressure is weakening, and an upward reversal may be imminent.
Bearish divergence happens when prices make higher highs while the MACD makes lower highs, suggesting that upward momentum is fading and a downward reversal could follow.
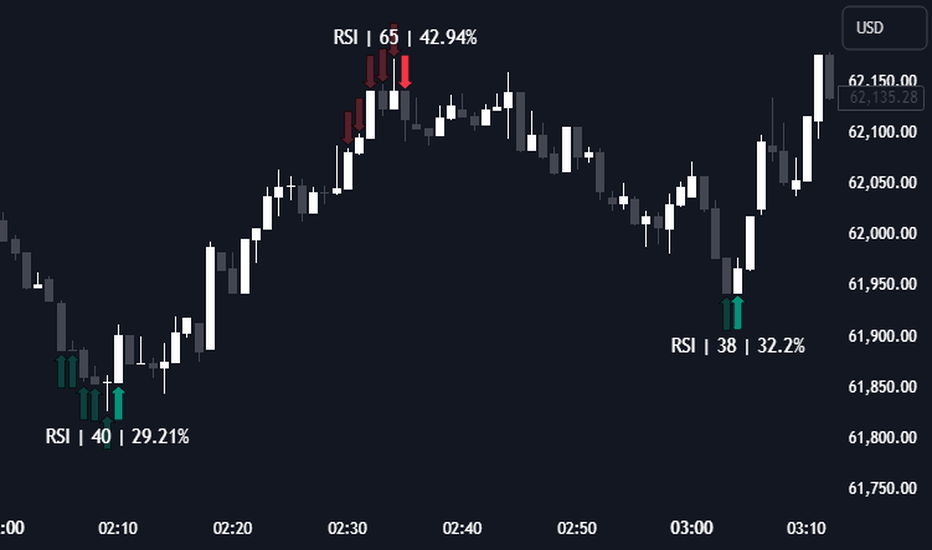
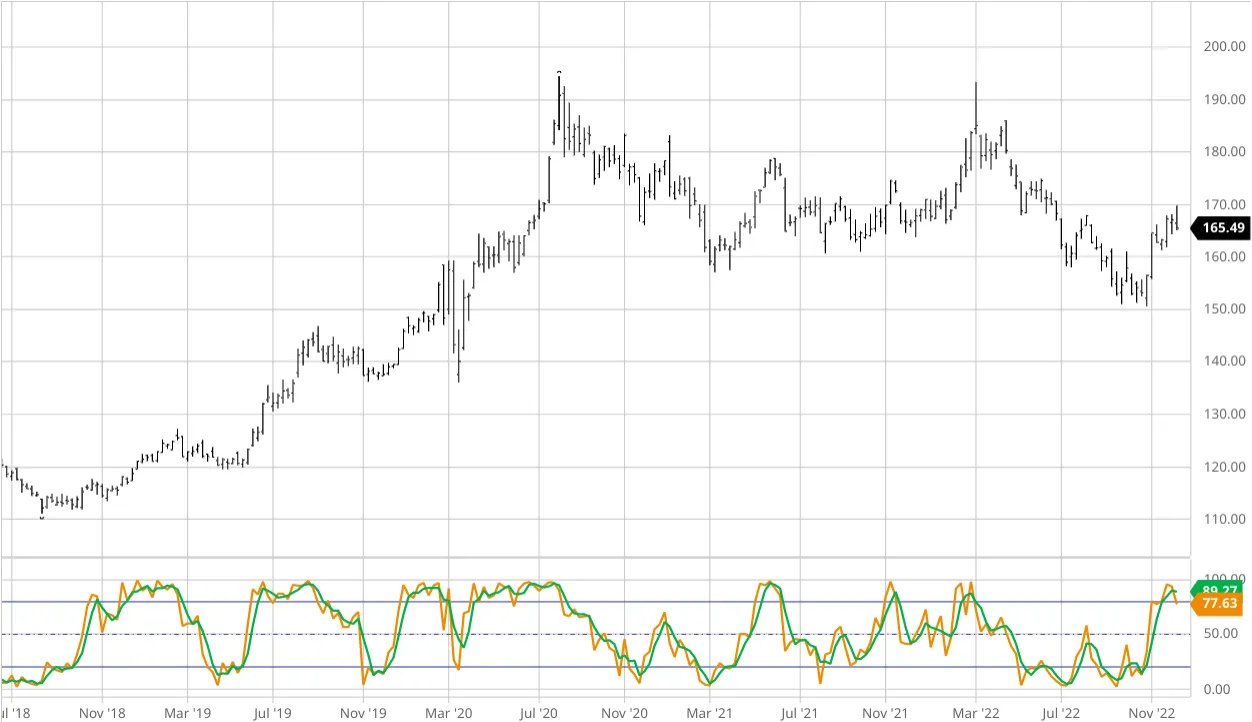
Relative Strength Index (RSI)
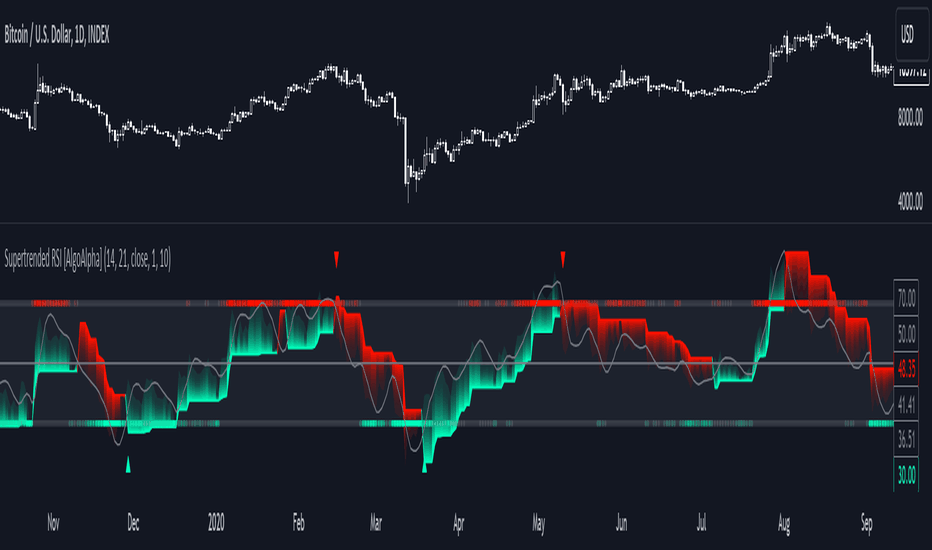
Source: TradingView
The Relative Strength Index (RSI) is a momentum oscillator that measures the speed and change of price movements on a scale of 0 to 100. It helps traders spot trend reversals by identifying whether an asset is overbought (over 70) or oversold (under 30).
When the RSI moves into the overbought zone (above 70), it indicates that the asset may be overvalued and a bearish reversal is likely. When it enters the oversold zone (below 30), it suggests the asset may be undervalued, signaling a potential bullish reversal.
The RSI is also a powerful tool for detecting divergences.
Bullish RSI divergence occurs when the price makes lower lows, but the RSI shows higher lows, signaling weakening selling pressure and a potential upward reversal.
Bearish RSI divergence happens when the price makes higher highs while the RSI posts lower highs, suggesting weakening buying momentum and a possible downward shift.
Stochastic Oscillator
Source: Britannica
The Stochastic Oscillator is another momentum indicator that compares a security’s closing price to its price range over a given period. It operates on a 0 to 100 scale, helping traders detect momentum shifts and trend reversals.
When the oscillator’s value is above 80, the market is considered overbought, signaling a potential bearish reversal. When it drops below 20, the market is viewed as oversold, suggesting a possible bullish reversal.
The Stochastic Oscillator’s timing is essential for trading as it also helps detect momentum shifts.
When the %K line (the actual oscillator value) crosses below the %D line (a moving average of %K), it indicates weakening upward momentum, and a reversal to the downside could follow.
A cross above the %D line signals potential upward momentum.
Fibonacci Retracement
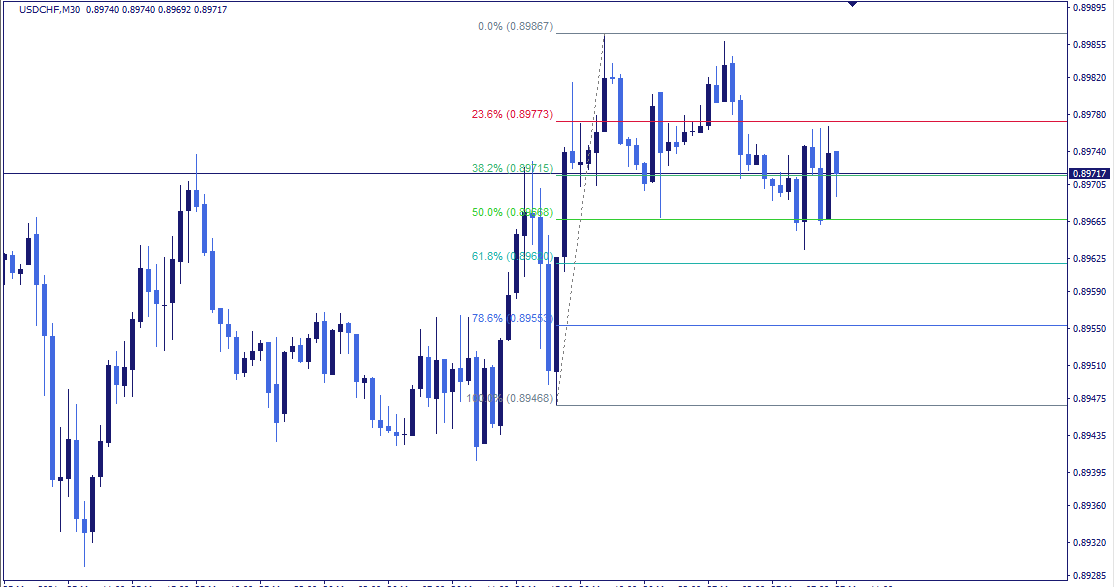
Source: Nordman Algorithms
The Fibonacci retracement tool is based on the idea that markets will often retrace a predictable portion of a move, after which they tend to continue in the original direction.
Fibonacci levels (such as 23.6%, 38.2%, 50%, and 61.8%) help traders identify potential reversal zones.
During a bullish trend, if the price pulls back to one of these levels and holds, it could indicate a resumption of the uptrend. In a bearish trend, if the price retraces to a key Fibonacci level and fails to break higher, it could signal the continuation of the downtrend.
To improve accuracy, traders often combine Fibonacci retracement with other indicators like MACD or RSI to confirm reversals and avoid false signals.
For example, if the price retraces to a Fibonacci level while also showing a bullish RSI divergence, it increases the likelihood of a reversal.
How to Combine Trend Reversal Indicators for Greater Accuracy
Source: iStock
Indicators work best when they complement each other. While one indicator may signal a possible reversal, confirmation from other indicators strengthens the reliability of the signal.
This layered approach helps traders act more confidently and avoid a trade’s premature entry or exit.
Here are a few example setups that demonstrate how to combine trend reversal indicators:
MACD + RSI: Look for bullish MACD crossovers alongside RSI below 30 (oversold condition). This combination is a strong reversal signal, especially when the MACD line crosses above the signal line while RSI shows oversold, indicating the momentum is shifting upwards.
Stochastic Oscillator + Fibonacci Retracement: If the Stochastic shows an overbought condition and the price reaches a key Fibonacci retracement level, it indicates a likely bearish reversal.
Moving Averages + Fibonacci Retracement: When the price reaches a Fibonacci retracement level (e.g., 61.8%) and crosses a 50-day EMA, it indicates that the retracement may be over, signaling a reversal back into the original trend.
“The key to successful trading is not just knowing the indicators, but also understanding how to use them in combination with other factors.”
Why False Signals Happen
When individual indicators are used in isolation, they often generate false signals, especially in volatile markets.
For example, the RSI may hit overbought conditions, suggesting a bearish reversal, but the price could still rise if the trend is strong. A moving average crossover might signal a reversal, only to be followed by a brief consolidation rather than a full trend reversal.
Cross-verifying with other indicators can filter out these false signals.
For example, MACD alone might give you a bullish crossover, but if the RSI remains in overbought territory, it suggests that the market hasn’t fully reversed, and you should wait for stronger confirmation.
If a Stochastic Oscillator shows an overbought signal, but prices remain above a key moving average, you might avoid prematurely selling.
Techniques for Identifying Trend Reversals
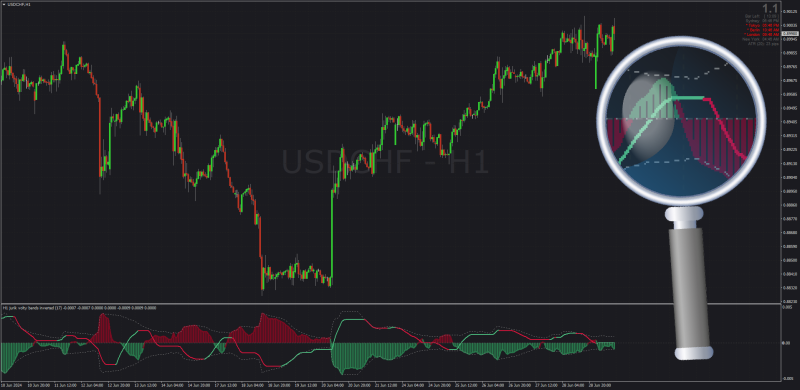
Source: Forex Station
“The true power of trend reversal indicators lies in their ability to reveal patterns and relationships that may not be immediately apparent to the naked eye.”
Identifying trend reversals is one of the most important skills in trading, as it enables traders to exit before a trend ends and enter early into a new one.
Here are three advanced techniques that can significantly increase your ability to spot these reversals:
Divergence
Divergence occurs when price action doesn’t align with indicator movements, signaling a potential trend reversal. There are two main types: regular and hidden divergence.
- Regular Divergence: Indicates trend reversal. For example, if the price makes higher highs but the indicator forms lower highs, momentum is weakening, signaling a possible trend reversal.
- Hidden Divergence: Suggests trend continuation. When the price forms higher lows, but the indicator shows lower lows, the existing trend may continue but could eventually reverse.
Combine divergence signals with other tools like moving averages for better accuracy.
The Role of Volume in Confirming Reversals
Volume is important in confirming potential reversals by reflecting the strength behind price moves.
- Volume Spikes: High volume at key levels (support or resistance) often indicates strong participation, confirming a reversal.
- Volume Divergence: If price rises while volume declines, it signals a weakening trend and a potential reversal.
- Volume Breakouts: High volume during a breakout is a good indicator of a sustained trend, while low volume signals a possible false breakout and upcoming reversal.
Always confirm volume patterns with other indicators to avoid false signals.
Multi-Timeframe Analysis
Multi-timeframe analysis helps traders identify early reversal signals by analyzing trends across different timeframes.
Zoom In and Out: Use higher timeframes (daily/weekly) for trend direction, and lower timeframes (4-hour/1-hour) for more precise entries. To do this:
- Identify the major trend on a higher timeframe to understand the broader market movement.
- Spot early reversals on lower timeframes to catch momentum shifts.
- Confirm signals across multiple timeframes with indicators like MACD or RSI.
Aligning signals across timeframes improves the accuracy of trend reversal predictions.
How to Adjust Strategies When Trends Consolidate
Trend consolidation occurs when a market pauses or moves sideways after a strong trend, often forming a range-bound pattern where the price fluctuates between support and resistance levels.
During this phase, it’s uncertain whether the market will reverse or continue in the previous direction.

Source: Freepik
These strategies are valuable during consolidation:
Patience and Confirmation
“Always be patient and wait for the right setup before entering a trade.”
It’s tempting to jump into trades during consolidation, but acting too quickly can result in losses if the market fakes out or fails to reverse. Here’s what you should do:
Wait for a Clear Breakout or Breakdown: Trend reversals often happen after the price breaks out of the consolidation zone, either above resistance (indicating a bullish reversal) or below support (indicating a bearish reversal). Use moving averages, MACD, or RSI to confirm the breakout or breakdown before committing to a position.
For a bullish reversal, wait for the price to break above the consolidation zone’s resistance and confirm with indicators like RSI moving out of the oversold territory.
For a bearish reversal, look for the price to break below the support level and confirm with a bearish MACD crossover or a declining stochastic oscillator.
Avoid Premature Entries: Consolidations often generate false signals. For example, prices may briefly break out, only to quickly retreat into the range. Use volume indicators or wait for multiple candles to close outside of the consolidation zone to confirm the direction of the breakout.
Use of Support and Resistance Levels
Consolidation patterns often form within well-defined support and resistance zones, where the price fluctuates in a range. These zones are essential in identifying potential reversal points.
Identify Key Support and Resistance: Prices often bounce between these levels during consolidation. A break above resistance can indicate a bullish reversal, while a break below support suggests a bearish reversal.
In a bullish signal, when the price consistently tests the resistance line and fails to break it, this could signal an upcoming reversal. Once resistance is broken with confirmation, enter a long position. For a bearish signal, frequent tests of support without a breakout upward can hint at a bearish reversal.
Monitor Volume for Added Confirmation
Volume is an essential indicator when markets are consolidating. A reversal is more likely if you see increasing volume alongside price movements out of the consolidation range.
For a bullish reversal, if the price breaks above resistance with a spike in volume, it suggests that buyers are stepping in to push the market higher. For a bearish reversal, a breakdown below support with rising volume confirms that sellers are taking control, signaling a bearish reversal.
If volume is low or decreasing, the breakout or breakdown is likely to be a false signal.
Multiple Time Frame Analysis
Consolidation on one-time frame may hide important trends on other time frames. Use multiple time frame analysis to align your strategy with broader market movements.
- Zoom Out for Context: If a 15-minute chart shows consolidation, look at a 1-hour or daily chart to see if the broader trend is reversing. A short-term consolidation may be part of a larger reversal trend, providing better entry opportunities.
- Check for Divergences: Divergences across time frames can indicate potential reversals. For example, if a daily chart shows a weakening trend while shorter time frames are consolidating, this could signal an upcoming reversal.
Adjust Position Sizing for Volatility
Consolidation often leads to volatility spikes once the trend resumes. During consolidation, it’s wise to reduce position size to manage risk and minimize exposure to false breakouts or breakdowns.
Smaller positions during consolidation help protect against losses from false reversals. Also, once a clear trend reversal is confirmed through your indicators, you can increase your position size to take advantage of the new trend.
Conclusion
Trend reversal indicators serve as important tools in helping traders identify key moments when the market is about to shift direction. The ability to anticipate these reversals enables you to lock in profits and protect you from being caught on the wrong side of the market.
Combining your technical skills with a deeper understanding of the market context is important for making informed decisions. This means paying attention to economic factors, market sentiment, and global events that can impact price movements.
FAQs
Can trend reversal indicators guarantee accurate predictions?
No indicator guarantees 100% accuracy. Trend reversal indicators are designed to highlight potential changes in market direction, but false signals can occur, especially in volatile or consolidating markets. This is why traders are advised to combine multiple indicators (like RSI, MACD, and volume) to confirm a reversal and avoid relying on one signal alone.
How does volume play a role in confirming trend reversals?
Volume is a key element in validating trend reversals. A price reversal accompanied by increased volume is more reliable because it indicates strong participation from traders, supporting the shift in market sentiment. Conversely, a price reversal on low volume may suggest a lack of conviction and could be a false signal.
Can trend reversal indicators be used in all types of markets (e.g., stocks, crypto, forex)?
Yes, trend reversal indicators can be used across different asset classes, including stocks, crypto, forex, and commodities. Market behavior, such as momentum shifts and price trends, is consistent across all financial markets, making indicators like MACD, RSI, and moving averages universally applicable. However, some assets, like cryptocurrencies, tend to be more volatile, requiring traders to fine-tune their strategies or use more aggressive risk management.
Are trend reversal indicators effective in short-term trading (scalping/day trading)?
Yes, trend reversal indicators can be effective in short-term trading, but they require quick decision-making and precision. Shorter timeframes amplify market noise, increasing the risk of false signals. To mitigate this, short-term traders often rely on faster indicators (like Stochastic Oscillator or short-period moving averages) and use multi-timeframe analysis to spot reversals early while confirming signals from higher timeframes to increase accuracy.


