Support levels are price points where buying pressure is strong enough to halt a price decline and trigger a rebound. Resistance levels are price points where selling pressure is strong enough to halt a price rise and trigger a pullback. Together they form the foundation of technical analysis: understanding where other market participants have historically placed buy and sell orders helps anticipate future price behaviour with greater accuracy.
Key Takeaways
Support and resistance levels are price zones where buying or selling pressure has historically been strong enough to halt and reverse price movement. Identifying them accurately improves entry, exit, and stop-loss placement.
Using multiple methods simultaneously to identify the same level creates a confluence zone: a price area confirmed by horizontal levels, Fibonacci retracements, moving averages, or volume nodes all pointing to the same price. Confluence zones are the strongest and most reliable levels to trade.
Volume is a critical confirmation tool. High trading volume at a level indicates strong market interest, making the level more likely to hold on a re-test. Breakouts accompanied by surging volume are more likely to be genuine than low-volume moves beyond a level.
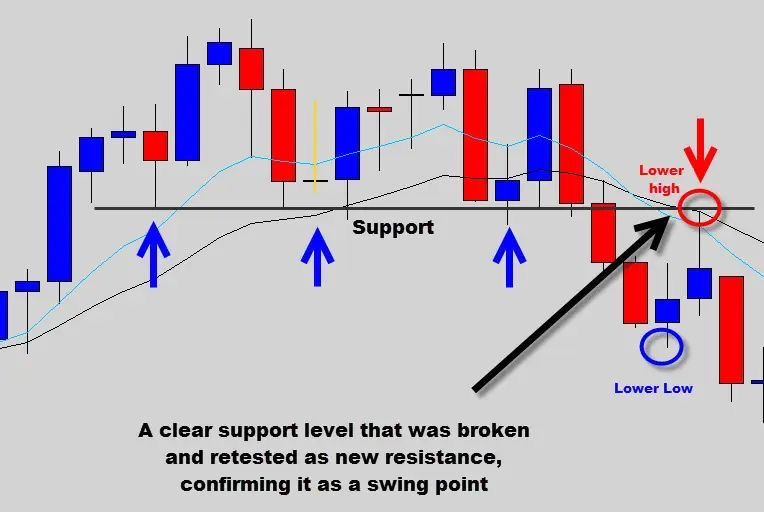
Support and resistance levels switch roles when decisively broken. A support level that breaks often becomes future resistance; a resistance level that is broken typically becomes future support. This role reversal principle is one of the most practically useful concepts in technical analysis.
Higher time frame levels are stronger than lower time frame levels. Weekly and daily chart levels should be identified first, then refined on hourly or 4-hour charts for precise entry timing.
False breakouts are common in crypto markets. Wait for confirmation before acting on a breakout: a closing candle beyond the level, ideally on rising volume, reduces the risk of entering a failed move.
What Are Support and Resistance Levels and Why Do They Matter?
Every trader knows that price movements are not random, but few fully grasp the significance of support and resistance levels in shaping market trends. These levels are not arbitrary lines on a chart. They represent psychological barriers where buying or selling pressure often intensifies, leading to potential reversals or breakouts. Mastering their identification transforms trading strategy by providing clear signals for when to enter or exit a trade.
What Is a Support Level?
A support level is a specific price point where an asset’s price tends to stop falling and may start rising again. It acts as a floor for the price. When the price approaches a support level, it is met with increased buying interest, which prevents further decline. The idea is that as price drops toward a certain point, buyers find the value attractive and begin accumulating. This buying activity creates the floor.
For example, if Bitcoin consistently bounces back every time it approaches $80,000, that price level is a support level. At support, buyer behaviour is dominant: traders and investors see the price as a good entry opportunity and expect it to rise. If the support holds, price bounces. If it breaks, price typically falls to the next support zone below, accelerated by stop-loss orders triggering below the breached level.
What Is a Resistance Level?
Resistance levels are the opposite of support levels. They represent price points where an asset’s price tends to stop rising and may start falling. Resistance acts as a ceiling for the price. When price approaches a resistance level, it encounters selling pressure that prevents further advance. A resistance level forms when price reaches a point where sellers begin taking profits and buyers become reluctant to purchase at higher levels.
For instance, if Ethereum struggles to rise above $3,500 multiple times, that level is a resistance level. At resistance, sellers dominate: they view the level as a good opportunity to exit holdings, expecting a price decline. If resistance holds, price falls back. If price breaks through decisively on volume, the old resistance frequently becomes new support as the market re-prices to a higher range.
Why Are These Levels Significant?
Support and resistance levels matter because they help traders understand the most probable turning points in price. They represent areas of prior market activity where significant buy and sell orders were placed. These historical orders often remain relevant on re-tests because many market participants remember where the price bounced before and act accordingly, making the levels partially self-fulfilling. They are key areas for entry decisions, stop-loss placement, and take-profit targeting in any technical trading strategy.
What Are the Different Types of Support and Resistance Levels?
What Is Role Reversal in Support and Resistance?
Role reversal is one of the most practically powerful concepts in support and resistance analysis. When a support level is decisively broken, it frequently becomes future resistance as buyers who entered at that level now seek to exit at break-even when price returns to the broken level. When a resistance level is broken decisively, it frequently becomes new support as traders who were waiting to buy just below the resistance now defend the new floor. Identifying these role-reversed levels is critical for setting targets and stop-losses after breakouts.
Join UEEx
Experience the World’s Leading Digital Wealth Management Platform
What Methods Can You Use to Identify Support and Resistance?
Historical Price Data and Prior Highs and Lows
Historical price data is the most fundamental method for identifying support and resistance. By examining a price chart and marking the points where price has previously reversed direction, traders build an empirical map of where market participants have historically been active buyers or sellers. Peaks (high points) often act as future resistance; troughs (low points) often act as future support. If Bitcoin has reversed four times at the $95,000 level, that level carries more significance than one touched only once. The more re-tests of a level that hold, the stronger the historical evidence for its continuing relevance.
Technical Indicators
Several widely used technical indicators help identify dynamic support and resistance levels:
RSI (Relative Strength Index): When RSI reaches extreme overbought (above 70) or oversold (below 30) readings, it suggests potential resistance or support, respectively. RSI divergence from price at a key level adds additional confirmation that a reversal may be imminent.
MACD: When MACD crosses above or below its signal line, it often coincides with a price reversal at a support or resistance zone, providing independent timing confirmation.
Bollinger Bands: When price reaches the upper or lower band, it signals potential resistance or support respectively, particularly when accompanied by reversal candlestick patterns at that level.
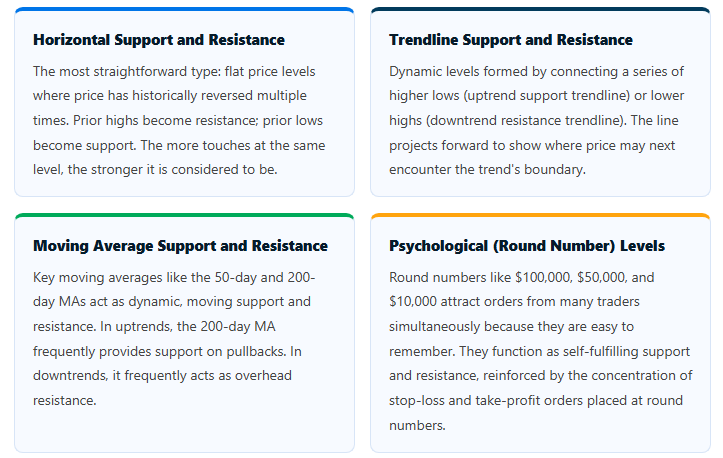
Moving Averages: The 50-day, 100-day, and 200-day simple and exponential moving averages act as dynamic support and resistance, shifting with price over time rather than remaining at fixed price levels.
Volume Profile and Volume Analysis
Volume analysis is one of the most reliable confirmation tools for support and resistance. The Volume Profile indicator plots trading volume horizontally across price levels, revealing where the most market activity has occurred over a specified period. High volume nodes, where a disproportionate amount of all trading has occurred, represent price levels where large numbers of traders entered positions. These participants will often defend or react to those levels on a re-test, making high volume nodes strong support or resistance. A surge in volume as price approaches or bounces from a level provides confirmation that the market is actively defending it.
Chart Patterns
Classic chart patterns directly encode support and resistance relationships within their structure:
Double top: Two tests of the same resistance level without breaking through, signalling potential reversal lower.
Double bottom: Two tests of the same support level without breaking through, signalling potential reversal higher.
Head and shoulders: The neckline of the pattern is the support level; a break below it confirms the reversal. The target is typically measured as the height of the pattern projected below the neckline.
Flags and pennants: The consolidation boundaries define near-term support and resistance; the prior trend typically resumes on a breakout from the consolidation.
Fibonacci Retracement Levels
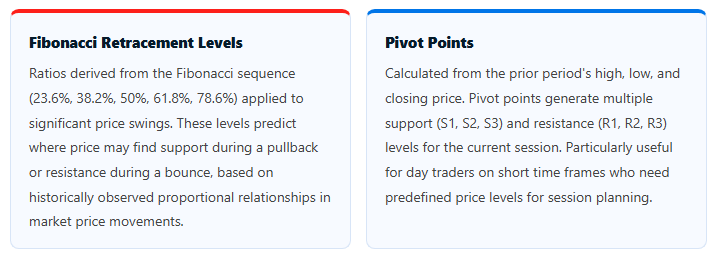
To apply Fibonacci retracement, select a significant price swing low and high (or high and low for a downtrend). The tool overlays the key ratios (23.6%, 38.2%, 50%, 61.8%, and 78.6%) as horizontal lines across the chart. These levels represent potential areas where price may find support during a correction of the prior trend. The 61.8% level (the “golden ratio”) is historically the most watched by traders and tends to be the strongest retracement level. When a Fibonacci level coincides with a prior horizontal support level or moving average, the confluence significantly strengthens the case for that price acting as support.
Pivot Points
Pivot points are calculated mechanically from the prior trading period’s high, low, and closing price using the formula: Pivot = (High + Low + Close) / 3. Support and resistance levels (S1, S2, S3 and R1, R2, R3) are then calculated as fixed increments from the pivot. Because pivot points are determined by objective calculation rather than subjective chart reading, many traders use the same levels simultaneously, which tends to make them self-fulfilling. They are most effective on daily, weekly, and monthly time frames for day traders and swing traders.
Multi-Time Frame Analysis
Analysing support and resistance across multiple time frames provides a more complete picture and improves level reliability. The process involves identifying major levels on the weekly or daily chart, then zooming into the hourly or 4-hour chart to find more precise entry areas within those major level zones. A support level visible on both the weekly and daily charts is significantly stronger than one visible only on a 15-minute chart. The principle: higher time frame levels are stronger and more significant, while lower time frame levels provide precision for trade execution. Multi-time frame analysis reduces false signals by ensuring that trades taken on lower time frames align with the broader structure visible on higher time frames.
How Do You Validate the Strength of a Support or Resistance Level?
Multiple Touches Without Breaking
The most basic validation test is the number of times a level has been touched without being decisively broken. A level tested twice is more significant than one tested once. A level tested four or five times is a major zone that the market has repeatedly respected. Each additional test that holds adds weight to the level’s significance and the likelihood that it will continue to be relevant on future approaches.
Candlestick Confirmation at the Level
Specific candlestick patterns that form at support or resistance levels provide additional confirmation before entering a trade. At support, bullish reversal patterns such as hammer candles, bullish engulfing patterns, and morning star formations suggest that buyers are taking control. At resistance, bearish patterns such as shooting stars, bearish engulfing patterns, and evening star formations indicate that sellers are asserting control. Waiting for a confirming candle to close rather than acting on price simply touching a level reduces the risk of entering a false reversal.
Volume Confirmation
Volume confirmation at a level provides one of the most reliable validation signals available. When price approaches a support level and trading volume surges as the price bounces, it confirms that buyers are actively stepping in. When price approaches resistance and volume surges as the price stalls, it confirms that sellers are actively defending the level. Conversely, a test of support or resistance on declining volume suggests weak conviction from defenders, making a break of the level more likely.
False Breakouts and How to Avoid Them
False breakouts occur when price briefly moves beyond a support or resistance level but then rapidly reverses back into the prior range. They are common in crypto markets, particularly around well-known technical levels where stop-loss orders and breakout orders accumulate. To reduce exposure to false breakouts, traders typically wait for a candle to close beyond the level on a time frame appropriate to their strategy, rather than acting on an intracandle move. A daily candle that closes definitively beyond a level provides much stronger confirmation than a 5-minute bar that briefly pierces it.
False breakouts can also create high-probability trading opportunities in the opposite direction. If Bitcoin briefly breaks below a well-established support level but closes back above it on the daily chart, this failed breakdown often triggers a sharp rally as trapped short-sellers are forced to cover. Recognising this pattern allows traders to enter in the direction of the false breakout failure rather than being caught on the wrong side.
Validation Factor
What It Shows
How to Apply
Multiple price touches
Market has repeatedly respected the level; more touches mean stronger consensus
Mark levels with 3 or more prior touches as high-priority zones
High volume at the level
Many market participants traded there previously; they will likely react again on a re-test
Use Volume Profile to identify high-volume nodes; prioritise those as key zones
Higher time frame confirmation
Level is visible and significant on weekly or daily chart, not just intraday
Always check if level aligns with a weekly or daily structural level
Confluence with other methods
Multiple independent analysis methods confirm the same price level simultaneously
Strongest setups arise when horizontal level, Fibonacci, and moving average all align
Reversal candlestick pattern
Price action at the level shows buyers or sellers taking control, not just touching
Wait for a closing hammer, engulfing, or doji at the level before entering
How Do You Trade Using Support and Resistance Levels?
How Do You Enter Trades at Support and Resistance?
Entering trades at support and resistance levels involves identifying confirmation signals that the level will hold. At support, traders look for signs of buying pressure: bullish candlestick patterns, volume increasing on a bounce, or an RSI reading below 30 that is starting to turn up. At resistance, bearish patterns, volume surging on a stall, or an RSI above 70 turning down provide confirmation signals.
The choice of order type depends on market conditions. A limit order placed precisely at the support or resistance level ensures entry at the desired price but risks non-fill if price reverses before reaching the target level. A market order ensures execution but may fill at a less favourable price during fast-moving conditions. Many traders use a combination: a limit order placed slightly inside the zone to capture the level while accounting for price overshoot.
How Do You Set Stop-Losses and Take-Profits Relative to These Levels?
Stop-loss placement should be just outside the channel boundary on the opposite side from entry: just below the support level for long trades, just above the resistance level for short trades. This provides a clear invalidation point: if price convincingly breaks through the level, the trade thesis is wrong and the loss should be capped at the defined stop. Setting stops too close to the level risks being stopped out by normal price noise before the level actually breaks.
Take-profit levels are logically placed near the next significant support or resistance level in the direction of the trade. For a long trade entered at support, the first take-profit target is typically the next resistance level above. This creates a natural risk-to-reward ratio framework: if support is at $80,000, stop is at $78,500 (risk: $1,500), and the next resistance is at $86,000 (reward: $6,000), the risk-to-reward ratio is 1:4, which meets most traders’ minimum threshold of 1:2.
How Do You Trade a Bounce Off Support or Resistance?
A bounce trade enters in the direction of a reversal when price reaches a support or resistance level. At support, this means entering long when price touches the level and shows reversal signals. At resistance, it means entering short when price approaches the ceiling and shows signs of rejection. The key criteria before entering a bounce trade are: the level has been tested multiple times without breaking; there is a reversal candlestick pattern forming at the level; and ideally volume is increasing as the bounce begins. Stop-loss is placed just beyond the level to exit the trade if the level breaks rather than holds.
How Do You Trade a Breakout Through a Level?
Breakout trading enters in the direction of the breakout when price moves definitively beyond a support or resistance level. The most reliable breakouts are accompanied by significantly above-average trading volume, a candlestick that closes convincingly beyond the level on the relevant time frame, and ideally a re-test of the broken level that confirms it as the new support or resistance. After a breakout above resistance, waiting for the re-test of the former resistance as new support before entering reduces false breakout risk. For a downside breakout below support, waiting for a re-test of the broken support as new resistance provides similar confirmation.
“The most reliable trade setups arise when multiple support and resistance identification methods converge on the same price level simultaneously. A horizontal level that also coincides with a 61.8% Fibonacci retracement and the 200-day moving average is a level that thousands of traders are watching at the same time.”UEEx Market Analysis
What Are the Advanced Techniques for Identifying Support and Resistance?
Using Confluence Zones to Identify the Strongest Levels
Confluence occurs when multiple independent analysis methods simultaneously point to the same support or resistance level. A confluence zone is stronger than any single-indicator level because it represents agreement across different analytical frameworks. When a horizontal prior low, a 50% Fibonacci retracement of a major swing, and the 200-day moving average all converge within a $500 price range, that zone carries the combined weight of all three methods and is likely to be defended by traders who use any one of those techniques.
To build a confluence analysis: first identify key horizontal levels from historical highs and lows; then overlay Fibonacci retracement from the most recent significant swing; then add key moving averages; then add pivot points and volume profile. The zones where three or more of these overlap are your highest-priority support and resistance areas for trading.
Modern charting platforms including TradingView, MetaTrader, and specialised cryptocurrency analytics tools offer automated support and resistance detection. These algorithms identify levels based on objective criteria: price reversals meeting minimum magnitude requirements, volume spikes at specific price levels, and recurrence frequency thresholds. Automated identification can scan a full price history in seconds, surface levels that manual scanning might miss, and alert traders when price approaches defined levels. The limitation is that algorithms lack contextual judgment: they cannot evaluate news events, sentiment, or the broader structural significance of a level in the way an experienced trader would. Use automated tools as an initial scan, then apply manual judgment to prioritise the levels identified.
Combining Sentiment Indicators with Price Levels
Market sentiment indicators provide an additional dimension to support and resistance analysis. The Crypto Fear and Greed Index, social media sentiment analysis, and on-chain metrics like the MVRV ratio can indicate when the market is at an extreme emotional state. When sentiment reaches extreme fear and price is simultaneously approaching a major historical support level, the combination of a technical and a sentiment signal creates a stronger case for a bounce. Conversely, extreme greed at a major resistance level reinforces the case for a reversal. Sentiment analysis does not replace price-based support and resistance analysis, but it provides useful context about the emotional intensity of market participants at key levels.
Cross-Asset Correlation Analysis
Bitcoin’s correlation with other major assets, particularly the NASDAQ, reached 92% over a six-month period in 2025, confirming that macro conditions now significantly influence crypto price levels. When the S&P 500 is approaching a major technical support level at the same time Bitcoin is approaching its own support level, the confluence between asset classes provides additional confidence that the Bitcoin support will hold. Conversely, if equities are breaking down through major support, the likelihood that Bitcoin’s support levels will also fail increases. Cross-market analysis is particularly relevant around Federal Reserve interest rate decisions, major economic data releases, and geopolitical risk events.
What Are the Most Common Mistakes in Support and Resistance Analysis?
Over-reliance on a single method. Using only horizontal levels without considering Fibonacci retracements, moving averages, or volume profile misses significant dimensions of market structure. Combining multiple methods produces significantly more reliable levels.
Ignoring market context. Major economic announcements, regulatory news, and changes in macro conditions can override technical support and resistance levels. A support level that would hold under normal conditions may break instantly on a Fed surprise or a major geopolitical event. Always check the economic calendar before placing trades at key levels.
Failing to adjust levels as the market evolves. Support and resistance levels are not permanent. A level tested in January may be irrelevant by June if the overall price structure has shifted materially. Regularly review and update your levels, particularly after major trend changes or significant new all-time highs or lows.
Neglecting multiple time frames. Analysing only one time frame leads to misidentifying the relative importance of levels. A level visible only on a 15-minute chart deserves less weight than one visible on a daily chart. Always perform a top-down analysis starting from the highest relevant time frame.
Acting on price touching a level rather than confirming at it. Entering immediately when price touches a level, before a reversal candlestick pattern has formed, results in many false entries. Wait for the level to attract a confirming reaction: a reversal candle closing at the level, ideally with volume confirmation, before committing to a trade.
Treating levels as precise price points rather than zones. In practice, support and resistance areas span a range of prices rather than a single exact price. Drawing a support level as a zone, rather than a single line, accounts for the natural variability in how price interacts with these areas and reduces the number of false signals generated by minor price overshoots.
Bullish reversal candle at support; ideally volume increasing on bounce
Just below the support level or zone low
Next resistance level above entry
Rejection at resistance (Short)
Bearish reversal candle at resistance; volume increasing on rejection
Just above the resistance level or zone high
Next support level below entry
Breakout above resistance (Long)
Candle closes convincingly above resistance on high volume; re-test as new support confirms
Just below the broken resistance (now support)
Next resistance zone above; width of the broken range projected upward
Breakdown below support (Short)
Candle closes convincingly below support on high volume; re-test as new resistance confirms
Just above the broken support (now resistance)
Next support zone below; width of the broken range projected downward
Frequently Asked Questions
What are the best indicators to identify support and resistance levels?
The most effective indicators are moving averages (particularly the 50-day and 200-day), Fibonacci retracement levels, trendlines connecting significant highs and lows, pivot points calculated from prior period data, and volume profile analysis showing where the most trading activity has occurred. No single indicator is definitive. Levels confirmed by multiple methods simultaneously, known as confluence zones, provide the strongest and most reliable signals for trading decisions.
How can I determine the strength of a support or resistance level?
Strength is determined by four factors: the number of times the level has been tested without breaking (more tests equal greater strength); the trading volume at the level during those tests (high volume signals strong market interest); the time frame on which the level appears (weekly chart levels are stronger than hourly chart levels); and whether multiple independent methods confirm the same level simultaneously. Levels visible and consistent across multiple time frames and confirmed by volume are the most reliable for trading.
How do I adjust support and resistance levels over time?
Update levels whenever new price action breaches or confirms them. If a support level is broken and price stays below it, it typically becomes new resistance under the principle of role reversal. When resistance is decisively broken, it frequently becomes new support. Review and adjust levels after significant price moves, major news events, or at the start of each trading week. Levels that no longer align with recent highs and lows should be recalibrated to reflect current market structure rather than relying on outdated price points.
Can support and resistance levels change from one time frame to another?
Yes. Support and resistance levels vary significantly across time frames. A level on a 15-minute chart may be invisible or irrelevant on a daily chart, while a weekly chart level will almost certainly influence activity on lower time frames. Higher time frame levels are stronger and more significant than lower time frame levels. The recommended approach: identify key levels on the weekly or daily chart first, then refine precise entry points on the hourly or 4-hour chart, ensuring that smaller timeframe trades align with the broader structure visible above.
What role does volume play in confirming support and resistance levels?
Volume plays a critical confirming role. High trading volume at a level indicates that many market participants previously traded there, creating a strong economic basis for the level to hold on a re-test. When price approaches a high-volume support level and bounces with a surge in volume, it confirms that buyers are actively defending the floor. Volume spikes at a level during a test significantly strengthen the case for that level’s validity. Conversely, a breakout on low volume is far more likely to be a false breakout than one accompanied by a notable volume surge.
Join UEEx
Experience the World’s Leading Digital Wealth Management Platform
Oluwadamilola Olaniyan is a certified content writer. As a content writer and marketer, she is passionate about creating content that engages and inspires audiences. She is also skilled in turning complex ideas into impactful and easy to read content.
Disclaimer: This article is intended solely for informational purposes and should not be considered trading or investment advice. Nothing herein should be construed as financial, legal, or tax advice. Trading or investing in cryptocurrencies carries a considerable risk of financial loss. Always conduct due diligence before making any trading or investment decisions.


")


")


