

Elliott Wave Theory (EWT) is a technical analysis framework developed by Ralph Nelson Elliott in the 1930s.
It proposes that financial markets, including cryptocurrency, move in predictable, repeating patterns called waves that reflect collective investor psychology cycling between optimism and pessimism.
Key Takeaways
- Brief History of Elliot Theory
- Elliott Wave Principle and Market Psychology
- Core Structure of an Elliott Wave Cycle
- Three Unbreakable Rules of Elliott Wave Theory
Brief History of the Elliot Theory
Ralph Nelson Elliott, the founder of Elliott Wave Theory, or more accurately the Elliott Wave Principle, was born on July 28, 1871, in Marysville, Kansas. Elliott’s breakthrough came later in life after a varied career in accounting and business practices.
Forced into an early retirement at the age of 58 due to illness, which he contracted while living in Central America, Elliott turned his focus to studying the stock market during his recovery.
He meticulously analysed stock market behaviour using yearly, monthly, weekly, daily, hourly, and half-hourly charts, spanning 75 years of market history.
By November 1934, Elliott had developed enough confidence in his theory, sometimes called Wave Theory, that he presented it to Charles J. Collins of Investment Counsel, Inc. in Detroit. Collins, who had often dismissed various market-beating systems due to their repeated failures, saw something different in Elliott’s Wave Theory.
At the time, in early 1935, the Dow Jones averages were in decline, and many advisors, still haunted by the crash of 1929-1932, remained pessimistic.
On March 13, 1935, Elliott sent a telegram to Collins confidently stating, based on his Wave Theory analysis:
“Notwithstanding bearish (DOW) implications, all averages are making final bottom.”
The next day, March 14, 1935, marked the Dow Industrials’ low for the year, confirming Elliott’s forecast. The market immediately began an upward trend.
Two months later, as the market continued to rise, Collins agreed to collaborate with Elliott on a book. “The Wave Principle” was published on August 31, 1938.
In the early 1940s, Elliott continued refining his theory, connecting human collective behavior patterns to the Fibonacci, or “golden” ratio, a mathematical principle long known as a law of natural progression and form.
The Elliott Wave Principle and Market Psychology
- Mass Psychology as a Driver: The Elliott Wave Principle maps how collective investor sentiment swings between optimism and pessimism in natural, cyclical patterns.
- Predictable Patterns: These psychological shifts create measurable, recurring price structures called “waves” that reflect the true driving force of the market.
- Independent of External News: Market movements are often inconsistent with news or economic reports; the same news can move the price in opposite directions depending on the current wave.
- Fractal Nature: Market patterns are fractal, meaning they repeat infinitely on both large and small scales, allowing for detailed analysis across all timeframes.
- Probability vs. Certainty: Rather than offering guarantees, this method helps traders organize market probabilities and identify high-reward, low-risk setups.
- Synergy with Other Tools: For the best results, wave analysis should be combined with other technical indicators to refine decision-making.
What Is the Core Structure of an Elliott Wave Cycle?
Every Elliott Wave cycle consists of two phases: a motive phase and a corrective phase. Together they produce a complete eight-wave cycle that recurs at every degree of trend.
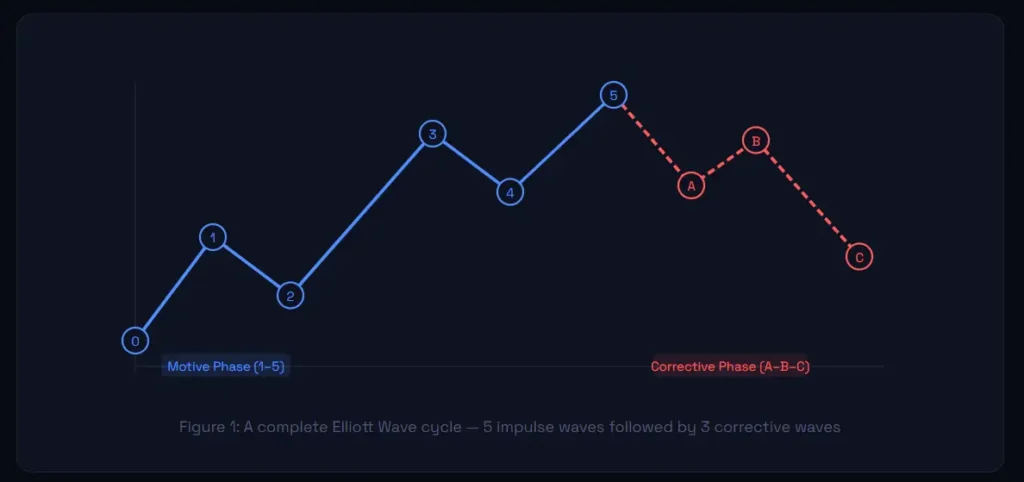
What Happens in Each of the Five Impulse Waves?

What Are the A, B, and C Corrective Waves?
Wave A is the first move against the prior trend. Most participants dismiss it as a minor pullback, especially if Wave 5 sentiment was still strong.
Wave B is a partial recovery, a counter-rally that gives hope to bulls but typically fails to reach the Wave 5 high. It can feel deceptively positive.
Wave C is the final, often brutal decline that completes the correction. It frequently overshoots to the downside, washing out weak hands and resetting sentiment before the next impulse cycle begins.
In Bitcoin’s 2022 bear market, the ABC correction from the November 2021 peak to the November 2022 low at approximately $16,000 followed this structure with notable fidelity, completing a correction that wiped over 75% from the all-time high before the new impulse cycle began in 2023.
What Are the Three Unbreakable Rules of Elliott Wave Theory?
Unlike many areas of technical analysis that involve subjective judgement, Elliott Wave Theory has three hard rules that are non-negotiable.
If your wave count violates any of these, it is invalid and must be reconsidered.
| Rule | What It Says | Why It Matters | VIOLATION MEANS |
| Rule 1 | Wave 2 cannot retrace more than 100% of Wave 1 | Protects the direction of the trend; a full retrace means the trend has not started | Count is invalid |
| Rule 2 | Wave 3 cannot be the shortest impulse wave among Waves 1, 3, and 5 | Wave 3 is the power wave — if it is the shortest, the structure lacks the momentum characteristic of a valid impulse | Count is invalid |
| Rule 3 | Wave 4 cannot overlap with the price territory of Wave 1 | Confirms the trend is intact and Wave 4 is truly corrective rather than reversal | Count is invalid |
Beyond the hard rules, there are widely accepted guidelines not rules, but strong tendencies. Wave 2 tends to be a sharp zigzag correction, while Wave 4 tends to be flat or sideways.
When Wave 3 is the longest wave, Waves 1 and 5 are often similar in length.
And Wave 5 frequently shows divergence on momentum oscillators like RSI and MACD, signalling exhaustion even as price makes a new high.
How Do Fibonacci Ratios Connect to Elliott Wave Analysis?
Fibonacci ratios are the mathematical backbone of Elliott Wave Theory.
Elliott discovered that wave relationships consistently reflect Fibonacci proportions, the sequence discovered by Leonardo Fibonacci in 1202 that appears throughout nature in spirals, branching patterns, and growth ratios.
The most critical values for traders are the retracement levels (38.2%, 50%, 61.8%) and extension levels (100%, 127.2%, 161.8%).
| Wave | Typical Fibonacci Relationship | Trading Application |
| Wave 2 Retracement | 50% or 61.8% of Wave 1 | Buy zone — classic re-entry after Wave 1 confirmation |
| Wave 3 Extension | 161.8% of Wave 1 (minimum); often 261.8% in crypto | Price target — where Wave 3 momentum typically exhausts |
| Wave 4 Retracement | 38.2% of Wave 3 | Buy zone — shallow pullback before Wave 5 begins |
| Wave 5 Extension | Equal to Wave 1 (100%) or 61.8% of Waves 1 to 3 combined | Price target — approach with caution, watch for divergence |
| Wave C | Equal to Wave A (100%) or 161.8% extension of Wave A | Correction target — potential accumulation zone for next impulse |
| Wave B Retracement | 38.2% to 61.8% of Wave A | Caution — deceptive recovery, not a trend reversal |
In a concrete Bitcoin example from 2025: with Wave 1 running from $74,800 to $95,000 (a $20,200 move), the 61.8% Fibonacci retracement of that wave sits at approximately $82,520.
Read Also: 9 Types of Technical Analysis in Cryptocurrency
Traders watching for Wave 2 to complete would look for price to hold near that level before entering for the Wave 3 advance.
Fibonacci tools on TradingView or any professional charting platform can draw these levels automatically.
Read Also: How To Apply Elliott Oscillator In Crypto Trading
How Is Elliott Theory Applied to Bitcoin and Ethereum in 2025?
Bitcoin’s 24/7 trading nature makes it an unusually clean laboratory for Elliott Wave analysis.
There are no overnight gaps, no trading halts, no circuit breakers, the psychological forces that drive the theory operate without interruption, producing wave structures that many experienced analysts find easier to identify than those in traditional equity markets.
A long-term multi-degree analysis of Bitcoin from its genesis through to its 2025 all-time high above $126,000 has been modelled as a massive Primary Degree Impulse Wave.
Analysts tracking this count suggest that Blue Wave 1 launched from Bitcoin’s inception through the December 2013 peak around $1,200.
Each subsequent cycle represented a higher-degree wave in the same larger structure, with the 2025 peak potentially completing a major degree wave before a meaningful structural correction unfolds over the next cycle.
For Ethereum, the theory works similarly.
Ethereum’s bull market from early 2020 to mid-2021 showed clean five-wave impulse structure on the weekly chart, with corrections consistently retracing to 38.2% to 61.8% Fibonacci levels of the preceding waves exactly as the model predicts.
More recently, Solana’s explosive moves in 2024 and 2025 have generated active Elliott Wave analysis within the community, with Solana reaching near $205 in late August 2025 as analysts tracked completion of what appeared to be a larger-degree setup.
How Do You Start Trading With Elliott Theory Step by Step?
- Learn the Rules Before Counting Anything
Use Fibonacci retracement tools to find the likely end of corrective waves (Wave 2 at 61.8% of Wave 1, Wave 4 at 38.2% of Wave 3).
Use Fibonacci extensions to project Wave 3 and Wave 5 targets. Place your invalidation stop just below the level that would break the hard rules. - Start on Higher Timeframes
Begin with weekly and daily charts on assets like Bitcoin or Ethereum. Higher timeframes produce cleaner wave structures with less noise.
Once you can identify the major impulse and corrective phases clearly on the daily chart, move down to the 4-hour chart for entry timing. - Identify the Current Wave Position
Ask where you are in the cycle. Are you in a Wave 2 corrective dip within a larger bull market, or are you deep into a Wave C collapse? Context determines opportunity.
A Wave 2 in an established uptrend is a buying opportunity; a Wave 5 with divergence on RSI is a warning to reduce exposure. - Apply Fibonacci Levels for Entry, Target, and Stop
Use Fibonacci retracement tools to find the likely end of corrective waves (Wave 2 at 61.8% of Wave 1, Wave 4 at 38.2% of Wave 3).
Use Fibonacci extensions to project Wave 3 and Wave 5 targets. Place your invalidation stop just below the level that would break the hard rules. - Confirm With Secondary Indicators
Elliott Wave Theory is a structural framework, not a standalone trading signal. Confirm Wave 3 starts with rising volume.
Confirm Wave 5 exhaustion with RSI divergence or MACD histogram decline. Wait for confirmation before committing capital, especially in the early stages of learning the method. - Keep an Alternative Count Ready
Every experienced Elliott analyst maintains a primary count and at least one alternative count. If price invalidates your primary scenario, the alternative guides your next move.
Markets regularly produce complex or extended patterns that require count adjustments, that is not failure, it is proper analytical discipline.
Pros and Limitations
Now that we understand the concept of Elliot’s wave theory, let’s look at its strengths and weaknesses.
Pros
Predictive power: Elliott Wave Theory offers a framework for predicting future price movements based on crowd psychology.
Versatility: It can be applied to any financial market, including stocks, forex, and cryptocurrencies.
Integrates with other tools: Traders often use Elliott Wave in conjunction with other technical tools like Fibonacci retracements, moving averages, and RSI for added accuracy.
Limitations
Subjectivity: Correctly identifying wave patterns can be subjective, and different traders may label waves differently.
Complexity: Elliott Wave Theory can be complex and requires significant practice and experience to master.
Read Also: Beginners Guide to Using Elliott Wave Theory for Cryptocurrency Analysis
Conclusion
Elliott Wave Theory remains one of the most powerful tools in a trader’s arsenal for analyzing market trends.
While it requires practice and expertise to apply successfully, understanding its wave structures and integrating Fibonacci relationships can significantly improve trading performance.


