Want to know the different types of technical analysis in cryptocurrency adopted by traders in the crypto market? Here you have it.
Technical analysis is a powerful tool that cryptocurrency traders use to identify trends and make predictions about future price movements in the market. By studying historical price data and volume, technical analysts believe they can spot patterns that may indicate where prices are heading next. While it’s not an exact science by any means, technical analysis has helped many traders navigate the highly volatile crypto markets over the years.
There are several different types of technical analysis that traders employ, each with their own methodology for interpreting charts. Let’s take a deeper look at some of the most common techniques.
Key Takeaways
Technical analysis is a powerful tool used by cryptocurrency traders to identify trends and predict future price movements in the market.
Different types of technical analysis techniques include trend analysis, support and resistance, chart patterns, indicators, oscillators, candlestick patterns, volume analysis, and Fibonacci retracement.
Trend analysis involves identifying whether the market is in an uptrend or a downtrend using tools like trendlines and moving averages.
Support and resistance levels act as barriers in price movements, and breaking these levels can indicate a potential trend change.
Chart patterns, such as head and shoulders, triangles, flags, and pennants, offer insights into market psychology and potential price action.
Types of technical analysis in Cryptocurrency that traders employ
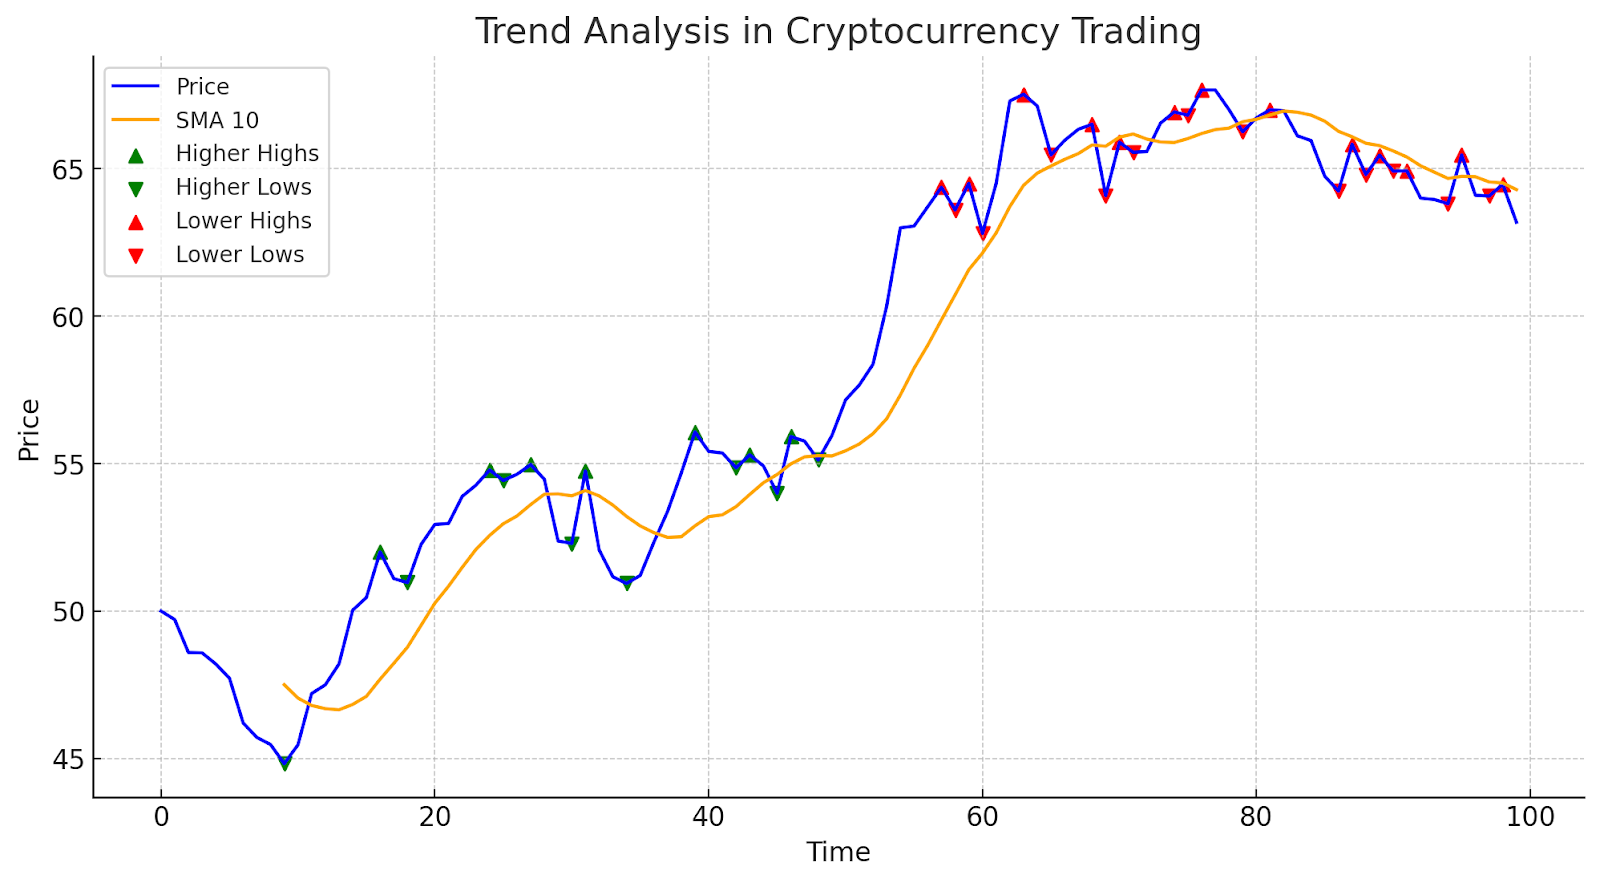
1. Trend Analysis
One of the fundamental concepts in technical analysis is identifying and trading with the trend. Trend analysis simply means determining whether the market is in an uptrend (prices making a series of higher highs and higher lows) or a downtrend (lower highs and lower lows).
Join UEEx
Experience the World’s Leading Digital Wealth Management Platform
Traders will enter long positions if they identify an uptrend and short positions for downtrends in the hope that the trend will continue. Trendlines and moving averages are among the most popular tools used to recognize trends.
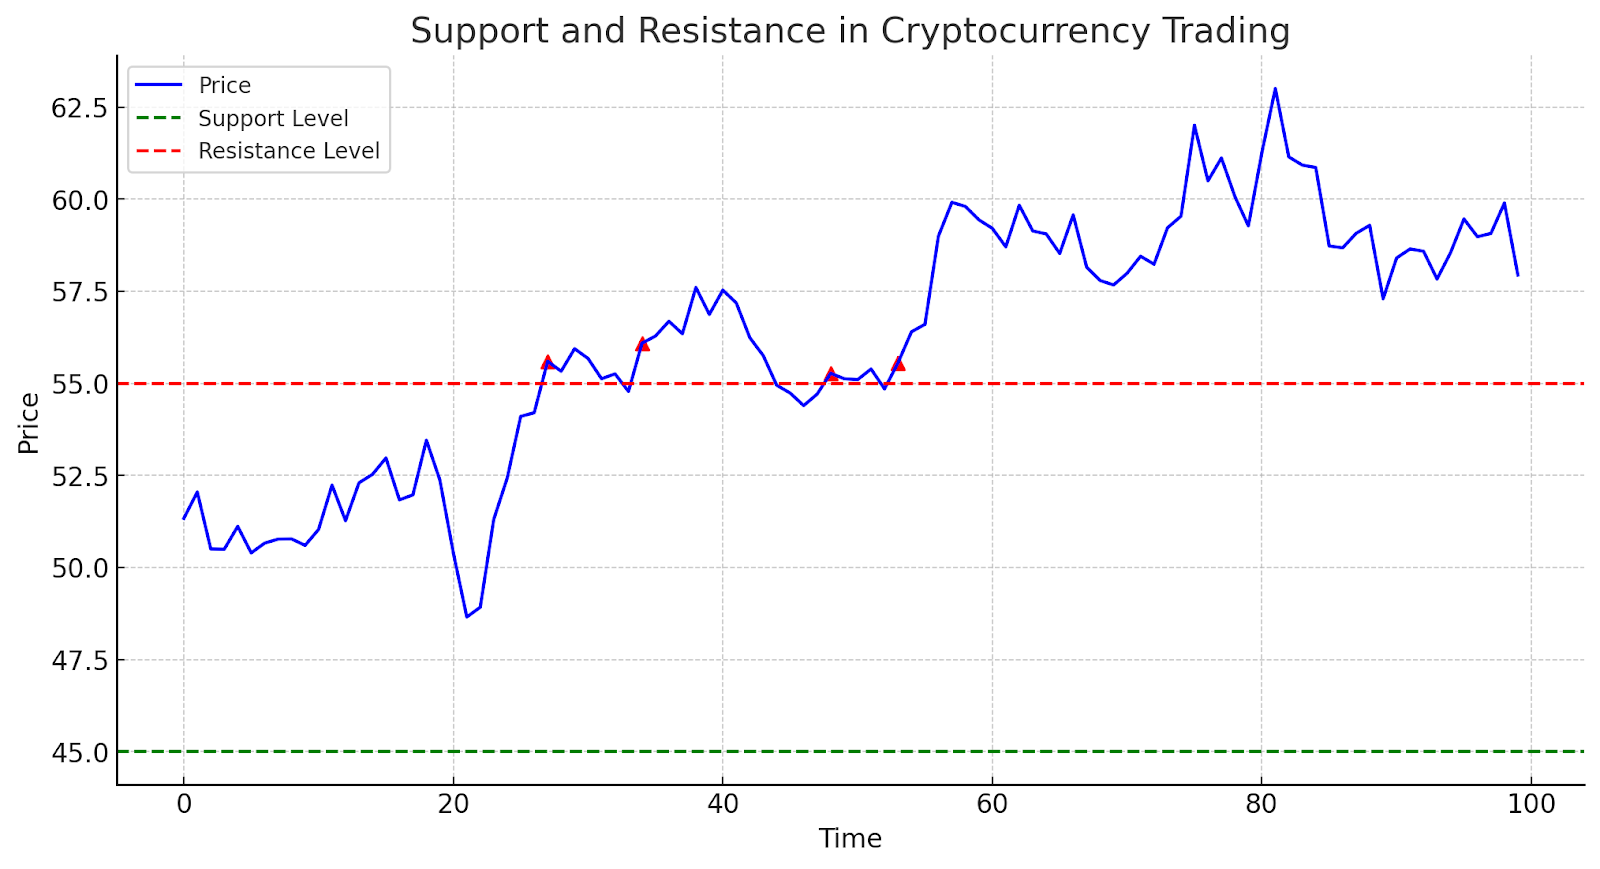
2. Support and Resistance
Areas of support and resistance represent price levels that have historically acted as barriers that either stop price decreases (support) or limit price increases (resistance). When support or resistance levels are broken, it signals a potential trend change.
Traders watch for cryptocurrency prices to bounce off support or struggle to break above resistance and enter positions accordingly. Identifying these “price flip points” on charts is a fundamental technique.
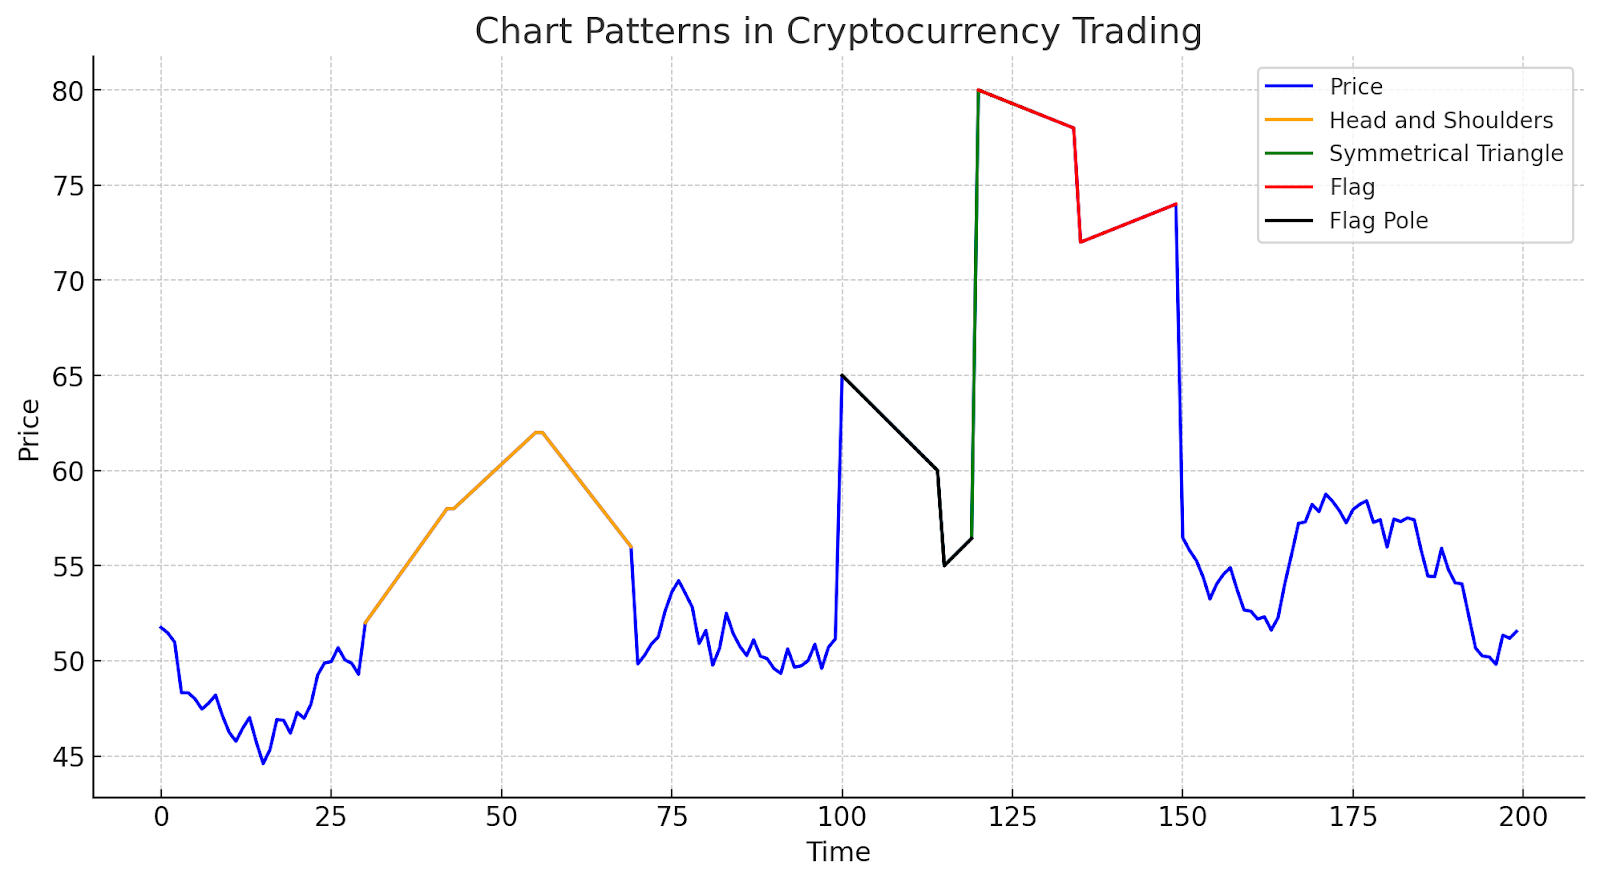
3. Chart Patterns
Chart pattern analysis refers to identifying formations that emerge visually on price charts over time. Technical analysts also seek out recurring patterns on price charts, like head and shoulders, triangles, flags, and pennants.
These patterns are said to offer clues about market psychology and subsequent price action. For example, a symmetrical triangle pattern may indicate a breakout is coming, while a double top formation could signal the trend may be nearing an end.
Join UEEx
Experience the World’s Leading Digital Wealth Management Platform
Flag and pennant patterns see the asset’s price retrace a portion of its initial directional move in a symmetrical shape. Pattern recognition is seen by many as an art, but it’s a valuable tool for discerning potential reversals and continuation setups.
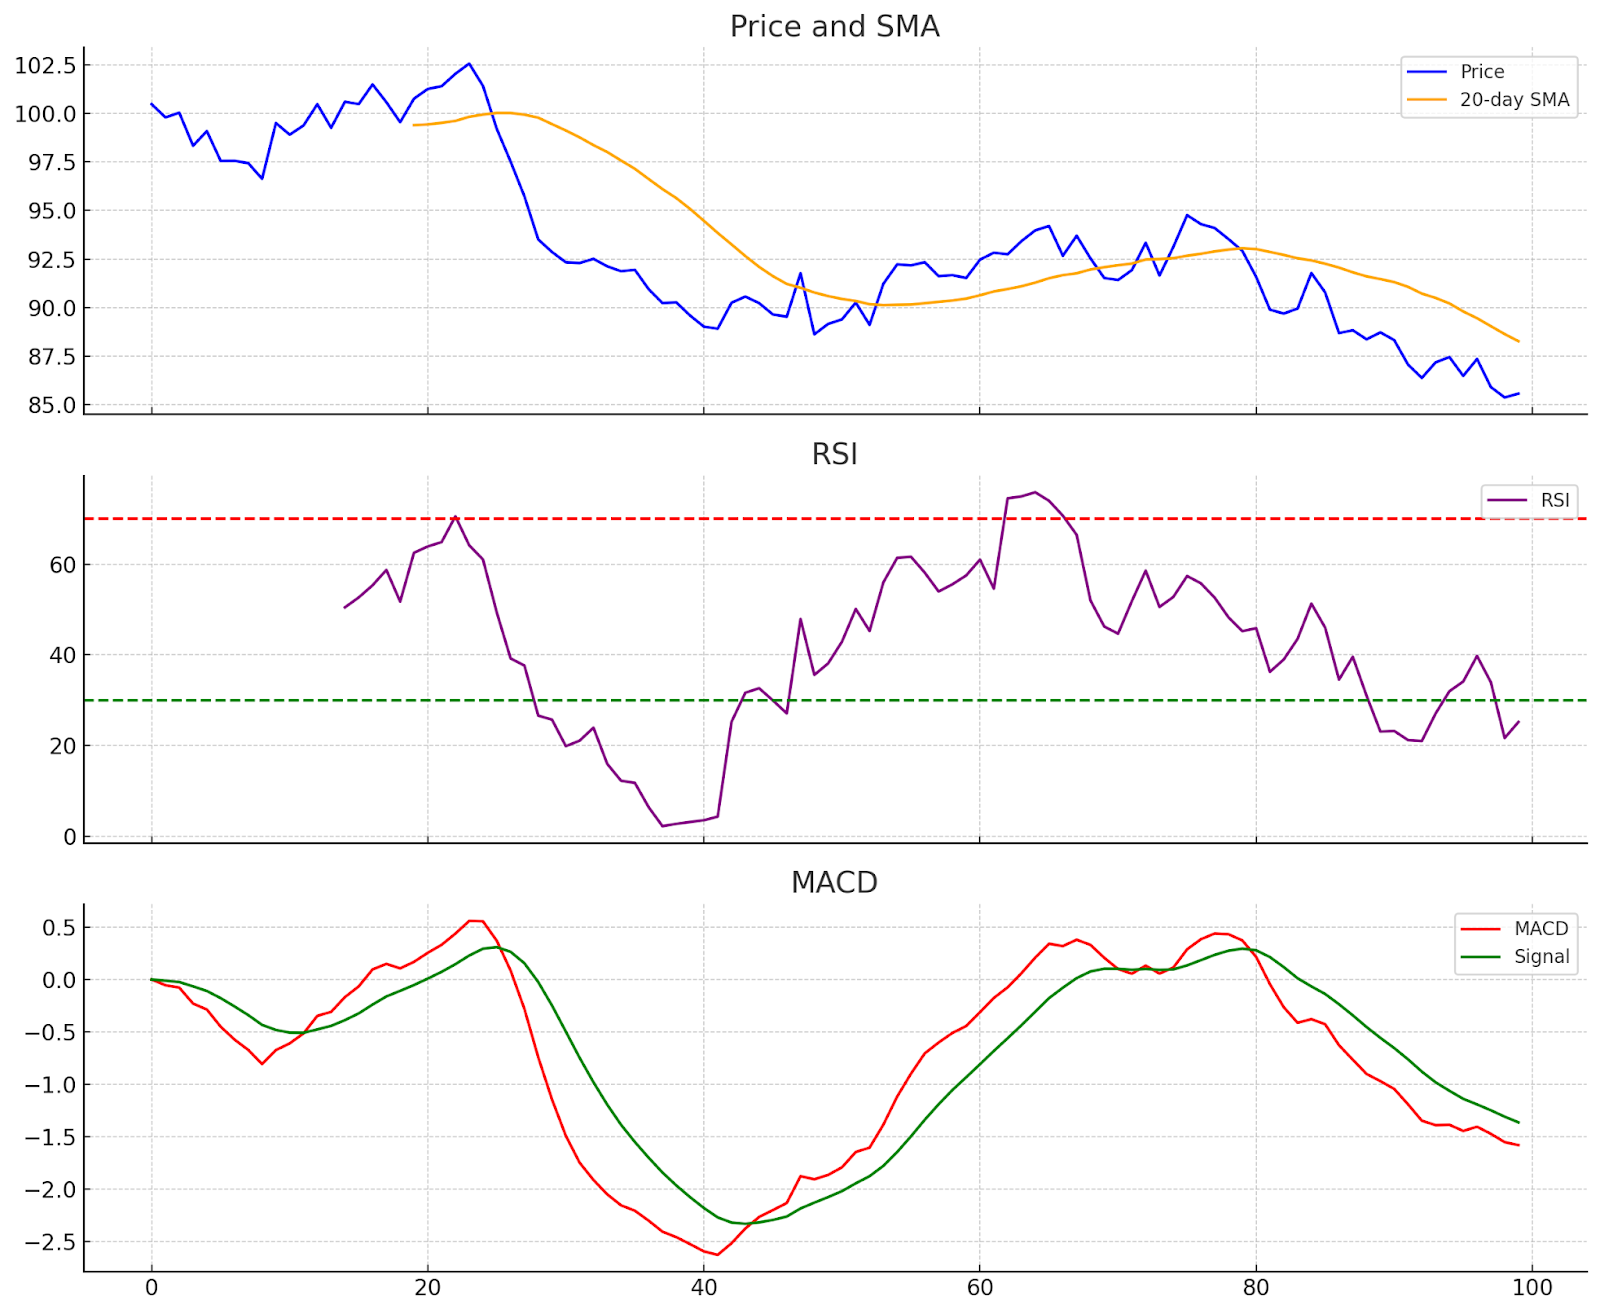
Technical traders rely heavily on indicators, which are mathematical calculations that help filter market “noise” by validating signals from basic patterns and trends. Popular indicators include:
The Relative Strength Index (RSI) compares recent gains to losses to gauge if an asset is overbought or oversold
Moving averages like the 20-day simple moving average (SMA) smooth price volatility to identify directional bias
The MACD (moving average convergence divergence) reveals relationships between two exponential moving averages (EMA) to generate buy/sell signals
Combining multiple indicators helps technical traders form quantifiable entry triggers aligned with patterns on the charts. Continually optimizing the parameters of favorite metrics also improves processes over time.
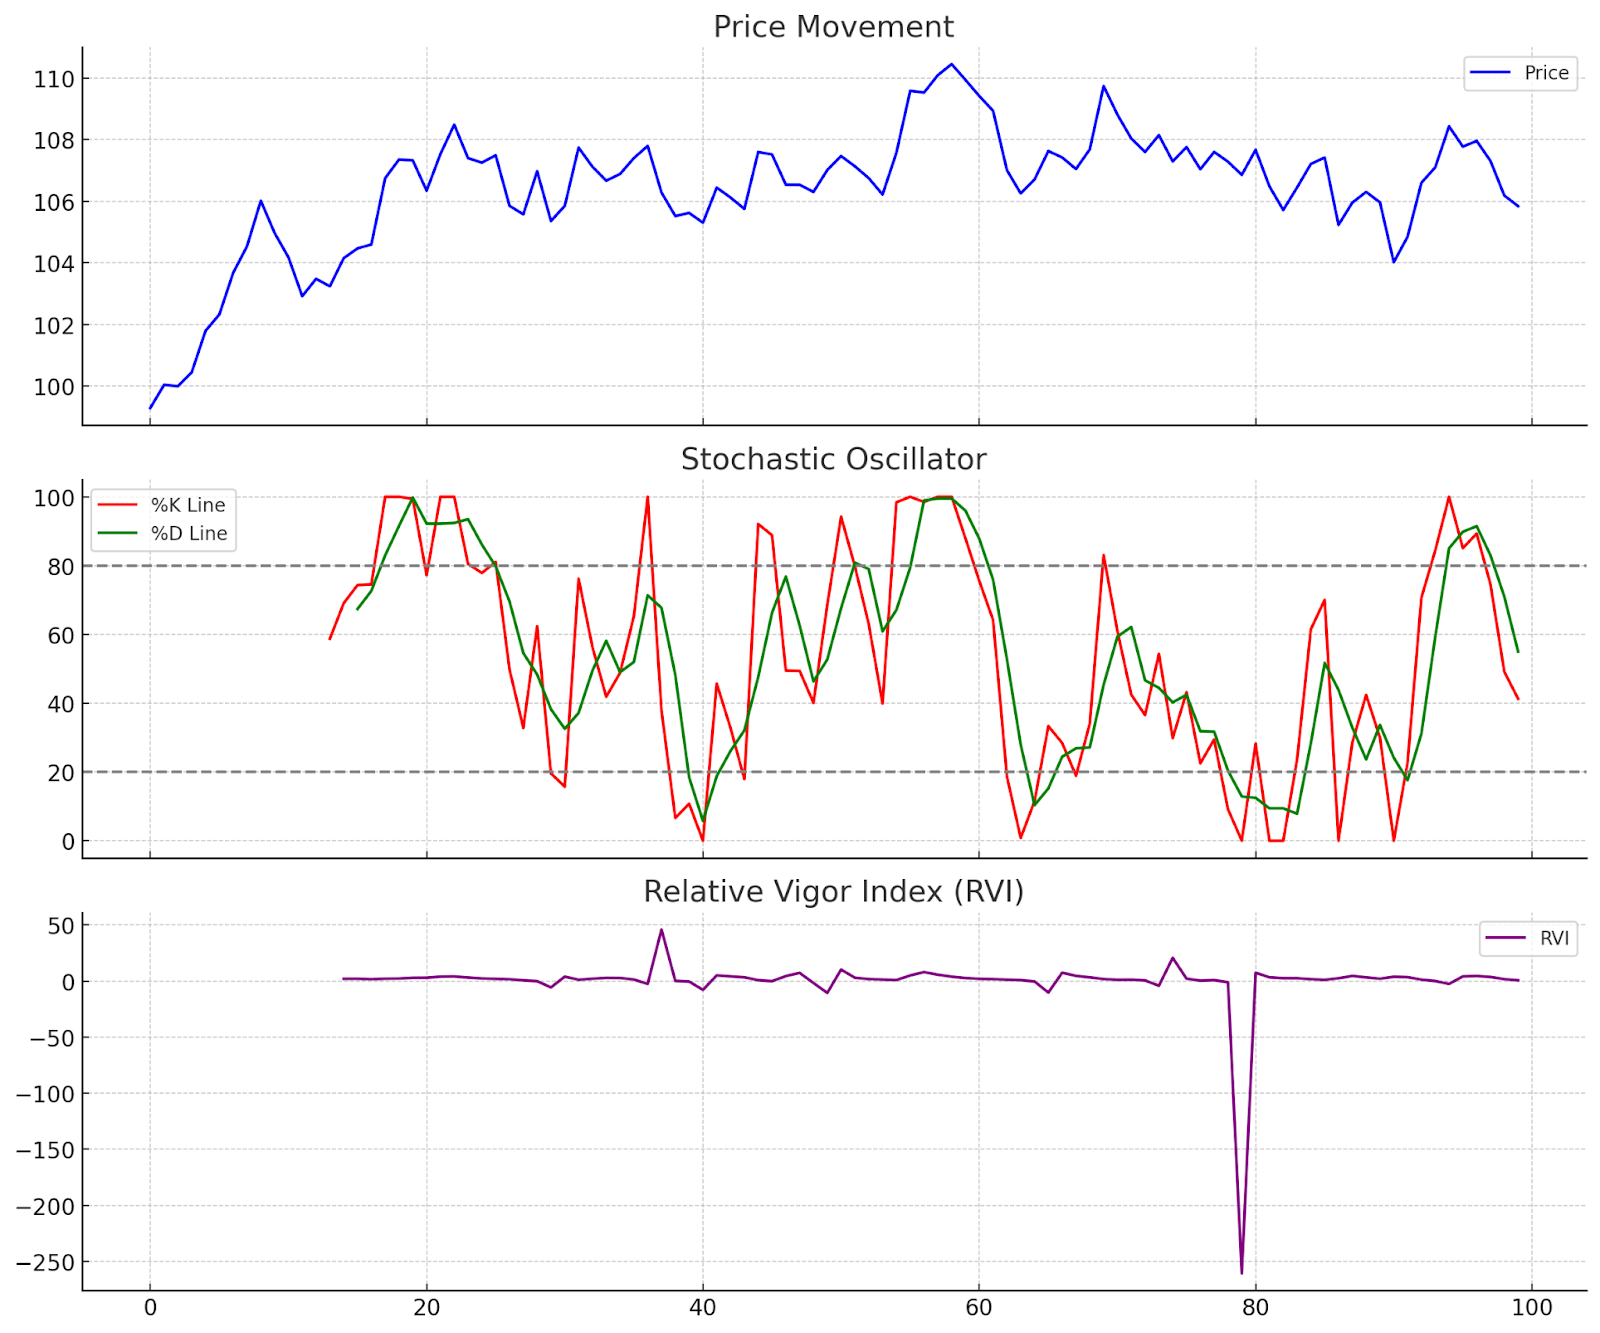
Oscillators measure momentum shifts independent of price by oscillating between fixed extremes. Popular ones for crypto include:
Stochastic indicators assess %K and %D lines that fluctuate from 0-100, with readings above 80 signaling overbought conditions.
Relative Vigor Index (RVI) compares price changes of varying periods to identify divergences before reversals.
Traders watch for oscillators breaking above or below extremes like the 80/20 lines, as well as confirming or contradictory divergences versus the price chart for trading opportunities.
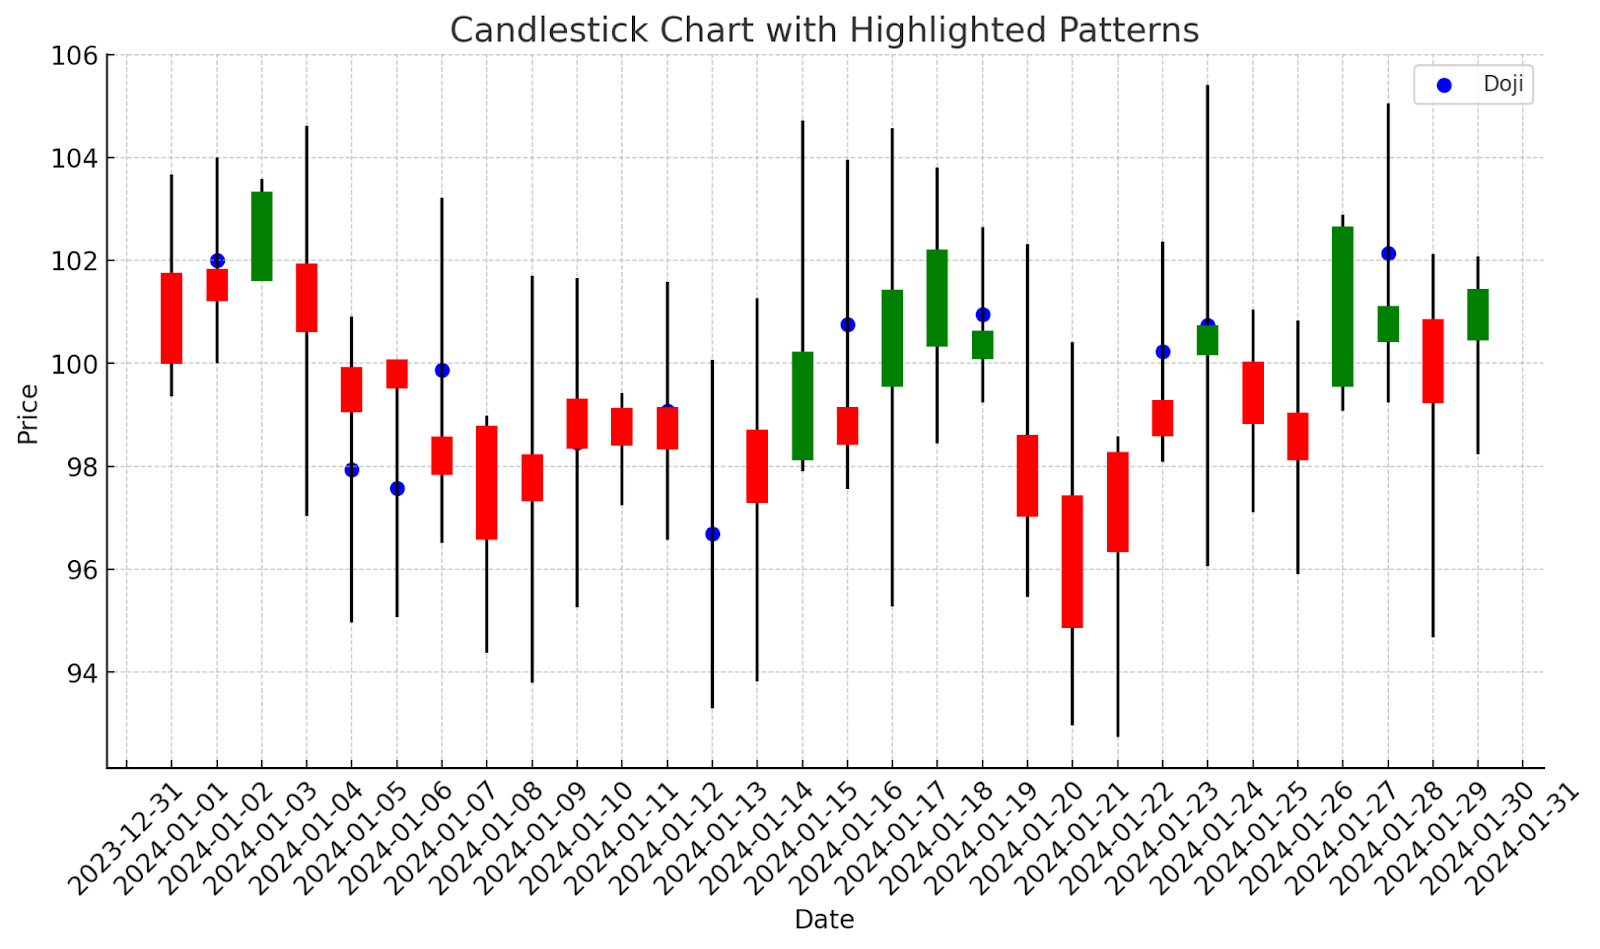
6. Candlestick Patterns
Japanese rice traders developed candlestick charting centuries ago, and it remains one of the most widely used technical analysis methods today. Each vertical candlestick represents one period (commonly one day) and visually depicts the open, close, high and low prices.
Dozens of patterns have been identified, like doji candles, hammer candles, and engulfing patterns. Candlestick patterns can provide insight into momentum and sentiment shifts. Many traders combine them with other techniques for enhanced signals.
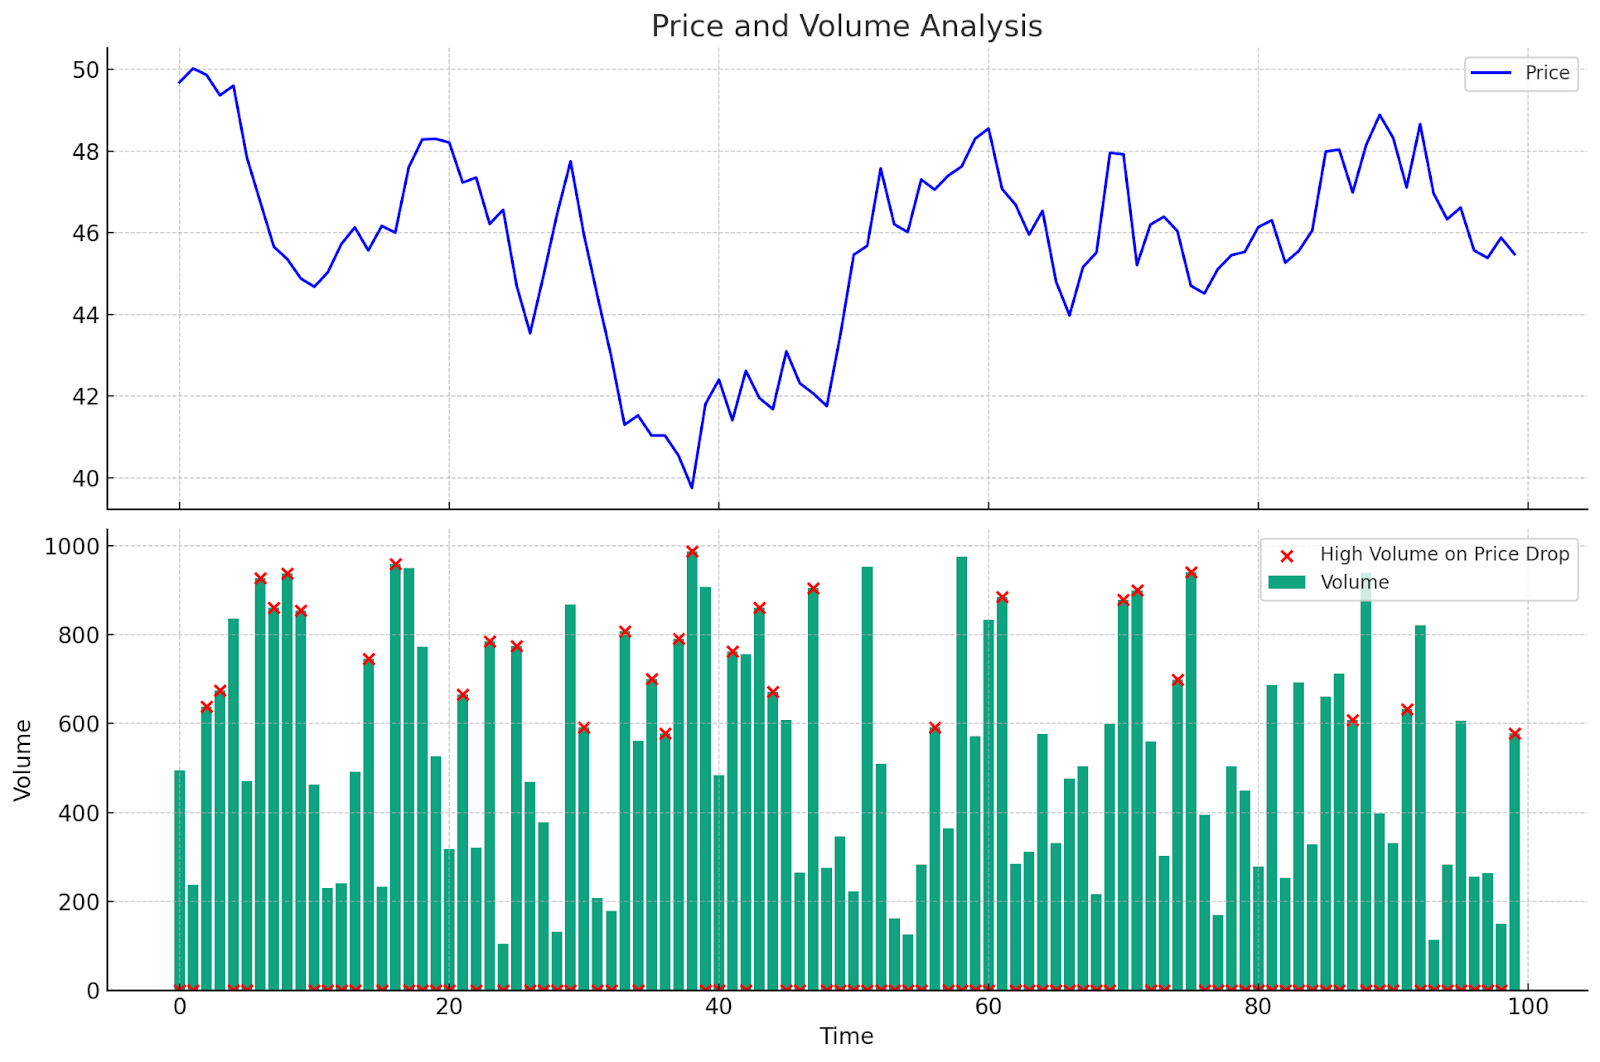
7. Volume Analysis
Volume tells the full price action story by quantifying participation behind moves. Heavy volume accompanying advances often confirms underlying strength, while drops against thinning volume signal weakness. Volume profile charts distribute trading activity across price levels to identify significant support/resistance zones.
Join UEEx
Experience the World’s Leading Digital Wealth Management Platform
Traders watch for divergences between volume and price trends too, which can precede short-term reversals. Maintaining a volume perspective enriches any technical strategy.
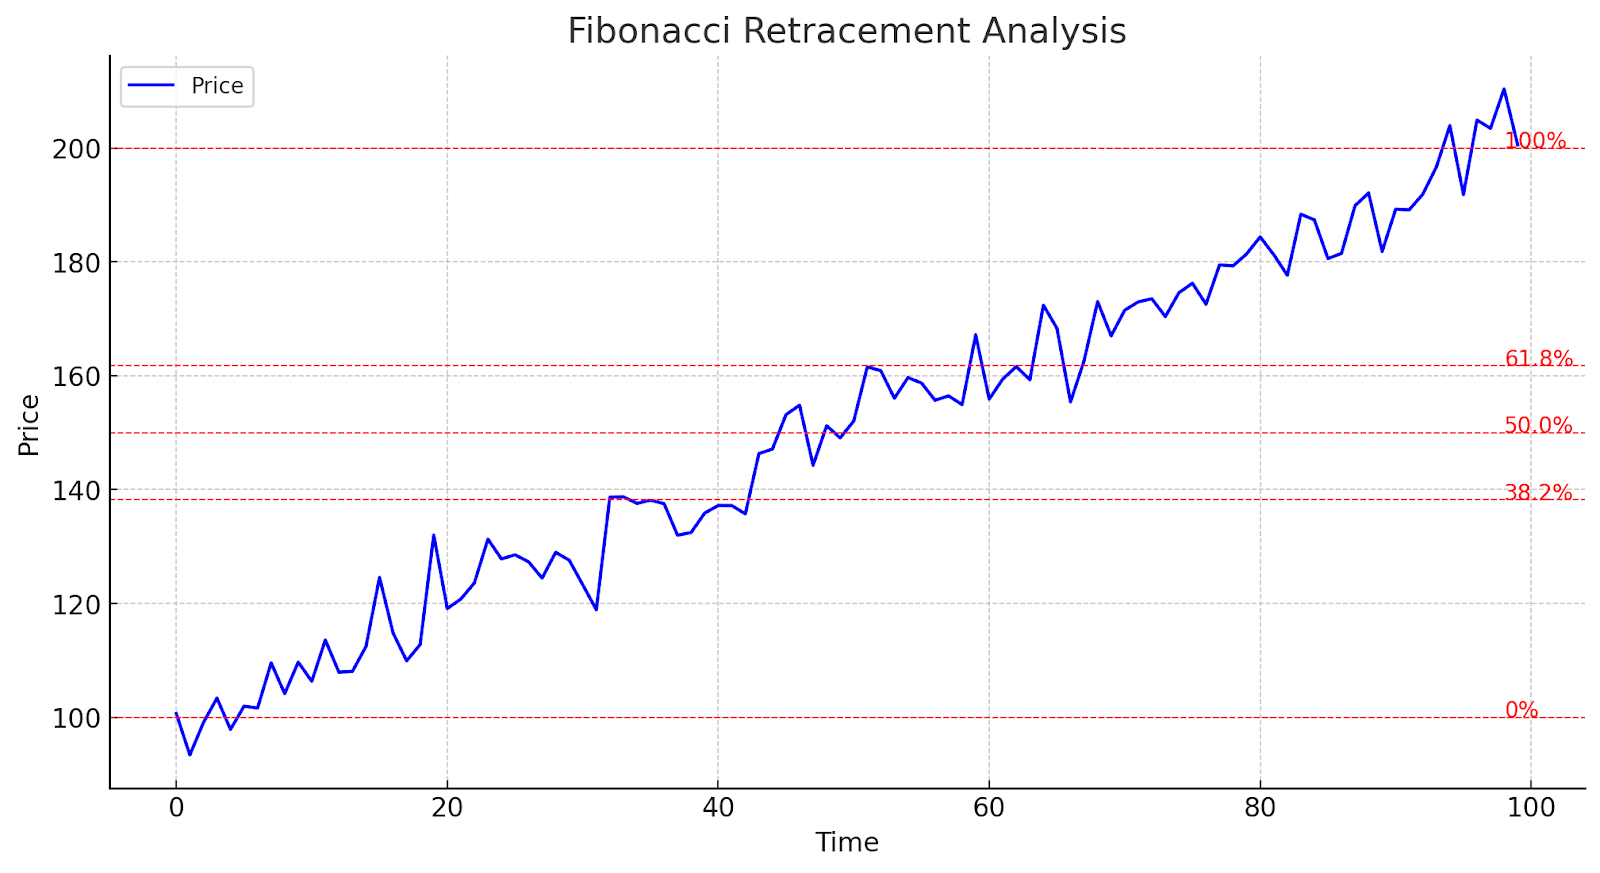
8. Fibonacci Retracement
The Fibonacci sequence has fascinated traders for generations. By applying Fibonacci ratios (most commonly 38.2%, 50%, and 61.8%) to the recent price range, technical analysts can identify potential support and resistance levels where a retracement may halt.
This technique is commonly used after trends or large moves to predict where pullbacks might stop. While not a perfect system, Fibonacci retracements provide structure and have proven useful over the long run.
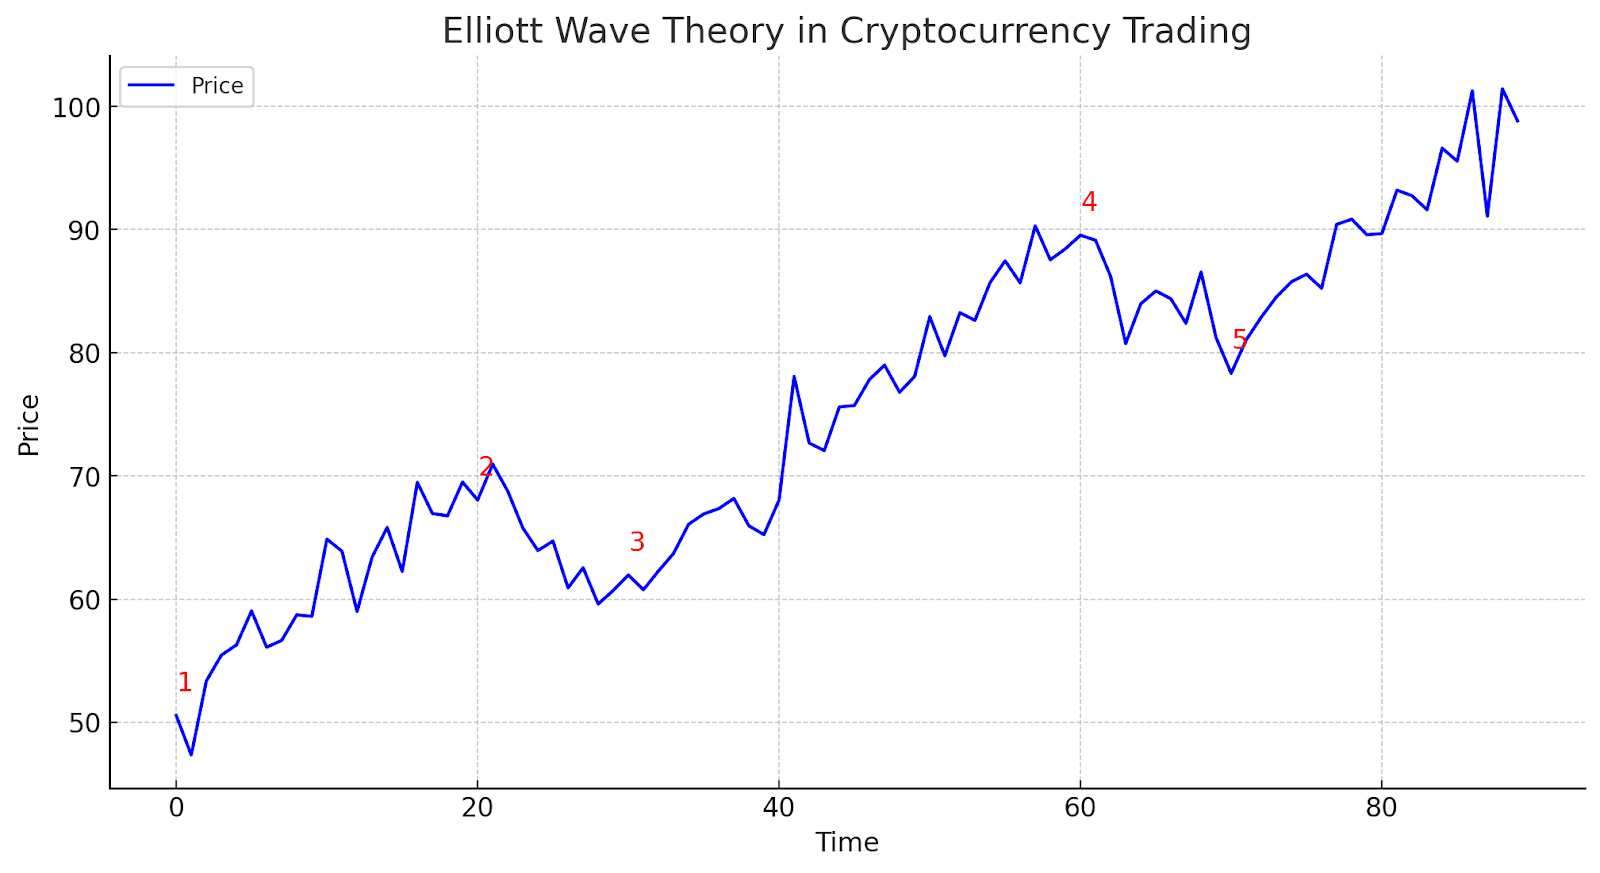
9. Elliott Wave Theory
Elliott Wave Theory is a technical analysis approach that suggests that price movements follow repetitive wave patterns. It divides price movements into impulse waves (trending moves) and corrective waves (counter-trend moves). Traders use Elliott Wave analysis to identify potential price targets, determine the overall market trend, and anticipate reversals based on wave counts and Fibonacci retracement levels.
Indicator-Based Strategies in Action
To demonstrate one approach in practice, let’s analyze Bitcoin (BTC) using several indicators:
Short-Term Indicators: The stochastic, RSI and MACD often provide early signals of short-term momentum shifts. Stochastic divergences or RSI moves outside the 30-70 range can precede 1-4 hour moves.
Intermediate Trends: The 20-day SMA identifies Bitcoin’s general direction. Crossovers preceded larger reactions over the past year. When prices trade decisively above/below this line, medium-term bullish/bearish postures strengthen.
Longer Horizons: The 200-day SMA represents a pivotal line separating bull and bear cycles over the previous decade for BTC. A conclusive daily close above likely inflates next cycle’s parabolic peak.
Confirmations: Rather than relying on any single indicator, traders employ multiple metrics in consensus to validate signals. Only entering positions aligned with shorts, intermediates and longer perspectives optimizes risk-reward.
This example shows how indicator strategies inform decisions across time frames together, emphasizing confirmations over isolated views that often mislead. Corroborating evidence reduces the probability of trading false breakdowns or breakouts.
Final Thoughts
In conclusion, the various technical analysis lenses framed here each emphasize unique qualities of historical market data to inform trading. Rather than limiting approaches, consider how integrating patterns analysis, indicators, oscillators, order flow nuances, volume context and trend tools builds resilience across market conditions over the long run.
Mastering multiple related but diverging perspectives ultimately sharpens one’s perception of cryptocurrency opportunities. Continual growth remains the goal.
Join UEEx
Experience the World’s Leading Digital Wealth Management Platform
Disclaimer: This article is intended solely for informational purposes and should not be considered trading or investment advice. Nothing herein should be construed as financial, legal, or tax advice. Trading or investing in cryptocurrencies carries a considerable risk of financial loss. Always conduct due diligence before making any trading or investment decisions.