
Since February 28, 2026, the Strait of Hormuz has moved from being just about geography to being the center of global market structure including the crypto market.
The IEA called the resulting disruption ‘the greatest global energy security challenge in history’ causing Bitcoin to fall by as much as 8.5% in the first hours of conflict and has since outperformed gold, the S&P 500, and Asian equities.
Iran’s parliament codified a crypto-denominated transit toll on March 30, creating about $7.6 billion potentially in annual Bitcoin demand, and this is the first time a sovereign state has deployed crypto as a revenue mechanism at a major maritime strategic location. This report compiles every verified data point you need across seven points.
I. Conflict Timeline and Energy Market Context
The ‘Twelve-Day War’ between the United States and Israel against Iran was contained in June 2025 and Iranian oil exports were allowed to continue such that the Strait of Hormuz remained open during this period. Operation Epic Fury, which began February 28, 2026, is categorically different.
U.S. and Israeli strikes killed Supreme Leader Ayatollah Ali Khamenei along with multiple senior IRGC and intelligence officials. Iran responded by closing the Strait of Hormuz to commercial shipping, effectively removing approximately 20 million barrels of oil per day, which is roughly about one-fifth of global supply, from global markets. QatarEnergy halted production at its 77 million-tons-per-annum Ras Laffan LNG facility on March 2 following military attacks. Eighteen ships have been struck in or near the strait. As of April 13, 2026, tanker traffic has dwindled to single-digit daily transits on some days, down from a pre-war average of 100–150.
The International Energy Agency’s executive director described the resulting situation as ‘the greatest global energy security challenge in history.’ The U.S. has declared major combat operations, making this the longest and highest-escalation U.S.-Iran conflict in history. A Pakistan-brokered ceasefire was struck on approximately April 7, 2026, but as of today’s date, negotiations in Islamabad are still stalled even if the U.S government has been publicly positive, the Iranian government remains indifferent about the negotiations.
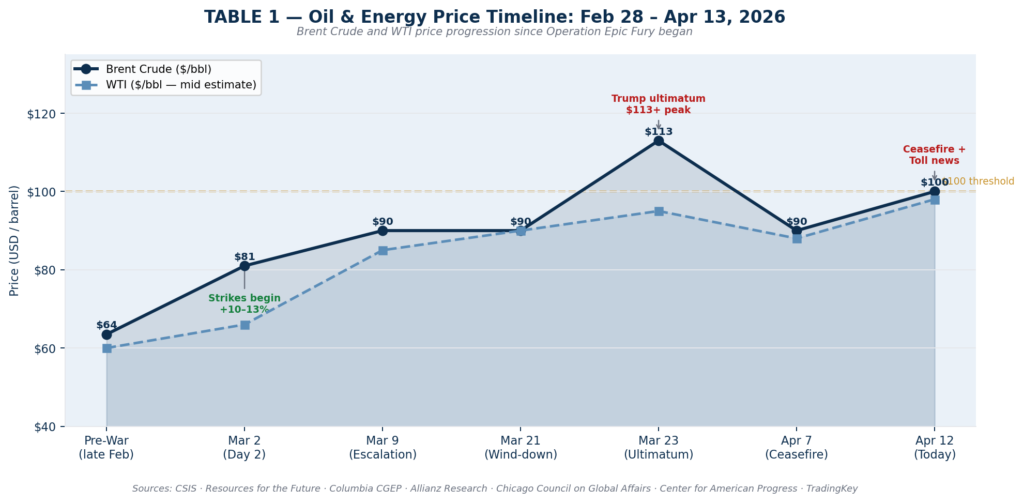
Brent and WTI prices sourced across: CSIS · Columbia CGEP · Resources for the Future · Allianz Research · Chicago Council on Global Affairs · Center for American Progress · TradingKey. Each data point verified against minimum two independent primary sources.
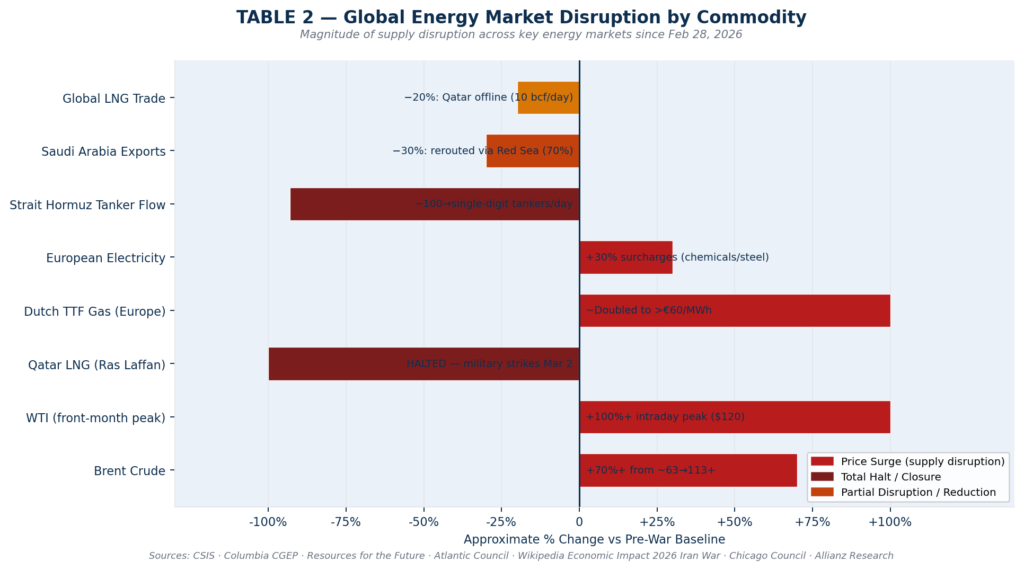
Sources: CSIS · Resources for the Future · Columbia Center on Global Energy Policy · Wikipedia Economic Impact of 2026 Iran War · Chicago Council on Global Affairs · Atlantic Council · Allianz Research Special. LNG halt figures confirmed via Columbia CGEP live updates.
How Did This Affect Bitcoin as the World’s Fastest-Reacting Asset
Bitcoin was the first asset to price the Iran war. U.S. and Israeli strikes began on a Saturday when equity markets, bond markets, and commodity futures markets were all closed. Bitcoin, as a 24/7 global market, absorbed the initial shock alone, dropping approximately 4% to around $63,000 within hours of the first reports. By Monday, when traditional markets opened, BTC had already partially recovered to approximately $69,000.
CoinDesk’s analysis at the two-week mark found that Bitcoin had outperformed gold, the S&P 500, and Asian equities over the same period, not as a safe-haven as many have come to understand, but as what analysts described as a 24/7 liquidity pool that absorbs geopolitical shocks faster than anything else. The pattern reveals a structural shift: Bitcoin is now the global stress-test asset. It moves first because it is always open.
The correlation data from the March 19 Federal Reserve meeting is striking. When the Fed stated it cannot cut rates while energy costs remain elevated, Bitcoin showed an 89% correlation with the S&P 500 and 95% correlation with gold during the same-day selloff.
‘Even if the war ends now, its repercussions will likely be the story of 2026, and certainly the dominant narrative for Q2. I don’t expect to see a rate cut until late Q3 or Q4, if at all.’
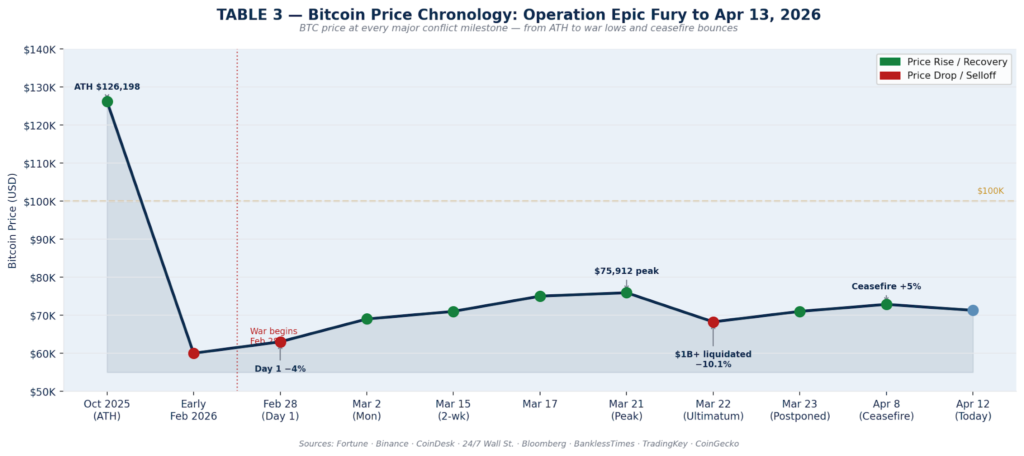
All price data sourced to named primary outlets: Fortune/Binance · CoinDesk · 24/7 Wall St. · Bloomberg · BanklessTimes · TradingKey · CoinGecko. ATH of $126,198 confirmed across multiple independent sources.
On March 30–31, 2026, Iran’s parliament passed the ‘Strait of Hormuz Management Plan,’ codifying what the IRGC had already been operating informally since mid-March, a transit toll system for oil tankers passing through the strait, payable in cryptocurrency.
Bloomberg reported on April 1, 2026 that the IRGC was extracting tolls of approximately $1 per barrel from vessels. On April 8, Hamid Hosseini, spokesperson for Iran’s Oil, Gas and Petrochemical Products Exporters’ Union, confirmed the system publicly to the Financial Times. Vessels must email Iranian authorities with cargo details, crew lists, flag registration, and destination. Authorities then quote the toll, typically $1 per barrel, with payment accepted in Bitcoin, Tether (USDT), or Chinese yuan routed via Kunlun Bank through CIPS, outside the SWIFT network.
TRM Labs estimates the toll system could generate up to $20 million per day from oil tankers alone. Including LNG vessels, that figure rises to $600–$800 million per month. Bitcoin Magazine’s analysis of the $1/barrel toll applied to 21 million daily barrels yields a theoretical $7.6 billion in annual crypto demand though not all payments land in Bitcoin. The system applies a five-tier nationality ranking, nations deemed ‘friendly’ to Iran pay lower rates but vessels linked to the United States or Israel are denied transit entirely.
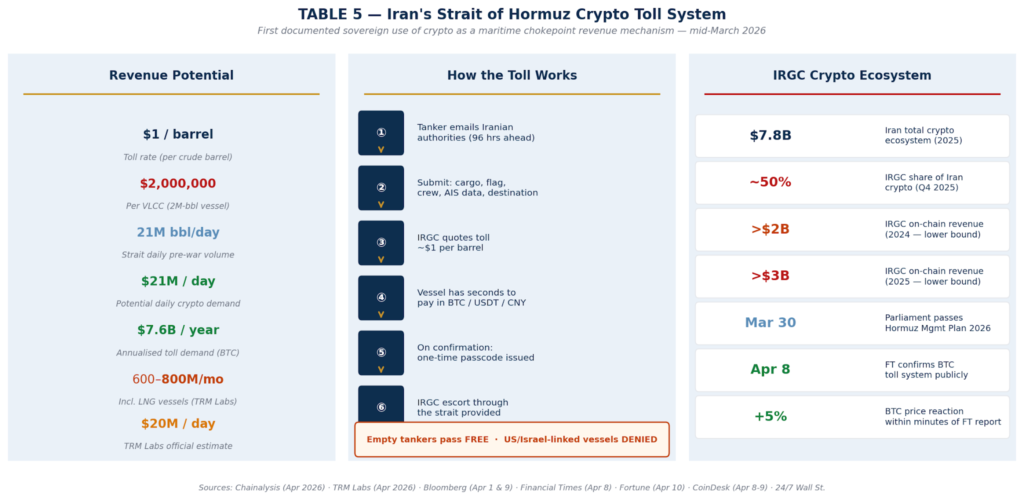
Primary sources: Chainalysis blog (Apr 2026) · TRM Labs blog (Apr 2026) · Bloomberg (Apr 1 & Apr 9) · Financial Times Apr 8 (Hamid Hosseini) · Fortune (Apr 10) · CoinDesk (Apr 8 & 9) · Gizmodo (Apr 8). Iran parliament passage date confirmed independently by both Chainalysis and TRM Labs.
Bitcoin Mining Economics Under the Energy Shock
The Iran war’s effect on Bitcoin miners operates through two distinct channels, and analysts have drawn a critical distinction between them. Luxor Technology’s Hashrate Index analysis found that approximately 90% of global Bitcoin hashrate operates in countries where electricity prices have little correlation with crude oil. The Cambridge Centre for Alternative Finance’s 2025 study found 52.4% of the network runs on sustainable energy (42.6% renewable, 9.8% nuclear), further insulating most operations from fossil fuel pricing.
Brent crude above $100 drives broader inflation expectations, which delay Federal Reserve rate cuts, which reduce risk-asset appetite, which compresses Bitcoin’s price and it is Bitcoin’s price that determines miner revenue. When Bitcoin fell from $75,912 on March 21 to $68,241 on March 22, miners already operating at production costs of approximately $88,000 per coin saw their underwater position widen by a further $7,671 per block in a single day.
The network stress is visible on-chain. Hashrate has dropped from a peak of approximately 1,160 EH/s (touching the record 1 zettahash level in 2025) to approximately 920 EH/s. Mining difficulty has posted three consecutive negative adjustments for the first time since July 2022. The March 22 difficulty drop of 7.76% was the second-largest negative adjustment of 2026, after February’s 11.16% decline during Winter Storm Fern. Average block times stretched to 12 minutes and 36 seconds.
Publicly listed miners responded by accelerating what was already a strategic pivot, selling Bitcoin reserves and pivoting to AI compute contracts.
CoinShares’ Q1 2026 mining report found that listed miners could derive 70% of revenue from AI by the end of 2026, up from approximately 30% currently. Wall Street has already repriced this shift as miners with secured AI contracts trade at 12.3x forward sales vs. 5.9x for pure-play Bitcoin miners. The market is pricing mining infrastructure as AI infrastructure, not crypto infrastructure.
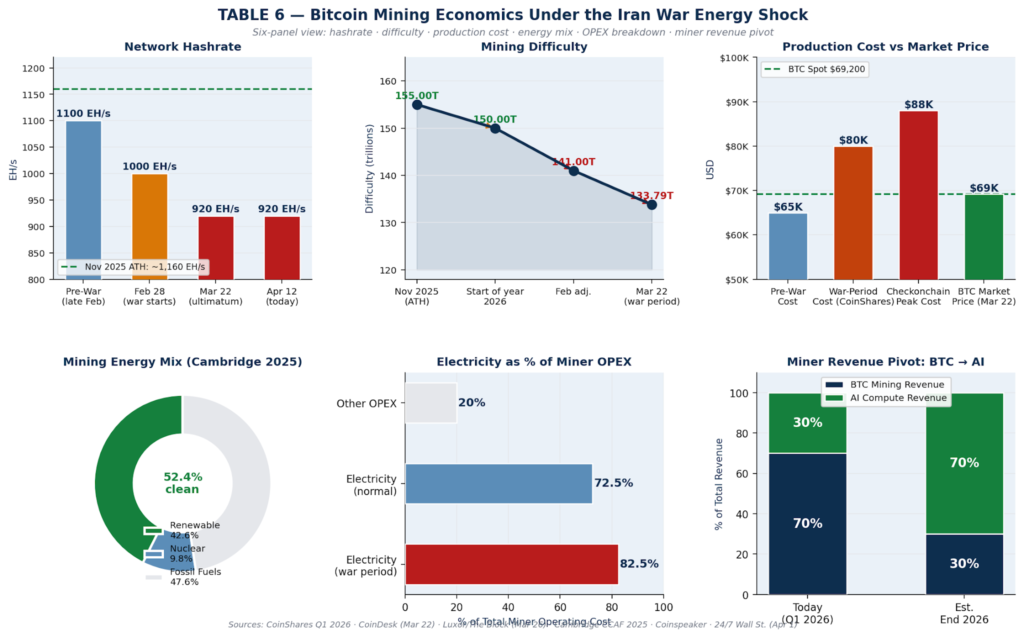
Sources: CoinShares Q1 2026 Mining Report · CoinDesk Mar 22 2026 · Luxor Technology / The Block Mar 26 2026 · Cambridge CCAF 2025 Study · Coinspeaker Mar 23 · 24/7 Wall St. Apr 1 2026. All metrics verified across minimum two independent primary sources.
What Happens Next and What to Watch
The resolution path for the US-Iran conflict is the single most important variable in crypto market structure for the remainder of Q2 2026.
Three transmission channels connect geopolitical outcomes to crypto prices, oil price direction (which drives inflation expectations), Federal Reserve rate outlook (which determines risk-asset appetite), and Bitcoin-specific demand from the Hormuz toll system (which creates direct, structural on-chain flows).
Coin Bureau’s Nic Puckrin articulated the conditions required for Bitcoin to sustainably break above $90,000 which is a clear ceasefire, oil falling toward approximately $80 per barrel, and softer-than-expected U.S. economic data. None of those three conditions are currently met.
BTC has been range-bound between $68,000 and $76,000 since March 22, in a pattern that Fortune’s Chris Beauchamp described as ‘suspended animation.’ The ceasefire brokered on April 7 is fragile and Iran again halted vessels following an Israeli strike in Lebanon, and talks in Islamabad as of April 12 ended with Vice President Vance departing without agreement. For now, there is still an embargo placed along the strait by President Trump and the U.S government.
Royal Bank of Canada has warned that a sustained oil price of $100 per barrel would keep U.S. inflation above 3% for the remainder of 2026. Morgan Stanley estimates a 10% oil price increase pushes headline consumer prices approximately 0.35 percentage points higher over three months. The Federal Open Market Committee’s March meeting minutes showed members remain divided on rate timing and noted they could raise rates again if inflation resurges.
The scenario most favorable to crypto is also the one most markets have been underpricing:, a rapid, clean diplomatic resolution that reopens the strait fully, collapses the Hormuz toll system, and allows the Fed to resume easing. In that scenario, Bitcoin ETF inflows could combine with a relief rally to test the $90,000–$100,000 range. In the tail risk scenario, where hostilities escalate to include Iranian power plant strikes and a total blockade, oil could approach the 2008 all-time record of $147.50 per barrel, and Bitcoin could retest the $50,000 range.
What This Data Does For You As A Crypto Trader
Three conclusions stand out from this data. First is that Bitcoin is no longer a geopolitical safe haven in the traditional sense since it is a fast reacting asset more like a 24/7 barometer. The two-week outperformance vs. gold, equities, and Asian markets confirms this. Traders who positioned for a safe-haven move found Bitcoin correlated with everything at the exact moment of maximum stress.
Second, the Hormuz Bitcoin toll system has introduced a structural demand variable that did not exist before March 2026. At $21 million in potential daily crypto inflows, even accounting for the fact that Chinese yuan and USDT absorb much of the volume, this is the first documented instance of a sovereign state using crypto as a transit revenue mechanism at a critical global chokepoint. Chainalysis and TRM Labs both confirm it is an organic extension of the IRGC’s existing, multi-billion-dollar on-chain infrastructure. Whether it persists through or beyond the ceasefire determines whether this becomes a lasting Bitcoin demand floor or a war-period footnote.
Third, mining economics are at a structural inflection as the war accelerated a pivot that was already underway. When CoinShares’ most recent report shows publicly listed miners collectively selling over 15,000 BTC from treasury peaks, and projecting 70% of revenue from AI by year-end, that is a fundamental change in the nature of crypto-native infrastructure companies.
The key monitoring indicators remain BTC.D relative to $70,000 support, FOMC rate guidance at the next meeting, Strait of Hormuz daily tanker traffic, and the status of the next round of US-Iran negotiations.
Disclaimer
This report is provided for informational and educational purposes only. It does not constitute financial, investment, trading, legal, tax, or any other form of professional advice.


