Crypto price elasticity analysis measures how sensitive demand for a cryptocurrency is to changes in its price – specifically, whether a given percentage price change produces a larger, smaller, or equal percentage change in trading demand or adoption. Assets with elastic demand shift sharply in response to price moves, while those with inelastic demand hold relatively steady. Understanding this distinction helps traders predict how markets behave during volatility, size positions appropriately, and build portfolios that match their risk tolerance. As of Q1 2026, research across 46 countries confirms that Bitcoin exhibits largely inelastic demand, while most speculative altcoins remain highly elastic and sensitive to sentiment shifts.
What Is Price Elasticity of Demand and How Does It Apply to Crypto?
Price elasticity of demand (PED) is an economic concept that quantifies the relationship between price changes and the resulting change in quantity demanded. In traditional economics, it’s expressed as:
PED = % Change in Quantity Demanded ÷ % Change in Price
Applied to crypto, “quantity demanded” is typically proxied by trading volume, active wallet addresses, or new user adoption figures, since crypto doesn’t have traditional sales data the way consumer goods do.
The interpretation thresholds:
- PED > 1 (Elastic)- A 10% price drop causes demand to fall by more than 10%. Small price swings create large demand reactions. Most altcoins and speculative tokens fall here.
- PED < 1 (Inelastic)- A 10% price drop causes demand to fall by less than 10%. Demand remains relatively stable despite price movement. Bitcoin and Ethereum trend toward inelastic during mature market phases.
- PED = 1 (Unitary)- Price changes and demand changes are proportional. Rare in crypto markets.
See Also: Technical Analysis in Crypto Trading: Understanding Charts and Indicators.
Why Does Price Elasticity Matter for Crypto Investors?
Most crypto market analysis focuses on price charts, volume, and on-chain metrics. Elasticity adds a different layer – it tells you something about the structural resilience of demand for an asset, which matters for five specific reasons.
How Does Elasticity Affect Volatility Predictions?
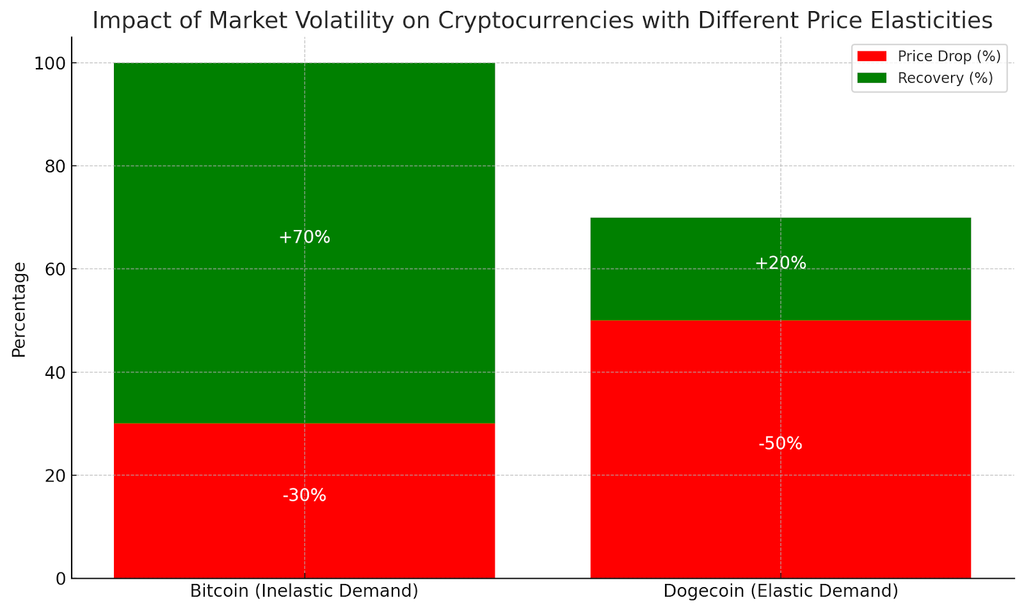
Highly elastic assets amplify volatility. When prices drop, elastic demand falls sharply too, creating a self-reinforcing downward spiral as sellers pile in and buyers retreat. Dogecoin’s behavior during the May 2021 crash illustrated this: a 65% price decline drove off a disproportionate share of demand because buyer conviction was thin and price-sensitive.
Inelastic assets behave differently. During the same period, Bitcoin dropped approximately 53% but recovered its demand base faster, with long-term holders absorbing sell pressure. Understanding this distinction helps traders set realistic expectations for drawdown depth and recovery speed across different asset classes.
How Does Elasticity Inform Investment Strategy?
In portfolio construction, the mix of elastic and inelastic assets determines how a portfolio behaves during market stress. A portfolio weighted heavily toward elastic altcoins will see steeper drawdowns and slower recoveries during broad market sell-offs. A portfolio anchored in inelastic assets like Bitcoin provides more stability, though potentially at the cost of upside in speculative rallies.
During the 2020 COVID-19 market crash, assets with inelastic demand – primarily Bitcoin and Ethereum – recovered their demand bases significantly faster than speculative altcoins, many of which took 12–18 months longer to return to pre-crash adoption levels.
What Does Elasticity Reveal About Market Sentiment?
Highly elastic demand signals that investor confidence is primarily price-driven rather than conviction-driven. When an asset’s demand collapses sharply on moderate price drops, it suggests that most holders entered for short-term gains rather than long-term utility – and will exit just as quickly when momentum reverses.
In Q1 2026, the selective nature of the crypto bull cycle demonstrated this clearly: Bitcoin maintained strong inelastic demand from institutional buyers, while many altcoins showed elastic demand patterns, with volume and new wallet activity declining sharply whenever prices pulled back from local highs.
Also Read: Crypto vs Bonds: Which One Belongs in Your Investment Mix
What Factors Determine a Cryptocurrency’s Price Elasticity?
No single factor determines whether a cryptocurrency’s demand is elastic or inelastic. Multiple variables interact, and elasticity for a single asset can shift over time as market structure evolves.
| Factor | Effect on Elasticity | Example |
| Utility / Use Cases | More utility = more inelastic | ETH demand supported by DeFi and smart contracts |
| Market Sentiment | Negative sentiment = more elastic | Meme coins collapse faster during fear cycles |
| Regulatory Changes | Hostile regulation = sharp elastic reaction | China mining ban 2021 – immediate demand shock |
| Substitutability | Easy substitutes = more elastic | Generic Layer-1 tokens face high substitution pressure |
| Speculative Trading % | High speculation = more elastic | New token launches driven by narrative momentum |
| Liquidity Levels | Low liquidity = more elastic (amplified moves) | Low-cap altcoins with thin order books |
| Network Effects | Strong network = more inelastic | Bitcoin’s Metcalfe-law demand base |
| Technological Upgrades | Positive upgrades = demand more inelastic | Ethereum’s Pectra upgrade supporting 2026–2026 demand |
| Market Maturity | Mature market = more inelastic | Bitcoin vs. newly launched tokens |
| Monetary Supply (M2) | Expanding M2 increases Bitcoin demand inelasticity | 2015–2026 cointegration: 1% M2 rise → 2.65% BTC price rise |
How Do You Calculate Price Elasticity for a Cryptocurrency?
Calculating PED for crypto requires a data-driven approach since “quantity demanded” isn’t directly observable the way it is for physical goods. Here’s a practical methodology:
What Data Do You Need?
- Historical price data- OHLCV (Open, High, Low, Close, Volume) for the asset over your chosen time window
- A demand proxy- Trading volume is the most accessible proxy; active addresses, transaction count, or new wallet creation are more precise but require on-chain data tools
- A defined time window- Elasticity varies across timeframes; measure across multiple windows (daily, weekly, monthly) for a complete picture
How Do You Apply the Formula?
Using consecutive periods (e.g., Week 1 vs. Week 2):
- Calculate percentage price change: (New Price – Old Price) / Old Price × 100
- Calculate percentage change in your demand proxy: (New Volume – Old Volume) / Old Volume × 100
- Divide: PED = % Change in Demand ÷ % Change in Price
- Take the absolute value – a negative sign indicates normal inverse relationship (price up, demand down)
- Interpret: above 1 = elastic, below 1 = inelastic
What Are the Limitations of This Calculation?
Volume as a demand proxy has known weaknesses. Wash trading – artificially inflated volume from coordinated buy-sell cycles – is widespread enough in crypto that raw volume figures from some exchanges are unreliable. Use data from trusted aggregators or on-chain metrics where possible. Also note that elasticity calculations are backward-looking; they describe past behavior, not future behavior. Market structure shifts – such as the introduction of Bitcoin spot ETFs in early 2024 – can change an asset’s elasticity profile significantly.
Also Read: Fractal Analysis Strategies for Maximizing Profits in Crypto Trading
How Does Elasticity Differ Across Asset Categories in 2026 and 2026?
As of Q1 2026, distinct elasticity profiles have emerged across major crypto categories:
How Does Bitcoin’s Elasticity Compare to Altcoins?
Bitcoin demonstrates predominantly inelastic demand, supported by several structural factors: institutional buying through spot ETFs, corporate treasury adoption, and long-term holder behavior from a mature investor base. A peer-reviewed study published in Humanities and Social Sciences Communications analyzing 46 countries found that developing economies show particularly inelastic Bitcoin demand, reflecting necessity-driven adoption for inflation hedging and remittances rather than speculative positioning.
Separately, a 2026 cointegration analysis covering 2015–2026 found a long-run M2-Bitcoin elasticity of approximately 2.65 – meaning a 1% increase in global M2 money supply is associated with a 2.65% increase in Bitcoin’s price. This relationship helps explain why Bitcoin demand holds up during monetary expansion even when speculative interest cools. Bitcoin peaked near $109,000 in January 2026; even during the subsequent pullback, demand metrics including ETF inflows and active address counts remained far more stable than price, confirming the inelastic demand pattern.
What About Ethereum and Smart Contract Platforms?
Ethereum occupies a middle position. Its demand is partially inelastic because ETH is consumed as gas for DeFi, NFT, and smart contract activity – use cases that continue regardless of ETH’s speculative price. Research on demand elasticities shows that ETH’s transaction fee elasticity is positive (unlike Bitcoin’s negative fee elasticity), reflecting its role as a utility token where fee demand rises alongside network usage.
Stablecoin growth on Ethereum also supports inelastic base demand: the stablecoin market cap on Ethereum grew substantially through 2026, requiring consistent ETH for gas even when speculative interest cools.
How Do Stablecoins and Meme Coins Compare?
Stablecoins by design have near-perfectly inelastic demand with respect to their own price – a $1.00 stablecoin that briefly trades at $0.998 doesn’t cause holders to abandon it in large numbers. The elasticity question for stablecoins is more about aggregate stablecoin market size relative to crypto prices overall.
Meme coins represent the extreme elastic end of the spectrum. Dogecoin’s 2021 social media-driven surge and subsequent collapse demonstrated how quickly elastic demand can reverse when narrative momentum fades. As of 2026, narrative-driven altcoins continue to show the same pattern – sharp rallies on positive sentiment and equally sharp demand collapses when narratives shift, without the underlying utility to sustain a demand floor.
How Can Traders Apply Price Elasticity Analysis in Practice?
Understanding elasticity conceptually is useful; applying it operationally is where it generates actual trading value.
- Position sizing- Elastic assets warrant smaller position sizes given their tendency for demand to collapse rapidly during price drops. Inelastic assets support slightly larger allocations for buy-the-dip strategies.
- Entry timing- During broad market sell-offs, elastic assets often fall disproportionately relative to fundamentals. Identifying assets where demand remains inelastic despite price drops can signal better entry points for recovery trades.
- Stop-loss placement- Elastic assets require wider stops to avoid being shaken out by high-volatility demand swings, but also need tighter risk management because the downside can be severe and sustained.
- Portfolio construction- A balance of inelastic (Bitcoin, Ethereum) and selective elastic (high-conviction altcoins) exposures creates a portfolio that participates in bull market upside while maintaining structural resilience during corrections.
- Exchange pricing and market-making- For projects and market makers, understanding demand elasticity informs fee-setting, liquidity provision, and token supply management decisions.
Also Read: Crypto Market Microstructure Analysis: All You Need to Know
What Are the Limitations of Crypto Price Elasticity Analysis?
Price elasticity analysis is a useful tool, but it carries important caveats specific to crypto markets:
- Crypto demand has no perfect proxy. Volume, addresses, and transactions each capture different aspects of demand and can diverge significantly.
- Elasticity is regime-dependent. An asset may exhibit inelastic demand during a bull market and elastic demand during a bear market as speculative holders exit.
- Regulatory shocks can override structural elasticity patterns. A sudden ban or enforcement action can make even historically inelastic assets show sharp demand collapses.
- Market manipulation – wash trading, coordinated pump-and-dumps – distorts the data inputs needed for accurate elasticity calculation, particularly for smaller-cap tokens.
- Cross-asset correlation in crypto means that Bitcoin’s price elasticity conditions can influence apparent elasticity readings for all other assets, making it difficult to isolate individual asset behavior.
- The M2-Bitcoin relationship, while statistically significant over 2015–2026, is not guaranteed to hold in future monetary regimes or under structural market changes.
Practical Tips for Using Price Elasticity in Your Crypto Analysis
- Start with on-chain data, not just exchange volume. Active addresses and transaction counts are harder to manipulate than volume and give a cleaner signal of genuine demand changes. Tools like Glassnode, Santiment, and Nansen provide this data for major assets.
- Compare elasticity across market regimes. Calculate PED during bull phases and bear phases separately. Assets that remain inelastic in both regimes are structurally stronger holds than those that only show inelastic demand during uptrends.
- Use elasticity to sanity-check narratives. When a project claims its token has “strong fundamentals,” measure whether its demand actually held up during recent price drops. If demand collapsed as fast as price, the fundamentals may be narrative-driven rather than utility-driven.
- Track stablecoin inflows as a cross-asset elasticity signal. Large stablecoin inflows to exchanges indicate that buyers are ready to purchase dips – a signal that overall crypto market demand is more inelastic than price action might suggest.
- Monitor M2 growth alongside Bitcoin demand data. Given the long-run elasticity of 2.65 between M2 and Bitcoin prices, periods of monetary expansion historically support stronger Bitcoin demand. This macro backdrop is one of the factors that makes BTC demand more inelastic than most crypto assets.
- Reassess quarterly. Market structure shifts – ETF approvals, protocol upgrades, regulatory changes – can alter an asset’s elasticity profile significantly within a few months. An analysis done in early 2026 may not reflect conditions accurately by Q1 2026.
FAQ
Q1: What does it mean when a cryptocurrency has inelastic demand?
Inelastic demand means that the quantity of an asset demanded changes by a smaller percentage than its price change. For a cryptocurrency, this typically indicates strong holder conviction, genuine utility beyond speculation, or limited substitutes. Bitcoin’s inelastic demand profile means that even during significant price drops, a large portion of demand – from long-term holders and institutional buyers – remains intact, helping to create price floors during corrections.
Q2: Why do altcoins typically have more elastic demand than Bitcoin?
Most altcoins lack Bitcoin’s network effects, institutional adoption, and established store-of-value narrative. Their demand is driven more heavily by speculation and sentiment rather than utility or conviction, making it highly price-sensitive. When prices fall, holders with no fundamental thesis for owning the asset exit quickly. The absence of barriers to substitution – there are thousands of competing altcoins – increases elastic behavior across the board.
Q3: Can an asset’s price elasticity change over time?
Yes – elasticity is not fixed. Ethereum became less elastic as DeFi and smart contract adoption created genuine utility-based demand beyond speculation. Stablecoins entering Ethereum’s ecosystem created a persistent demand for ETH as gas regardless of price. Conversely, an asset can become more elastic if key use cases disappear, regulatory pressure increases, or better alternatives emerge. Tracking elasticity changes over time is more informative than a single-point calculation.
Q4: How is price elasticity different from volatility?
Volatility measures how much a price moves. Elasticity measures how demand responds to those price moves. An asset can be highly volatile (large price swings) but inelastic (demand doesn’t change much). Bitcoin demonstrates exactly this – significant price volatility while underlying demand metrics from institutional buyers remain relatively stable. Conflating the two leads to incorrect predictions about recovery timelines and demand floor levels.
Q5: Is price elasticity analysis useful for day traders or only long-term investors?
Both groups benefit, but in different ways. Long-term investors use elasticity to assess structural demand resilience when choosing which assets to hold through market cycles. Short-term traders apply it to understand how aggressively prices will move in response to news or volume shocks, and to identify assets where demand is likely to recover quickly after a sell-off. Combined with on-chain metrics and technical analysis, elasticity adds a fundamental demand dimension to shorter-term decision-making.
Q6: What does the M2-Bitcoin elasticity of 2.65 mean for investors?
Research covering 2015–2026 found that a 1% increase in global M2 money supply correlates with a 2.65% increase in Bitcoin’s price over the long run. This suggests Bitcoin functions partly as a monetary hedge – demand for it rises faster than the monetary supply itself expands. For investors, monitoring central bank policy and M2 trends can provide a macro signal for Bitcoin demand beyond purely technical or sentiment analysis.