

Bearish candlestick patterns are specific arrangements of one, two, or three price candles that signal a potential shift in market sentiment from bullish to bearish, suggesting that an uptrend may be losing momentum and a price decline could follow. They are formed through combinations of candle bodies, wicks, and position within the prior trend that reveal changing dynamics between buyers and sellers. These patterns are most reliable when confirmed by volume, momentum indicators, and technical confluence.
Key Takeaways
- Bearish candlestick patterns help traders identify potential market reversals and anticipate declining prices before they are fully established.
- The Bearish Engulfing Pattern indicates a shift from bullish to bearish sentiment with a larger bearish candlestick that fully engulfs a smaller preceding bullish candlestick.
- The Evening Star is a three-candlestick formation appearing at the peak of an uptrend: a long bullish candle, a small indecisive candle, and a long bearish candle that closes below the midpoint of the first.
- Dark Cloud Cover develops over two sessions: a bullish day followed by a bearish day that opens above the prior high but closes below the prior candle’s midpoint.
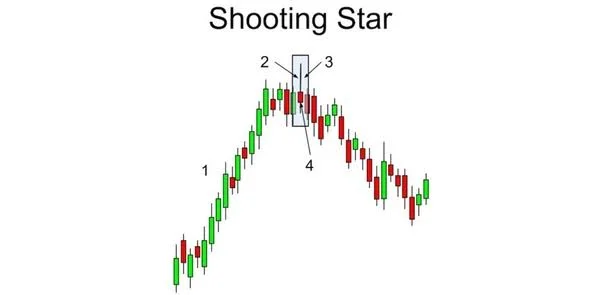
- The Shooting Star has a small body at the bottom and a long upper shadow, revealing that buyers drove prices higher during the session but sellers overwhelmed them before the close.
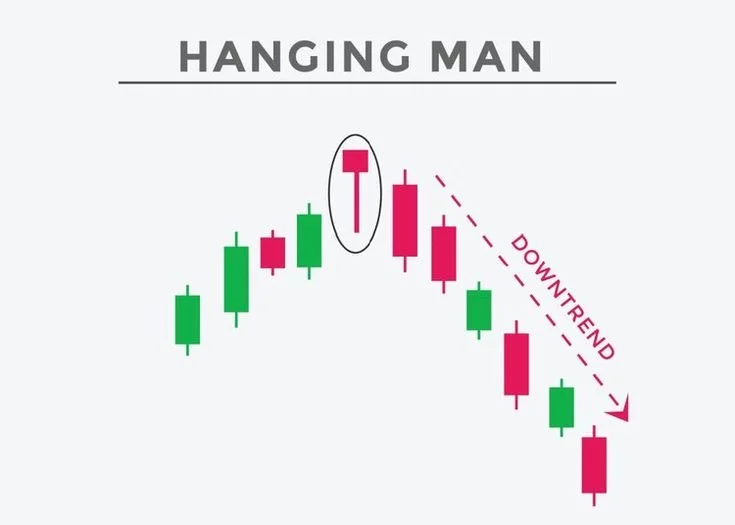
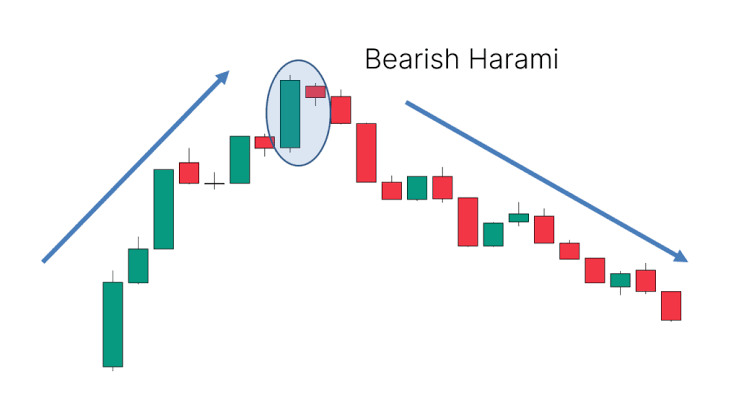
- The Hanging Man and the Bearish Harami are the subtler reversal signals, requiring stronger confirmation from other indicators before acting on them.
Read Also: How to Interpret Crypto Market Patterns for Successful Trading
What Are Bearish Candlestick Patterns?
Bearish candlestick patterns are technical indicators traders use to identify potential declines in the price of an asset. These patterns signal a shift in market sentiment from bullish to bearish, suggesting that the upward trend may be weakening or reversing. By analysing these patterns, traders can make more informed decisions about when to exit or adjust their positions, potentially avoiding losses and maximising profits.
Candlestick patterns originate from Japanese rice traders in the 18th century and have been refined by modern technical analysts into reliable tools for reading market psychology. Each candle on a price chart displays four key data points: open, high, low, and close. The body of the candle represents the range between open and close; the wicks (or shadows) represent the extremes reached during the session. Bearish patterns emerge when specific arrangements of bodies and wicks across one, two, or three candles reveal that buyers are losing control and sellers are gaining the upper hand.
Common bearish candlestick patterns include the Bearish Engulfing, Evening Star, Dark Cloud Cover, Shooting Star, Hanging Man, and Bearish Harami. Each provides a distinct signal of a possible downturn, representing different ways in which bearish sentiment overcomes prior bullish momentum.
Key principle: “While bearish candlestick patterns are useful, their reliability increases when used alongside other technical indicators and in conjunction with overall market trends.” Context is everything: a Shooting Star at the top of a major resistance level confirmed by RSI divergence is a much stronger signal than the same pattern in the middle of a range.
Pattern 01 of 06
Bearish Engulfing Pattern
Source: Medium
Two-Candlestick Pattern
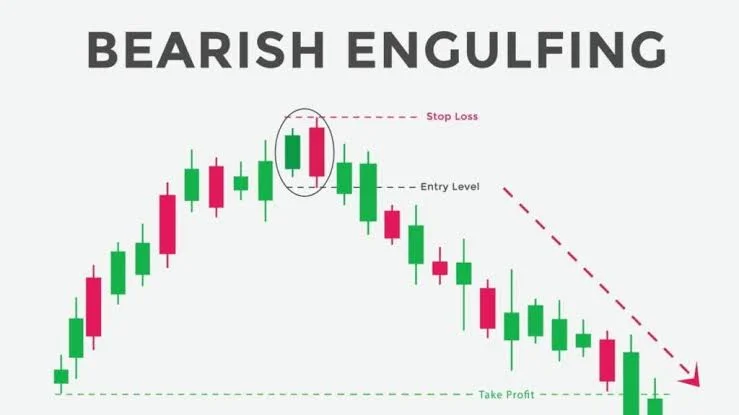
The Bearish Engulfing Pattern is a robust indicator often used by traders to signal a potential reversal in the price of an asset. This pattern consists of two candlesticks: the first is a smaller bullish candlestick (typically green or white) reflecting a continuation of an uptrend. The second, which follows immediately, is a larger bearish candlestick (red or black) that completely engulfs the body of the previous bullish candlestick. This engulfing action signifies a decisive shift in market sentiment from buyers to sellers.

Formation Requirements
- Appears after a sustained uptrend
- Day 1: small bullish body
- Day 2: large bearish body that fully engulfs Day 1 body
- Day 2 opens at or above Day 1 close and closes at or below Day 1 open
Confirmation Signals
- High trading volume on the bearish (Day 2) candle
- RSI divergence at the pattern level
- Pattern at a key resistance level or prior high
- Follow-through bearish candle on Day 3
How to Interpret the Bearish Engulfing Pattern
When observing a Bearish Engulfing Pattern, context is critical. This pattern is most significant when it occurs after a sustained uptrend. The initial bullish candlestick represents the last effort of buying pressure pushing prices higher. The subsequent larger bearish candlestick indicates that sellers have entered the market with substantial force, overpowering buyers and reversing the upward momentum. The larger the Day 2 candle relative to Day 1, and the higher the volume, the stronger the signal.
In crypto markets, Bearish Engulfing Patterns on the daily chart at all-time highs or major resistance levels are among the most watched reversal signals. Bitcoin’s late-October 2025 correction from its $126,200 all-time high was preceded by a series of bearish engulfing patterns on the daily chart over several sessions, confirming that selling pressure was mounting before the larger correction materialised.
Stop-Loss and Target for Bearish Engulfing Entries
For traders taking a short position on a Bearish Engulfing signal, the stop-loss is typically placed above the high of the Day 2 bearish candle. The initial target is the next significant support level below the pattern. Requiring a confirming bearish candle on Day 3 before entering reduces false signals at the cost of a slightly less favourable entry price.
Pattern 02 of 06
The Evening Star
Source: Living from Trading
Three-Candlestick Pattern
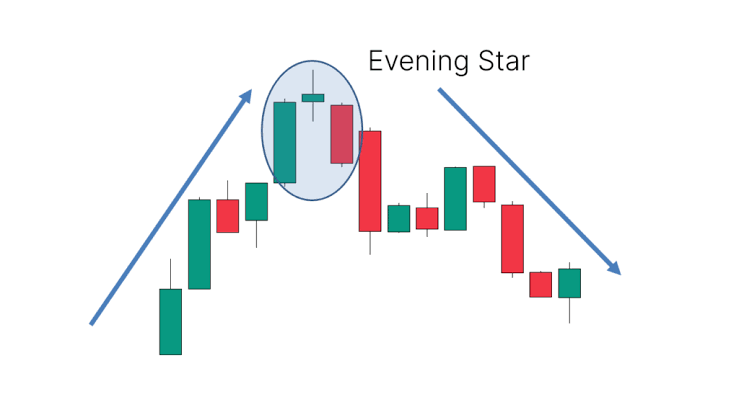
The Evening Star is a powerful three-candlestick formation that serves as a reliable signal for a bearish reversal at the peak of an uptrend. Each of its three candles plays a specific, distinct role:
Three-Candle Structure
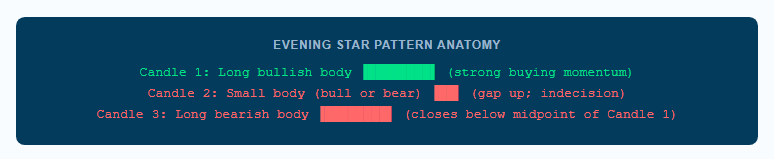
- Candle 1: Large bullish body; strong uptrend continuation
- Candle 2: Small body (doji or spinning top); gaps up from Candle 1; indecision
- Candle 3: Large bearish body closing below the midpoint of Candle 1
Key Confirmation Factors
- Gap between Candle 1 and Candle 2 (strengthens signal)
- Candle 3 closes deep into Candle 1 body (below midpoint is minimum)
- High volume on Candle 3
- Pattern at major resistance or Fibonacci level
How to Interpret the Evening Star
The first candlestick is a long bullish candle reflecting strong buying pressure and the continuation of the existing uptrend. It establishes bullish momentum. The second candlestick gaps up from the first, initially suggesting continuation, but the small body with little progress reveals that buying momentum is starting to wane. Buyers pushed prices slightly higher, but could not sustain that strength through the session, resulting in the indecisive small body. This candle represents the transition moment where the balance of power begins to shift.
The third and final candlestick is the confirmation: a long bearish candle that closes below the midpoint of the first candlestick. This strong selling close confirms that the initial bullish momentum has been effectively reversed. The deeper the Day 3 close penetrates into Day 1’s body, the stronger the reversal signal. The Evening Star is considered one of the most reliable bearish reversal patterns because it requires three sessions to form, giving multiple confirmation opportunities before the signal is complete.
The Evening Star is the bearish counterpart to the Morning Star, which signals a bullish reversal at the bottom of a downtrend with equivalent three-candle logic in the opposite direction.
Pattern 03 of 06
Dark Cloud Cover
Two-Candlestick Pattern
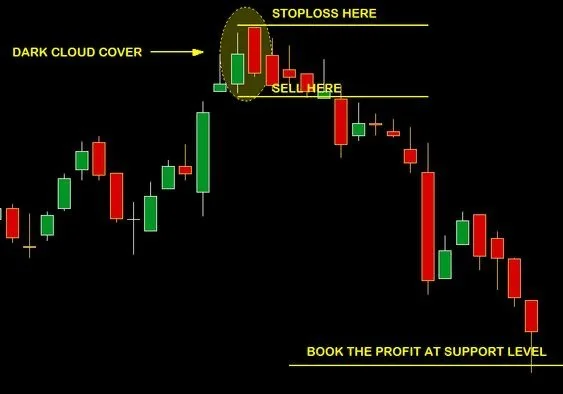
The Dark Cloud Cover pattern is a significant bearish reversal indicator that develops over two trading sessions. It helps traders identify potential shifts in market momentum by showing a specific failure of a bullish gap to hold.
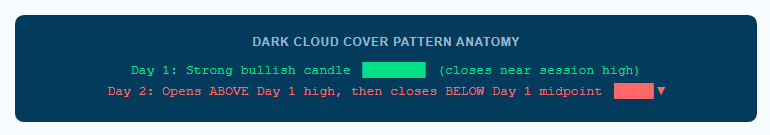
Formation Requirements
- Appears after a sustained uptrend
- Day 1: strong bullish candle closing near its high
- Day 2: opens above Day 1 high (bullish gap)
- Day 2: closes below the midpoint of Day 1 body
Distinguishing from Bearish Engulfing
- Dark Cloud Cover: Day 2 opens above Day 1 high but does NOT fully engulf it
- Bearish Engulfing: Day 2 fully engulfs Day 1 body entirely
- Dark Cloud Cover is slightly weaker; Bearish Engulfing is a stronger signal
- Both require follow-through for highest reliability
How to Interpret Dark Cloud Cover
The pattern starts with a strong bullish candlestick, characterised by a long body and a close near the day’s high, indicating strong buying pressure and optimism. On the following day, the market opens above the previous day’s high, initially appearing to continue the uptrend. However, as the day progresses, the price declines sharply and closes below the midpoint of the first day’s candlestick. This significant gap between the opening level (above Day 1’s high) and the closing level (below Day 1’s midpoint) represents the “dark cloud” covering what appeared to be a continuation of the rally.
The Dark Cloud Cover suggests that upward momentum is weakening and sellers are gaining control. The close below the midpoint of the previous day’s candlestick reflects a shift from bullish to bearish sentiment. Traders often view this as evidence that buying pressure is diminishing and selling pressure is increasing. The deeper the Day 2 close penetrates into Day 1’s body (the further below the midpoint it closes), the more reliable the signal becomes.
Trading note: The Dark Cloud Cover is most powerful when it appears after a significant uptrend at a major resistance level. The day-2 bullish gap that fails is the key element: it trapped latecoming buyers who bought the gap-up open and were immediately caught in a reversal, creating potential future selling pressure from their stop-losses.
Pattern 04 of 06
Shooting Star
Single-Candlestick Pattern
The Shooting Star is a pivotal single-candlestick formation that typically appears after an established uptrend, indicating a potential reversal in market direction. It is one of the most visually distinctive bearish patterns and one of the most widely watched reversal signals in both traditional and crypto markets.

Formation Requirements
- Appears after an established uptrend
- Small real body at the lower end of the trading range
- Long upper shadow: at least 2x the length of the body
- Little or no lower shadow
- Can be bullish or bearish body colour
What the Shape Encodes
- Price opened, buyers drove it sharply higher (the long upper wick)
- Sellers overwhelmed buyers and pushed price back down
- Price closed near or below the open (the small body)
- Sellers demonstrated dominance at this price level
How to Interpret the Shooting Star
The Shooting Star emerges during an uptrend. Initially, price rises significantly during the session, creating the long upper shadow and continuing the bullish narrative. However, the inability to maintain these higher levels results in a retreat, causing the price to close near the opening level. This forms the small body at the bottom of the candlestick, with the long upper shadow above it telling the story of buyers’ failed attempt to sustain higher prices.
The long upper shadow is the key element: it shows that despite buyers’ efforts to drive the price up, they could not sustain those gains by session close. The subsequent decline back to near the opening price signals that sellers entered the market forcefully at the session high, overpowering buyers and creating resistance at that level. A Shooting Star body that is red (bearish) rather than green (bullish) is considered a slightly stronger signal, as it confirms the close was below the open.
The Shooting Star pattern highlights resistance at higher price levels where sellers are positioned. In crypto, this pattern appearing at a prior all-time high, a major Fibonacci extension, or the upper boundary of a standard deviation channel creates a powerful multi-method confluence signal. Bitcoin has historically produced Shooting Star patterns at or near major cyclical tops, making them valuable signals for traders managing position risk during bull market peaks.
Shooting Star vs Inverted Hammer
The Shooting Star and the Inverted Hammer have identical shapes (small body at bottom, long upper shadow) but different contexts. The Shooting Star appears after an uptrend and is bearish. The Inverted Hammer appears after a downtrend and is bullish, signalling that buyers attempted to push prices higher despite the prevailing downtrend. Context within the prior trend is what defines the interpretation, not the candle shape alone.
Read Also: Momentum Indicators for Crypto Trading
Pattern 05 of 06
Hanging Man
Single-Candlestick Pattern
The Hanging Man is a notable single-candlestick formation that traders monitor as a signal of possible bearish reversal. It shares a visual similarity with the Hammer pattern (which is bullish) but appears in a completely different context: at the top of an uptrend rather than at the bottom of a downtrend.

Formation Requirements
- Appears after a sustained uptrend
- Small real body at the upper end of the trading range
- Long lower shadow: at least 2x the length of the body
- Little or no upper shadow
- Body can be bullish or bearish colour
Hanging Man vs Hammer
- Identical shape but opposite context
- Hammer: appears after downtrend (bullish signal)
- Hanging Man: appears after uptrend (bearish signal)
- The prior trend determines the interpretation entirely
- Hanging Man with bearish body colour is stronger signal
How to Interpret the Hanging Man
When the Hanging Man appears in an uptrend, it suggests that despite the ongoing bullish trend, there is growing selling pressure. The price declines significantly during the session, creating a long lower shadow. This indicates substantial selling activity as sellers exert considerable force during the session. However, by the end of the session, buyers manage to push the price back up close to the opening level, resulting in the small body at the top of the candlestick. This recovery shows buyers still have some influence, but the long lower shadow is a warning: sellers appeared with force during the session, and this may be a preview of coming reversal pressure.
The long lower shadow is the critical element. It reflects that although buyers attempted to maintain control, significant selling pressure emerged intraday. The notable decline and subsequent partial recovery within the same session indicate that sellers are becoming more aggressive. If the next session opens lower and confirms the reversal, the Hanging Man is validated. Without a confirming bearish follow-up candle, the pattern is considered less reliable and may simply be temporary volatility within a continuing uptrend.
Confirmation is critical: The Hanging Man is considered a weaker signal than the Shooting Star because the partial intraday recovery shows buyers were not completely overwhelmed. Always wait for a bearish confirming candle on the following session before taking action based on a Hanging Man signal. A bearish close below the Hanging Man’s body on Day 2 provides meaningful confirmation.
Read Also: Bullish Candlestick Patterns: Strategies for Successful Trading
Pattern 06 of 06
Bearish Harami
Two-Candlestick Pattern
The Bearish Harami (Japanese for “pregnant”) is a two-candlestick formation that signals a potential reversal in the market. It is among the subtler bearish patterns, representing a period of indecision and declining momentum rather than an outright reversal of buying pressure. The name refers to the visual appearance: the smaller second candle appears contained within the body of the larger first candle, like a child within a mother.

Formation Requirements
- Appears after a sustained uptrend
- Day 1: large bullish candle (strong buying momentum)
- Day 2: small bearish candle whose body fits entirely within Day 1 body
- Day 2 opens below Day 1 close and closes above Day 1 open
Bearish Harami Cross Variant
- Stronger variant: Day 2 is a doji (open and close nearly equal)
- Doji signals even stronger indecision than a small bearish body
- Bearish Harami Cross is considered more reliable than standard Bearish Harami
- Works on all timeframes: daily, hourly, and 4-hour charts
How to Interpret the Bearish Harami
The first candlestick is large and bullish, reflecting strong buying pressure and a continuation of the prevailing uptrend. This candle sets the stage with its substantial body, indicating that market sentiment is still optimistic. The second candlestick in the Bearish Harami is markedly smaller and bearish, fitting entirely within the body of the first candlestick.
This smaller bearish candlestick signals a shift in market sentiment. Despite the previous session’s strong bullish momentum, the formation of a smaller bearish candlestick confined within the prior candle’s range indicates a sudden slowdown in buying activity. The fact that this candlestick remains within the range of the first day’s large bullish candlestick suggests indecision among market participants. This hesitation is a crucial element: it shows buyers are losing their grip on the market and sellers are beginning to gain influence, even if they have not yet overwhelmed buyers entirely.
The Bearish Harami can occur on all timeframes, making it a versatile tool for day traders, swing traders, and position traders. On higher time frames, the pattern is generally more significant. The appearance of the Bearish Harami implies that the uptrend may be losing momentum and a reversal could be on the horizon. However, because it represents indecision rather than outright reversal, it requires confirmation more than the Bearish Engulfing or Evening Star patterns do.
Related: Bullish Candlestick Patterns: Strategies for Successful Trading
How Do the Six Patterns Compare?
| Pattern | Candles | Reliability | Key Feature | Confirmation Needed |
|---|---|---|---|---|
| Bearish Engulfing | 2 | High | Large bearish candle engulfs smaller bullish one | Volume on Day 2; Day 3 follow-through recommended |
| Evening Star | 3 | High | Three-stage reversal: bull, indecision, bear | Candle 3 closes below Candle 1 midpoint; volume on C3 |
| Dark Cloud Cover | 2 | Medium-High | Day 2 gaps up then closes below Day 1 midpoint | Deeper penetration below midpoint = stronger; volume |
| Shooting Star | 1 | Medium-High | Long upper shadow; small body at bottom of candle | High volume; at resistance; bearish follow-up candle |
| Hanging Man | 1 | Medium | Long lower shadow; small body at top of candle | Strong: requires bearish candle on Day 2 to confirm |
| Bearish Harami | 2 | Medium | Small bearish candle contained within prior bullish body | Requires strong follow-through; Harami Cross is stronger |
How Do You Trade Bearish Candlestick Patterns?
Combining Patterns with Other Technical Tools
Bearish candlestick patterns are most reliable as part of a multi-factor analysis. The most effective combinations are:
- RSI divergence: When price makes a higher high but RSI makes a lower high at the same time a bearish pattern forms, the divergence adds strong confirmation that buying momentum is genuinely weakening.
- MACD crossover: A MACD line crossing below the signal line in conjunction with a bearish candlestick pattern at resistance provides a momentum-based confirmation aligned with the pattern’s signal. See our guide on the MACD indicator.
- Volume confirmation: High volume during the bearish candle(s) formation confirms strong selling conviction. A Bearish Engulfing pattern on double the average volume is significantly more reliable than one on below-average volume.
- Fibonacci resistance: A bearish pattern forming at the 61.8% or 78.6% Fibonacci retracement of a prior decline creates a powerful confluence of pattern and level.
- Moving average resistance: A Shooting Star or Hanging Man forming exactly at the 200-day moving average creates a strong multi-method signal combining price action with dynamic resistance.
Stop-Loss and Risk Management
For short trades based on bearish candlestick patterns, the stop-loss is placed above the pattern’s high or above the key resistance level being tested. For a Shooting Star, the stop goes above the upper shadow’s high. For a Bearish Engulfing, the stop goes above Day 2’s high. The take-profit target is set at the next significant support level below the entry. This creates a defined risk-to-reward ratio for each trade. As always, position sizing should ensure that a stop-loss triggering represents no more than 1 to 2% of total portfolio value.
Time Frame Considerations
Bearish candlestick patterns on higher time frames are significantly more reliable than those on lower time frames. A Bearish Engulfing pattern on the weekly chart represents a major shift in market sentiment and carries much more weight than the same pattern on a 5-minute chart, where it is frequently produced by normal price noise. Confirm patterns on the daily or weekly chart before executing on the 4-hour or hourly for precise entry timing.
| Pattern | Stop-Loss Placement | Take-Profit Target |
|---|---|---|
| Bearish Engulfing | Above the high of Day 2 bearish candle | Next significant support level; 1.5:1 to 3:1 risk-to-reward |
| Evening Star | Above the high of Candle 2 (the small body) | Next support; measured as height of pattern projected down |
| Dark Cloud Cover | Above the high of Day 2 (the gap-open high) | Prior support level or 50% retracement of Day 1 range |
| Shooting Star | Above the upper shadow high | Next support; prior swing low; Fibonacci level below entry |
| Hanging Man | Above the Hanging Man’s body high (after Day 2 confirms) | Next support level; enter on Day 2 confirmation close |
| Bearish Harami | Above Day 1 high (requires strong follow-through first) | Next support; consider smaller position given lower reliability |
Read Also: MACD Indicator: A Comprehensive Guide
Frequently Asked Questions
What are the most common bearish candlestick patterns?
The most common bearish candlestick patterns are the Bearish Engulfing Pattern, the Evening Star, the Dark Cloud Cover, the Shooting Star, the Hanging Man, and the Bearish Harami. Each signals a potential shift from bullish to bearish market sentiment through a specific combination of candle bodies, wicks, and position within the prior trend. The Bearish Engulfing and Evening Star are generally considered the most reliable, particularly when confirmed by above-average trading volume.
How do bearish candlestick patterns indicate a market reversal?
Bearish candlestick patterns indicate a potential reversal by encoding shifts in the balance of power between buyers and sellers. When a bullish trend produces a Shooting Star (price surges but closes near the open) or a Bearish Engulfing (a large bearish candle overwhelms the prior bullish one), it shows that sellers entered the market with enough force to overwhelm buyers. The pattern identifies a price level where selling pressure was demonstrated. It does not guarantee a reversal but signals that the uptrend’s momentum has been challenged.
Can bearish candlestick patterns be used in conjunction with other indicators?
Yes, and this is strongly recommended. Bearish candlestick patterns are most reliable when confirmed by other technical indicators. RSI divergence at the same level as a bearish pattern adds significant confirmation. High trading volume during the pattern’s formation confirms strong selling conviction. MACD crossovers, Fibonacci resistance levels, and standard deviation channel upper boundaries that coincide with a bearish candlestick pattern create high-probability confluence setups that are more reliable than any single signal used in isolation.
How reliable are bearish candlestick patterns in crypto trading?
Bearish candlestick patterns are useful but not independently reliable. Crypto markets are more volatile than traditional markets, meaning patterns can be overridden by sudden news events, whale activity, or leverage cascades. Studies suggest bearish patterns perform better on higher time frames (daily and weekly) than on lower time frames where noise is greater. Use them as one input in a multi-factor analysis rather than as standalone trading signals, and always apply stop-losses to limit losses when patterns fail to follow through.
What is the difference between the Shooting Star and the Hanging Man?
Both are single-candlestick patterns with a small body and a long shadow, but they differ in shadow direction and formation context. The Shooting Star has a long upper shadow and a small body at the bottom, appearing after an uptrend: buyers pushed prices higher but sellers overwhelmed them before the close. The Hanging Man has a long lower shadow and a small body at the top, also appearing after an uptrend: sellers drove prices significantly lower during the session before buyers partially recovered. Both signal potential bearish reversals but through different intraday dynamics.


")


