Crypto seasonality refers to recurring patterns in price, volume, and volatility tied to specific calendar periods, halving cycles, or market structure events. The 2025 cycle delivered a landmark data point: Bitcoin hit an all-time high of $126,200 on October 6, 2025, then ended the year approximately 5% in the red, the first time it has closed a post-halving year with a loss, forcing a fundamental reassessment of the traditional four-year cycle thesis.
Key Takeaways
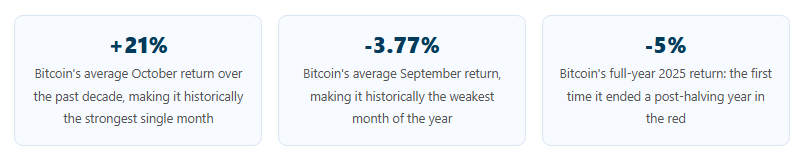
Bitcoin’s Q4 seasonality has historically been its strongest period. October has averaged approximately 21% returns over the past decade and November has surged up to 46% in bull cycles. This pattern held in Q4 2025, with Bitcoin hitting $126,200 on October 6.
Bitcoin ended 2025 approximately 5% below its opening price, the first post-halving year in its history to close with a loss. This unprecedented outcome is causing analysts to question whether the traditional four-year halving cycle is still a reliable framework.
Institutional adoption through ETFs, increasing Bitcoin-NASDAQ correlation (reaching 92% over a six-month period in 2025), and the reduced supply shock of each successive halving are the structural forces most analysts cite as having altered Bitcoin’s historical cycle dynamics.
Altcoin season, historically defined as the period when Bitcoin dominance declines and capital rotates into altcoins, remains a recurring market structure phenomenon. In 2025, the Altcoin Season Index reached 68% in late August before retreating.
September has been Bitcoin’s historically weakest month, averaging approximately -3.77% returns. The “sell in May and go away” pattern has some historical validity, with summer months often producing lower or negative returns.
Seasonality analysis is a useful framework but must be combined with risk management, current macro analysis, and flexibility to adapt when unexpected events override historical patterns.
What Is Cryptocurrency Market Seasonality?
Have you ever noticed how the cryptocurrency market seems to move in cycles? Just like traditional financial markets, digital currencies often experience seasonal patterns that can influence prices, trading volume, and volatility. Understanding these patterns can give traders and investors a strategic edge by helping them anticipate market movements and optimise their portfolio positioning.
Cryptocurrency seasonality refers to recurring trends in market behaviour that occur at specific times of the year, within the multi-year halving cycle, or in relation to external economic calendar events. These patterns emerge from a combination of investor psychology, structural supply and demand dynamics (like Bitcoin halvings), regulatory calendars, and the influence of broader macroeconomic cycles on risk assets. No pattern is perfectly reliable, but understanding historical tendencies helps traders approach the market with a more structured framework rather than reacting to price movements in isolation.
What Are the Key Historical Seasonality Periods?
Early Market Trends (2009 to 2013)
Bitcoin was introduced in 2009 as the first cryptocurrency. During its early years from 2009 to 2013, the market was tiny, illiquid, and driven primarily by early adopters and enthusiasts with minimal institutional participation. Price movements were dominated by isolated events such as early media coverage, niche regulatory news, and individual hacks rather than any consistent seasonal pattern. The lack of liquidity meant that small events produced outsized price moves. Despite this, early signs of year-end price increases were observable, though the small market size and novelty of the asset meant patterns were still forming and entirely unpredictable.
Development of Altcoin Seasonality (2014 to 2017)
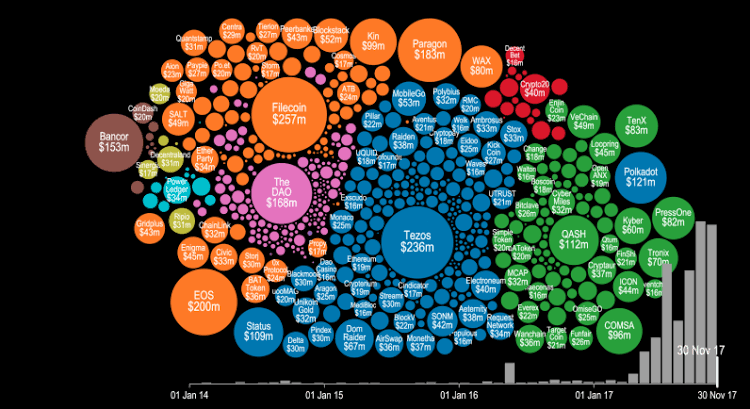
Between 2014 and 2017, altcoins emerged alongside Bitcoin and began to exhibit their own distinct seasonal patterns. Ethereum, which launched in 2015, showed a tendency to rally ahead of major network upgrades or protocol changes. The ICO (Initial Coin Offering) boom of 2017 introduced what became known as “altcoin season”: a period where capital flows out of Bitcoin and into smaller cryptocurrencies, producing extraordinary returns across the altcoin space. In spring and summer 2017, capital rushed into Ethereum-based tokens, with Ethereum rising from approximately $8 in January to over $1,300 by early 2018, making this the clearest and most dramatic seasonal pattern in crypto history up to that point.
Market Maturity and Changing Patterns (2018 to 2025)
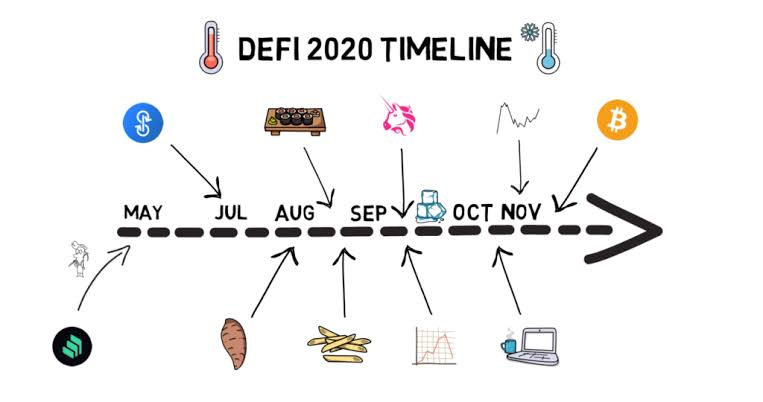
Since 2018, the cryptocurrency market has become significantly more sophisticated, with institutional investors, regulatory frameworks, and macro correlation all reshaping how seasonal patterns manifest. The broad Bitcoin and altcoin seasons remain recognisable, but they are less extreme and more influenced by macro forces. The COVID-19 pandemic in 2020 disrupted typical seasonal patterns, producing the “DeFi Summer” of 2020 that was driven by liquidity injections and crypto-native innovation rather than traditional calendar effects. The 2024 to 2025 cycle introduced the most significant deviation from historical patterns: Bitcoin’s traditional four-year cycle may be evolving as institutional capital fundamentally changes its market dynamics.
Join UEEx
Experience the World’s Leading Digital Wealth Management Platform
Bitcoin’s historical monthly performance reveals several consistent tendencies that inform seasonality-based strategies. Based on data across multiple market cycles:
October: Historically Bitcoin’s strongest single month, averaging approximately 21% returns over the past decade. Nicknamed “Uptober” in the crypto community, October has been positive in most years and has produced some of the largest single-month gains in Bitcoin’s history.
November: The second strongest month, with surges of up to 46% observed in bull cycle years. November 2020 saw Bitcoin break through $20,000 for the first time, and November 2024 saw it break $99,637 driven by ETF inflows and post-election optimism.
December: Mixed performance depending on the cycle phase. In bull markets, December extends the Q4 rally. In post-peak years, December marks the beginning of corrections as investors take profits.
January: Often weak following year-end rallies as profit-taking continues and the market digests gains from the prior quarter. Called the “January effect” reversal in crypto circles.
September: Historically Bitcoin’s weakest month, averaging approximately -3.77% returns. Often called “Septembear” by traders expecting the annual dip.
Summer months (June to August): Reduced trading volumes as institutional participants are less active. Lower volatility during these months can produce sideways price action or mild corrections, though 2025’s Altcoin Season Index reaching 68% in late August shows this pattern can break down.
Quarterly Patterns
At the quarterly level, Q4 (October through December) has historically been Bitcoin’s strongest quarter by average returns, while Q1 (January through March) has been more variable depending on where the broader cycle stands. Q2 and Q3 have typically been quieter periods between the major seasonal catalysts. In 2025, this quarterly framework held in broad strokes: Q1 saw Bitcoin above $100,000 driven by Trump’s pro-crypto executive orders and the Strategic Bitcoin Reserve announcement, Q2 saw the April correction to approximately $74,000, and Q3 produced recovery before the October all-time high.
What Are Ethereum’s and Altcoins’ Seasonal Patterns?
Ethereum
Unlike Bitcoin, which is primarily viewed as a store of value with price movements tied closely to its supply schedule and macro sentiment, Ethereum’s price is more closely linked to the activity within its ecosystem. A key seasonal pattern for Ethereum has been the tendency to rally in anticipation of major network upgrades. The transition to Proof of Stake (The Merge, September 2022) and the Shapella upgrade (April 2023) both saw price appreciation in the months leading up to the events. The Pectra upgrade in 2025 to 2026, which reduced Layer-2 fees approximately 40%, similarly attracted attention and capital. Ethereum also tends to follow Bitcoin’s movements but with higher volatility, particularly during periods of strong DeFi or NFT activity that drives Ethereum-specific demand independent of broader market trends.
Altcoins and Altcoin Season
Altcoins exhibit the most variable seasonal patterns. The phenomenon known as “altcoin season” occurs when Bitcoin’s dominance index declines and capital rotates into smaller cryptocurrencies seeking higher returns. Bitcoin dominance typically falls below 55 to 60% at the height of altcoin seasons, with the Altcoin Season Index (which measures what percentage of the top 50 altcoins have outperformed Bitcoin over 90 days) reaching 75 or above to confirm the season’s peak. In 2025, the Altcoin Season Index reached 68% in late August before retreating, suggesting a partial altcoin season rather than a full rotation. Historically, 75% of the top 50 altcoins outperform Bitcoin during genuine altcoin season phases.
Stablecoins
Stablecoins like USDC and USDT are designed to maintain a stable value relative to the US dollar, so they do not exhibit price-based seasonal patterns. However, their usage does show seasonal behaviour. During periods of high market volatility or bearish sentiment, investors often move funds into stablecoins to preserve value while staying within the crypto ecosystem. The stablecoin market surpassed $305 billion in 2025, and stablecoin volumes spiked during the late-2025 correction period as investors rotated out of Bitcoin and Ethereum into dollar-pegged assets rather than exiting crypto entirely. This flight to stablecoins is itself a seasonality signal: unusually high stablecoin inflows often precede or coincide with market corrections.
Is Bitcoin’s Four-Year Cycle Still Reliable in 2025 and 2026?
The 2025 data delivered the most significant challenge to seasonal analysis in Bitcoin’s history. The traditional framework, which had held across every prior cycle, predicted a strong bull market throughout 2025 following the April 2024 halving. Instead:
Bitcoin reached a new all-time high of $126,200 on October 6, 2025 (consistent with the Q4 seasonal pattern and halving cycle timing)
Bitcoin then corrected approximately 36% to around $80,500 by November 2025
Bitcoin ended the year 2025 approximately 5% below its January 1, 2025 opening price
This was the first time in Bitcoin’s history that it ended the year following a halving with a loss
“THE 4-YEAR BITCOIN CYCLE IS NOW OFFICIALLY DEAD: 2025 was down 5% in a post-halving year. Every prior post-halving year in Bitcoin’s history had been strongly positive. The market structure has fundamentally changed.”
What Has Changed About the Cycle?
Three structural forces are most frequently cited as having altered Bitcoin’s traditional cycle dynamics:
Institutional dominance: Unlike prior cycles driven by retail hype and speculation, the 2024 to 2025 cycle was dominated by institutional capital through ETFs, corporate treasury programmes, and regulated products. Institutional investors trade on longer time horizons and fundamentals, dampening both the upside parabola and the severity of corrections. Bitcoin’s post-halving gain of approximately 100% to the October 2025 ATH was the smallest post-halving rally in its history, down from 230% in the 2020 cycle and 315% in the 2016 cycle.
Diminishing supply shock: With approximately 94% of all Bitcoin already mined, each successive halving produces a smaller relative supply shock. The 2024 halving reduced daily new supply from approximately 900 BTC to 450 BTC, a much smaller change in supply-demand dynamics than early halvings when Bitcoin was significantly earlier in its issuance schedule.
Macro correlation: Bitcoin’s correlation with the NASDAQ reached 92% over a six-month period in 2025, confirming its transition to a macro-correlated risk asset. Federal Reserve policy, global liquidity conditions, and geopolitical events now influence Bitcoin’s price as powerfully as crypto-specific factors, making the historically crypto-native four-year cycle less determinative on its own.
What this means for traders: The four-year cycle is not useless as a framework, but it should be treated as a loose guide rather than a precise roadmap. Bitcoin still shows halving-linked supply dynamics and Q4 seasonal strength tendencies. But the magnitude and timing of these effects are becoming less predictable as the market matures. Pairing cycle awareness with macro analysis, on-chain metrics, and current market structure is more important than ever.
Global economic cycles have a significant impact on cryptocurrency markets. When the global economy is expanding and risk appetite is high, capital flows into crypto alongside other risk assets. When central banks tighten monetary policy, reducing liquidity, crypto typically underperforms. This relationship became highly visible in 2022 when the Federal Reserve’s aggressive rate hiking cycle caused Bitcoin to fall from approximately $68,000 to $15,500, tracking the equity market’s decline almost precisely. In 2023 to 2025, as global M2 money supply expanded and liquidity recovered, Bitcoin’s price appreciated in parallel. Quantitative tightening ended in December 2025, and market participants are monitoring how the subsequent shift in monetary policy affects Bitcoin’s trajectory through 2026.
Regulatory Changes
Regulatory events remain among the most powerful external forces shaping crypto market seasonality. Regulatory clarity attracts capital; uncertainty repels it. The 2025 regulatory environment delivered historically strong positive catalysts: the GENIUS Act established the first US federal stablecoin framework, the SEC withdrew major enforcement actions, Paul Atkins took over as SEC Chair with a pro-crypto agenda, and MiCA came into full force across the EU. These events contributed to the January to March 2025 price strength. Conversely, China’s 2021 mining ban and the 2022 FTX collapse demonstrate how regulatory and market structure shocks can override typical seasonal patterns entirely.
Technological Developments
Planned technological upgrades create predictable seasonal catalysts. The Bitcoin halving event (occurring every approximately four years at block 210,000 intervals) is the most powerful structural seasonal force in the market. Ethereum upgrades like Pectra (2025 to 2026) and prior milestones like The Merge (2022) created anticipatory price movements in the months before their implementation. New product launches, including spot ETF approvals, can also introduce powerful one-time seasonal shifts. The January 2024 US spot Bitcoin ETF approval was the most significant such event, generating months of sustained institutional buying that pushed Bitcoin to successive new all-time highs through the following 18 months.
Market Sentiment and Media Influence
Market sentiment is one of the most powerful short-term forces in crypto, capable of overriding or amplifying any seasonal tendency. The Crypto Fear and Greed Index captures this sentiment quantitatively: when it shows extreme greed, markets are often near a peak; extreme fear often coincides with bottom-building phases. Social media platforms including X (formerly Twitter), Reddit, and YouTube amplify sentiment cycles, with viral narratives producing buy-or-sell frenzies that seasonal analysis alone cannot predict. The DeFi Summer of 2020 is the clearest example of a media and community-driven seasonal event that created a new pattern rather than conforming to an existing one.
Join UEEx
Experience the World’s Leading Digital Wealth Management Platform
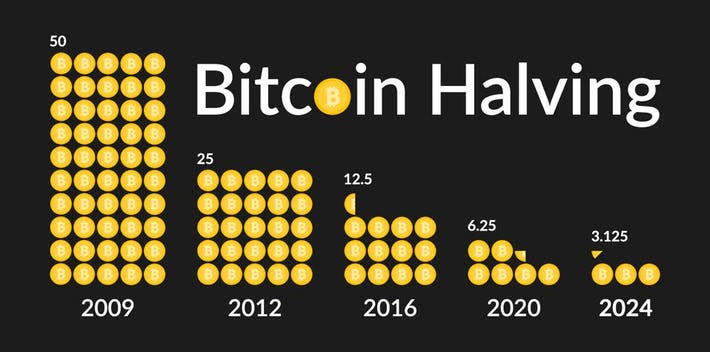
Bitcoin’s fourth halving on April 20, 2024 reduced the block reward from 6.25 BTC to 3.125 BTC. The halving was preceded by a new all-time high of approximately $73,000 in March 2024, driven by spot ETF approval inflows, the first time Bitcoin had broken a prior cycle ATH before rather than after a halving. Following the halving, Bitcoin traded sideways through summer 2024 before surging to $99,637 in November 2024 and ultimately to $126,200 on October 6, 2025. From the April 2024 halving to the October 2025 ATH, Bitcoin rallied approximately 100%, the smallest post-halving gain in its history compared to 230% in the prior cycle and 315% the cycle before that. The post-ATH correction and the unprecedented negative 2025 annual return confirm that halving dynamics are still present but materially moderated by institutional capital and reduced supply shock.
Lesson: Halvings still create supply-driven tailwinds, but the magnitude of their market impact is diminishing with each successive event as Bitcoin approaches full issuance.
Case Study 2: Altcoin Season
The 2017 ICO Boom and 2021 DeFi/NFT Season
The 2017 ICO boom remains the textbook altcoin season: capital flooded into Ethereum-based tokens from spring through fall 2017, with Ethereum rising from approximately $8 in January to over $1,300 by early 2018. The 2021 NFT and DeFi season, while less concentrated, followed a similar pattern: after Bitcoin’s January 2021 ATH, capital rotated aggressively into altcoins through March to May 2021, with many altcoins delivering 1,000%+ returns. Both seasons were followed by severe corrections. In 2025, the altcoin season was more muted: the Altcoin Season Index reached 68% in late August but did not produce the explosive rotation of prior cycles, likely because the market’s risk capital was more evenly distributed across a broader range of sectors including real-world assets and AI tokens rather than concentrated in a single altcoin wave.
Lesson: Altcoin seasons still occur when Bitcoin dominance falls and liquidity is abundant, but they are becoming more sector-specific rather than uniform waves lifting all altcoins simultaneously.
Case Study 3: DeFi Summer
Summer 2020: When Seasonal Patterns Are Created Rather Than Followed
The DeFi Summer of 2020 (June to September) is the clearest example of a new seasonal pattern being created by innovation rather than following historical precedent. From June to September 2020, total value locked in DeFi protocols grew from approximately $1 billion to over $10 billion. Ethereum’s price rose from approximately $230 in June to over $480 by end of September. This period was driven by the introduction of yield farming and liquidity mining incentives, particularly Compound’s COMP governance token distribution, which triggered a cascade of DeFi protocol launches and capital inflows. The summer of 2020 created the “DeFi Summer” seasonal template that traders now look for in subsequent cycles.
Lesson: The most powerful seasonal events in crypto are often created by new technology categories rather than by repeating prior patterns. Monitoring for new category launches alongside established seasonal patterns is essential.
Case Study 4: 2025 Cycle
Bitcoin’s First Negative Post-Halving Year
Bitcoin’s 2025 full-year return of approximately -5% is the most significant seasonal anomaly in its history. Having previously delivered positive returns every single year following a halving (2013, 2017, and 2021 all produced extraordinary gains), the 2025 deviation prompted widespread reappraisal of the four-year cycle thesis. The October ATH of $126,200 confirmed Q4 seasonal strength and halving cycle timing were still present. But the subsequent correction through year-end, with Bitcoin trading approximately 30 to 46% below the ATH by year-end, produced the negative annual return. Analysts attributing this to the growing institutional influence that produced steadier prices, a reduced supply shock, and macro correlation with weakening risk assets in Q4 2025 all agree on one conclusion: seasonality remains useful context but cannot be applied mechanically.
Lesson: The 2025 negative annual return is the most important data point in crypto seasonality history. It confirms that historical patterns, even those as well-documented as the post-halving bull year, can break down as market structure evolves.
What Trading Strategies Work Best for Seasonality?
Seasonal Accumulation and Exit Strategies
The most common seasonality-informed strategy is to accumulate Bitcoin during historically weak periods and reduce exposure during historically strong periods. For Bitcoin, this has traditionally meant accumulating during the summer months (particularly the September lull that averages -3.77% returns) and during the early post-ATH correction phase, targeting Q4 for peak exposure. This approach does not require perfectly timing market tops and bottoms. A dollar-cost averaging strategy concentrated around the historically weak September window, for example, consistently produced better average entry prices over multiple cycles than lump-sum buying at year-end highs.
Monitoring Bitcoin Dominance for Altcoin Season
Tracking the Bitcoin dominance index (the percentage of total crypto market cap held by Bitcoin) helps identify the transition from Bitcoin-led markets to altcoin season. When Bitcoin dominance falls below 55 to 60%, capital is typically rotating into altcoins. The Altcoin Season Index, which measures what fraction of the top 50 altcoins have outperformed Bitcoin over 90 days, provides a more direct read. A reading above 75 historically signals a well-established altcoin season where a diversified altcoin portfolio outperforms a Bitcoin-only position. Monitoring these indicators in combination with the halving cycle position helps identify when altcoin overweighting is most likely to be rewarded.
Risk Management in Seasonal Trading
Risk management is critical when trading seasonal patterns because even historically reliable patterns can fail. Setting stop-loss orders protects against the scenario where a historically strong period fails to materialise due to unexpected macro or regulatory events. Position sizing ensures that if a seasonal trade goes wrong, the loss is contained. Diversification across assets with different seasonal cycles (Bitcoin in Q4, altcoins during altcoin season, stablecoins as a reserve during weak periods) reduces the risk that a single seasonal trade failure dominates overall portfolio performance. The 2025 post-ATH correction demonstrated precisely why holding cash or stablecoin reserves through historically weak periods after major seasonal peaks is valuable.
Using Technical Analysis to Confirm Seasonal Entries
Technical indicators provide timing confirmation within seasonal windows. The MACD crossover can signal momentum shifts that align with seasonal entry points. The Relative Strength Index (RSI) helps identify when seasonal weakness has produced genuinely oversold conditions, improving entry timing within the typical September or summer accumulation window. Multi-time frame analysis ensures that a seasonal entry signal on a daily chart is aligned with the broader weekly and monthly trend before committing capital.
Month
Historical Bitcoin Tendency
Seasonality-Informed Trading Note
January
Variable; often weak post Q4 rally
Profit-taking from prior Q4 gains; assess macro backdrop before deploying fresh capital
February to March
Often stronger in pre-halving or early bull years
Watch for resumption of trend following January consolidation; halving anticipation begins building
May to July
Reduced volumes; often sideways or mild correction
“Sell in May” pattern has some historical validity; lower activity supports gradual DCA accumulation
Historically the best accumulation window for anticipating Q4 strength; “Septembear” often provides attractive entry
October
Historically strongest month (+21% avg)
“Uptober” pattern; be positioned before start of month; watch for momentum confirmation
November
Second strongest month; up to +46% in bull cycles
Q4 peak acceleration phase; monitor RSI and on-chain signals for overextension; consider partial profit-taking
December
Mixed; year-end selling pressure or continuation
Tax-loss harvesting creates selling pressure; assess whether cycle is in peak or correction phase before December positioning
What Are the Limitations of Seasonality Analysis?
Statistical Limitations of Short History
Bitcoin has less than 16 years of price history, and meaningful institutionally influenced price data spans only about four years since the spot ETF approvals in January 2024. Identifying a “seasonal pattern” with high statistical confidence requires decades of consistent data, something no cryptocurrency yet has. Many apparent patterns are based on three to five data points, which is statistically insufficient to establish reliable predictability. Traders should treat seasonality as probabilistic context, not as guaranteed outcomes.
The Problem with Evolving Market Structure
The 2025 negative annual return is the clearest evidence that market structure evolution can override historical patterns. As institutional capital, macro correlation, and regulatory environment all shift, the seasonal patterns observed when Bitcoin was a retail-dominated, regulation-free asset may not apply with the same reliability to the asset it is becoming. Adapting seasonality frameworks to reflect current market structure, rather than applying historical patterns mechanically, is essential.
Black Swan Events
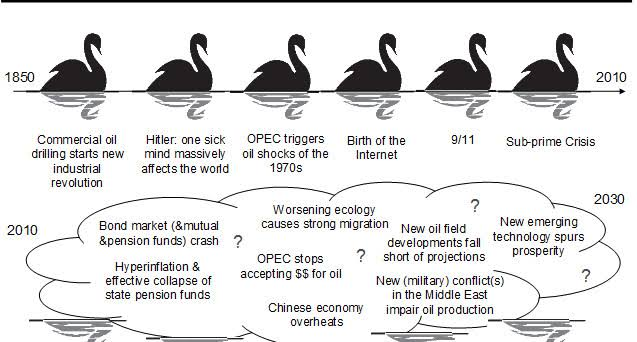
Unforeseen events with massive market impact can override any seasonal pattern. The COVID-19 pandemic, the FTX collapse, major regulatory crackdowns, and geopolitical shocks have all produced market movements that defied seasonal expectations in both directions. The February 2025 Bybit hack ($1.46 billion stolen), while not a systemic event, demonstrates the constant presence of tail risks that seasonality frameworks cannot anticipate.
Cryptocurrency seasonality patterns are recurring trends that occur at specific times of year, within the four-year halving cycle, or in relation to external economic calendar events. October averages approximately 21% Bitcoin returns historically, while September averages -3.77%. However, 2025 delivered the most significant challenge to these patterns: Bitcoin ended the year down approximately 5% despite hitting a new ATH of $126,200 in October, the first time it closed a post-halving year in the red. Seasonality remains a useful framework but cannot be applied mechanically.
Are cryptocurrency seasonality patterns consistent across all digital assets?
No. Seasonality patterns vary significantly between digital assets. Bitcoin’s patterns are most closely tied to its halving cycle and Q4 tendencies. Ethereum’s price movements are more tied to major network upgrades and ecosystem activity. Altcoins follow Bitcoin’s lead during broad rallies but develop independent patterns around project-specific events. Stablecoins show seasonal patterns in usage volume rather than price. Each asset requires separate seasonal analysis rather than assuming Bitcoin’s patterns apply universally.
Is Bitcoin’s four-year halving cycle still reliable in 2025 and 2026?
The 2025 data has materially complicated the four-year cycle thesis. Bitcoin reached $126,200 on October 6, 2025 (consistent with cycle timing), then ended the year approximately 5% below its opening price, the first time it has closed a post-halving year with a loss. Growing institutional influence, reduced supply shock (approximately 94% of all Bitcoin is already mined), and Bitcoin’s increasing correlation with macro risk assets (NASDAQ correlation reaching 92% in 2025) are the structural forces most cited as having altered the cycle’s predictability and magnitude.
What trading strategies work best for crypto seasonality?
The most effective strategies include: accumulating Bitcoin during historically weak periods such as September and the summer months in anticipation of Q4 strength; monitoring Bitcoin dominance to identify the altcoin season transition when dominance falls below 55 to 60%; dollar-cost averaging aligned with the halving cycle to build positions without trying to perfectly time turns; and using technical indicators like RSI and MACD to confirm seasonal entry and exit signals before committing capital. Always pair any seasonality strategy with strict risk management including stop-losses and position sizing.
What is the impact of holidays on cryptocurrency markets?
Major holidays affect crypto trading volume and volatility similarly to traditional markets. During Christmas and New Year’s, institutional desks reduce activity, and lower liquidity can exaggerate price moves in either direction. Year-end tax-loss harvesting creates selling pressure in December. The holiday season has historically also brought increased retail participation as individuals have more time to engage with financial markets, contributing to Q4 seasonal strength in prior cycles. In 2025, December selling pressure contributed to Bitcoin ending the year below its January opening, demonstrating how holiday-period dynamics can cut both ways.
Oluwadamilola Olaniyan is a certified content writer. As a content writer and marketer, she is passionate about creating content that engages and inspires audiences. She is also skilled in turning complex ideas into impactful and easy to read content.
Disclaimer: This article is intended solely for informational purposes and should not be considered trading or investment advice. Nothing herein should be construed as financial, legal, or tax advice. Trading or investing in cryptocurrencies carries a considerable risk of financial loss. Always conduct due diligence before making any trading or investment decisions.
Trade with proof of Reserves
UEEx publish monthly audits and third party verification on every listed market.