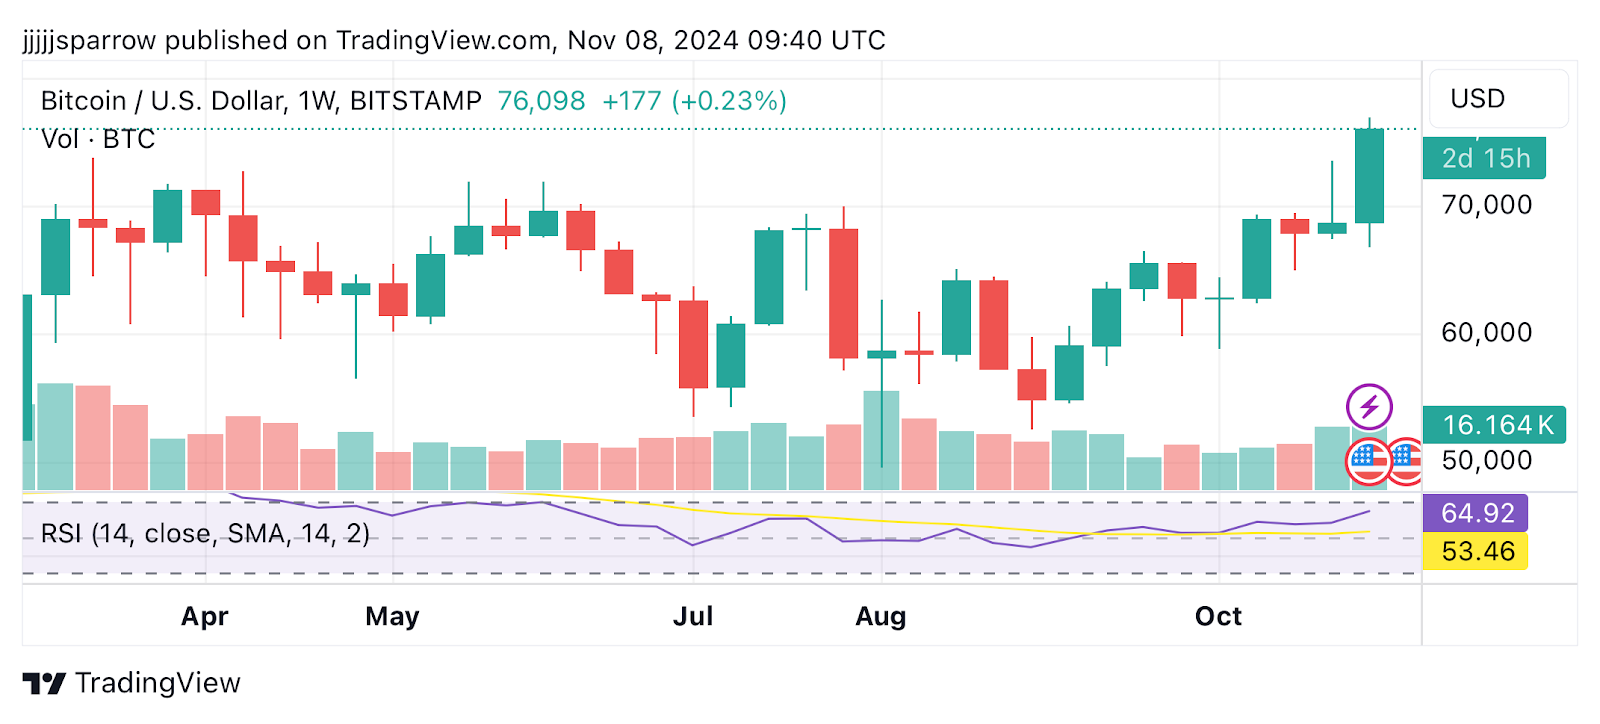
You watch Bitcoin push to a new high. Everything looks bullish.
Then you look at the volume, and it’s been quietly falling for three sessions straight. Price is climbing, but the market is thinning out beneath it.
That gap between what price is doing and what volume is telling you is called volume and price divergence — and it is one of the most honest signals in technical analysis.
Most retail traders read the candle. Smart money reads the participation behind it. This guide breaks down how volume and price divergence works, the four types every serious trader needs to recognise, and how to use it practically in crypto markets.
Volume and price divergence
Volume and price divergence occurs when an asset’s price movement and its trading volume move in opposite directions, a signal that the current trend may be losing conviction.
There are four types: regular bullish, regular bearish, hidden bullish, and hidden bearish. Regular divergence signals potential reversals; hidden divergence signals trend continuation.
Volume divergence has an estimated accuracy rate of 60–70% and should always be confirmed with a second indicator before acting.
Join UEEx
Experience the World’s Leading Digital Wealth Management Platform
The volume and price divergence indicator is designed to assess the relationship between volume and price movements in financial markets, helping traders identify divergences that may signal a shift in market trends.
Key Components
Below is an overview of how volume and price divergence works:
1. Volume Calculation:
Buying Volume: This is determined by calculating the relationship between the closing price and the high/low range. If the closing price is closer to the low, more volume is attributed to buying.
Selling Volume: If the closing price is closer to the high, the volume is considered selling.
The indicator plots total volume in red and buying volume in green, allowing traders to visually differentiate the volume dynamics during price changes.
3. Rate of Change (ROC):
ROC measures the percentage change between the current price and the price from a specific number of periods in the past. The ROC for both volume and price is calculated over a set period, showing how they evolve relative to each other.
ROC = source / source[length]
ROC2 = source2 / source2[length2]
4. Volume/Price Divergence (VPD):
The VPD is the ratio of the ROC of volume to the ROC of price.
Key insights include:
High VPD (above 10): Indicates a strong divergence, suggesting price changes are not supported by volume.
VPD around 1: Implies that volume and price are moving in sync .
5. Guidance Lines:
Horizontal lines at levels 10 (indicating high divergence) and 1 (indicating alignment) are included to assist in assessing market conditions.
Join UEEx
Experience the World’s Leading Digital Wealth Management Platform
There are two primary types of volume and price divergence: bullish divergence and bearish divergence. Each offers insights into potential shifts in market sentiment and trend direction.
Bullish Divergence
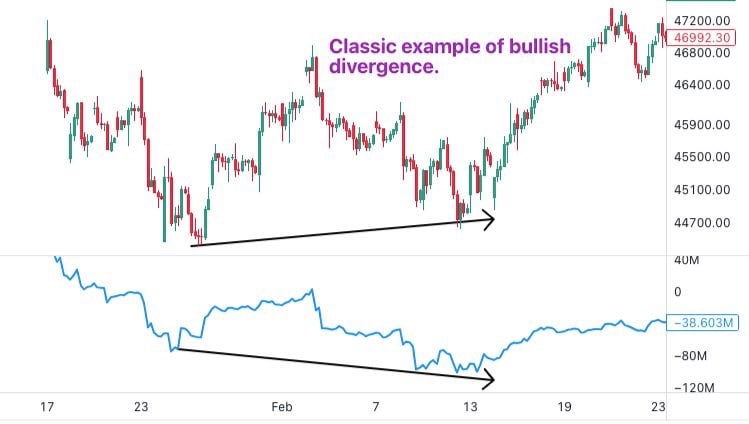
A bullish divergence happens when the price of an asset makes lower lows ( the lowest point drops below the prior low, indicating a downward trend), but volume or another momentum indicator, like the Relative Strength Index (RSI), makes higher lows (when the price reaches a trough that is above the previous low, suggesting a strengthening upward momentum).
This often suggests that buying pressure is increasing, despite the price decline. Bullish divergences can signal a potential reversal to the upside.
For example, in a downtrend, an asset’s price makes consecutive lower lows, but the volume or RSI starts trending upward.
This pattern may hint that the selling momentum is losing strength, and buyers could soon step in, pushing the price higher.
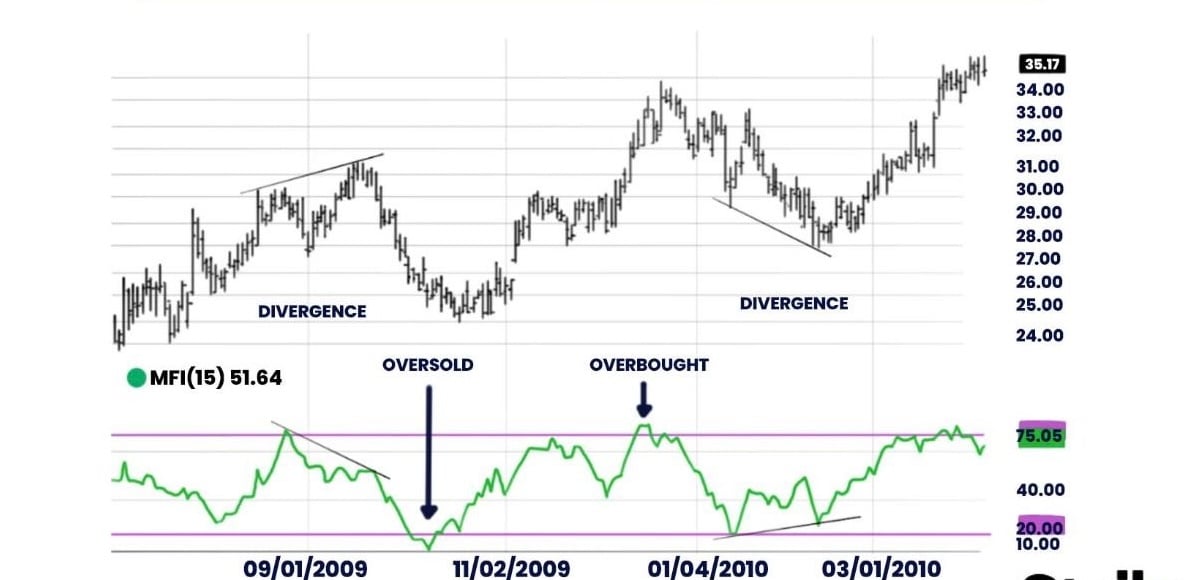
A bearish divergence occurs when an asset’s price makes higher highs (when the highest point reached by an asset’s price surpasses the previous peak), but volume or momentum indicators make lower highs (when the price peaks at a level lower than the previous high).
This divergence indicates waning buying interest, even as the price rises, potentially warning traders of an impending downtrend.
For example, in an uptrend, an asset’s price continues to make new highs, but the trading volume or RSI is decreasing.
This pattern could suggest that buyers are losing momentum, increasing the likelihood of a price pullback or reversal.
Hidden Bullish Divergence
Hidden bullish divergence occurs during a pullback within an overall uptrend. Price makes a higher low, pulling back less deeply than before, but volume makes a lower low.
This signals that selling pressure during the pullback is weak, and the prevailing uptrend is likely to resume.
Hidden bullish divergence is a trend-continuation signal, not a reversal signal. Traders use it to find low-risk re-entry points during healthy retracements in a bullish market.
Hidden Bearish Divergence
Hidden bearish divergence occurs during a pullback within a downtrend.
Price makes a lower high, recovering less than before, but volume makes a higher high.
This signals that buying pressure during the recovery is not strong enough to challenge the downtrend, and the prevailing bearish move is likely to continue.
Like its bullish counterpart, hidden bearish divergence is a continuation signal used by traders to enter or add to short positions during bear market rallies that lack conviction.
Regular vs Hidden Divergence — At a Glance
Type
Price Pattern
Volume Pattern
Signal
Regular Bullish
Lower lows
Higher lows
Potential reversal upward
Regular Bearish
Higher highs
Lower highs
Potential reversal downward
Hidden Bullish
Higher lows (in uptrend)
Lower lows
Trend continuation — uptrend resumes
Hidden Bearish
Lower highs (in downtrend)
Higher highs
Trend continuation — downtrend resumes
How to Trade Volume and Price Divergence
Volume and price divergence is not a standalone entry trigger; it is a confluence signal. It tells you that the balance of participation is shifting; other tools tell you where and when to act on that shift.
Step 1: Identify the Divergence Type
Determine whether you are looking at regular divergence (potential reversal) or hidden divergence (trend continuation). Confusing the two leads to trades in the wrong direction.
Step 2: Check the Timeframe
Divergence on daily or weekly charts carries more weight than on intraday charts. If a 4-hour divergence aligns with a daily divergence, the signal is significantly stronger.
Step 3: Confirm at a Structural Level
A divergence signal near a known support or resistance level is more reliable than one occurring in open price space. Look for confluence between the divergence and your key levels.
Step 4: Confirm with a Second Indicator
RSI or MACD: If divergence appears alongside an overbought RSI reading (above 70) in a bearish setup, the combined signal is meaningfully stronger than either alone.
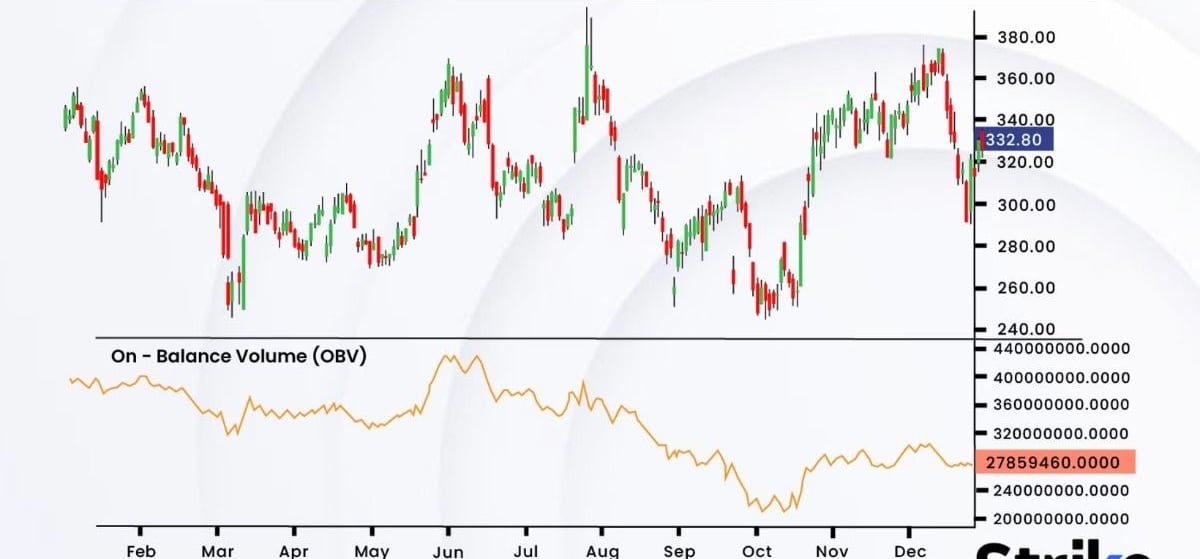
OBV: If On-Balance Volume confirms the divergence direction, it adds a second independent volume reading.
Candlestick confirmation: A rejection wick, engulfing candle, or break of structure in the expected direction provides the entry trigger.
Step 5: Define Entry, Stop, and Target Before Entry
Bullish setup: Enter long near the price trough, stop below the recent low, target the next structural resistance.
Bearish setup: Enter short near the price peak, stop above the recent high, target the next structural support.
Step 6: Manage the Trade, Not Just the Entry
Volume divergence signals fading momentum, but fading momentum does not mean an immediate reversal.
Price can continue for several sessions after a divergence signal appears. Use trailing stops rather than fixed exits so you capture the full move without sitting through a false start.
Join UEEx
Experience the World’s Leading Digital Wealth Management Platform
Why Volume Divergence Matters in Crypto: The Institutional View
Large players — institutions, funds, and whale wallets — rarely telegraph their moves through price alone.
When they accumulate, they buy in ways that suppress obvious price signals. When they distribute, they sell into rallies rather than pushing price down directly.
What they cannot hide is their volume footprint. Volume and price divergence is, at its core, a way to read institutional behavior before price confirms it.
A rally with declining volume tells you that fewer participants are driving the move, often because large holders are quietly selling into the demand.
A decline with rising volume tells you that buyers are absorbing the selling pressure at scale — often the beginning of institutional accumulation.
This framing connects directly to Wyckoff distribution and accumulation theory, one of the foundational models of institutional volume behavior.
Gann, Wyckoff, and modern volume analysts agree: price can be manipulated in the short term, but participation cannot be faked. Read the volume.
How Reliable is Volume and Price Divergence?
Volume and price divergence is not a certainty, it is a probability tool. The signal has an estimated accuracy rate of 60–70% when used in appropriate market conditions.
That is meaningfully above chance, but it also means roughly 30–40% of divergence signals do not lead to the expected outcome.
The reliability varies by context:
Daily and weekly timeframes produce more reliable signals than hourly or 15-minute charts. The longer the timeframe, the more participants the divergence reflects.
Divergence at key structural levels — established support, resistance, or Fibonacci zones — is more reliable than divergence in open price space.
Confirmed divergence (price action, candlestick pattern, or second indicator agreeing) is significantly more actionable than divergence in isolation.
This is why experienced traders treat divergence as a first alert, not a trigger. It tells you to pay attention; other tools tell you when to act.
How to Use Trading Volume to Enhance Your Trading Strategy
Trading volume can play a key role in formulating an effective trading strategy. Here’s how you can leverage trade volume data to improve your strategy and potentially boost trading outcomes:
Trading volume can help confirm both the direction and strength of a current price movement. An increase in volume during a price rise or a decrease during a short pullback indicates a strong uptrend.
Similarly, if volume rises during a price decline and falls during temporary rallies, it signals that the downtrend is likely to persist.
While high trading volume typically confirms a strong trend, unusually high volume especially when it occurs suddenly, can signal a potential trend reversal.
For instance, if an asset is in a downtrend but experiences a spike in volume paired with a small price rally, this may indicate that buyers are entering the market and driving the price upward.
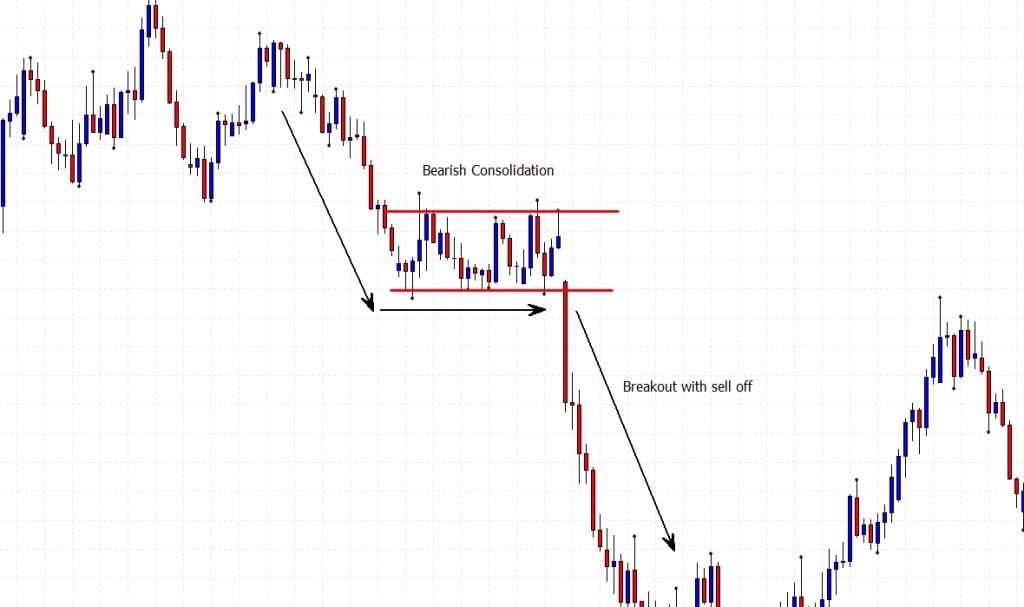
Trading volume is crucial when developing strategies around price breakouts or breakdowns.
A breakout happens when the price breaks above a resistance level and moves upward, while a breakdown occurs when the price falls below a support level and moves downward.
If a breakout or breakdown is accompanied by a surge in volume, it typically signals that the new trend, whether bullish or bearish, has momentum and could be sustained.
Combine with Volume Averages and Volume Indicators
These averages smooth out daily volume fluctuations, providing a clearer view of the volume trend.
Additionally, incorporating volume indicators such as the Volume Price Trend (VPT), On-Balance Volume (OBV), or Accumulation/Distribution Line (ADL) can further enhance your trading strategy by providing deeper insights into the market dynamics.
“Chart patterns are very accurate. They have proven their accuracy and predictability time and time again, but you have to wait for them to develop.” —- Fred McAllen, Charting and Technical Analysis
How to Use Volume Divergence to Improve Your Trading Strategy
Analyzing volume divergence can play a pivotal role in refining your trading strategy and boosting trade outcomes. Here are several strategies to leverage volume divergence for better trading performance:
Spotting Volume Divergences
Start by identifying discrepancies between price trends and volume movements.
If prices are rising but volume is declining, adjust your strategy for a potential bearish volume divergence, which may signal an impending trend reversal.
In such cases, reducing buy positions or considering sales can be beneficial.
On the other hand, if prices are falling but volume is increasing, indicating bullish volume divergence, prepare for a possible upward reversal as buying pressure is building.
Combine Volume Divergence with Price Action
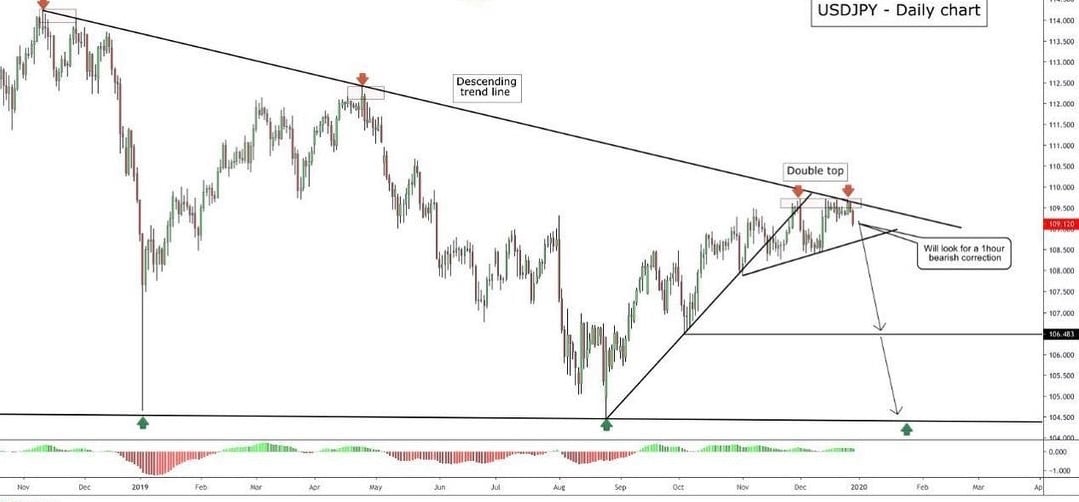
Enhance your trading strategy by integrating volume divergence with price action analysis. Look for chart patterns such as head and shoulders, double tops, or double bottoms.
For instance, a double top accompanied by diminishing volume on the second peak could confirm a bearish volume divergence and suggest a high probability of a trend reversal.
Use Technical Indicators
Incorporate technical indicators like moving averages, RSI, or MACD to complement your volume divergence analysis.
For example, a bearish volume divergence paired with an overbought RSI can serve as a robust signal to consider selling or shorting.
Similarly, a bullish divergence confirmed by MACD crossovers can support a buying decision.
Define Entry and Exit Points
Use volume divergence insights to establish clear entry and exit points for trades.
For instance, if you observe bullish volume divergence, consider entering a long position near a price trough, especially if confirmed by other indicators.
Conversely, bearish volume divergence can signal an ideal point to initiate a short position near a price peak.
Implement Risk Management Strategies
Ensure your trading strategy incorporates risk management to protect against false signals and unexpected market shifts.
This can be achieved through strict stop-loss orders based on key support/resistance levels or a set percentage of your trading capital to minimize potential losses.
Join UEEx
Experience the World’s Leading Digital Wealth Management Platform
Volume indicators are essential tools for spotting volume and price divergence. The following are popular volume indicators for identifying divergences and assessing market trends.
On-Balance Volume accumulates volume based on whether the price closes higher or lower than the previous period. When OBV diverges from price, it often signals a trend shift. For example:
If OBV is increasing while the price declines, it suggests that buyers are accumulating, signaling a potential price rise.
If OBV is decreasing while the price rises, it indicates a bearish divergence and potential price drop .
The Chaikin Money Flow indicator measures buying and selling pressure over a specific period. Positive CMF values indicate buying pressure, while negative values suggest selling pressure.
Divergences between CMF and price can signal potential reversals or trend continuations.
The Volume-Weighted Average Price helps traders understand an asset’s average trading price based on volume.
When price diverges significantly from the VWAP, it may indicate overbought or oversold conditions, suggesting an upcoming reversal.
Conclusion
Volume and price divergence is an invaluable tool for crypto traders aiming to identify potential market reversals and assess trend strength.
With the knowledge to analyze discrepancies between price and trading volume, traders can gain insights into whether a trend is likely to continue or reverse.
Price is what the market shows you. Volume is what the market is telling you.
When they agree, the trend is real. When they don’t when price climbs while participation quietly fades- volume and price divergence is the signal that a shift is coming before price confirms it.
The traders who use this tool effectively are not the ones who act on every divergence they see.
They are the ones who wait for divergence at structure, confirm it with a second signal, and enter with a defined stop.
That discipline is what separates a divergence signal from a divergence trade.
Apply what you have read here on UEEx, where low fees mean divergence setups cost you less to execute, and tight spreads mean you enter where you intend to.
Join UEEx
Experience the World’s Leading Digital Wealth Management Platform
Volume and price divergence occurs when the price of an asset and its trading volume move in opposite directions, signaling potential trend reversals or weakening momentum.
Why is volume important in trading?
Volume is important in trading because it indicates the strength and interest in an asset’s price movement. High volume supports trends, while declining volume may signal weak momentum or potential reversals.
What are common types of divergence?
The two common types of divergence are bullish divergence (price falls, volume/momentum rises) and bearish divergence (price rises, volume/momentum falls).
Abeeb is a goal-oriented content writer with over 4 years of experience in crafting compelling and insightful content across various genres, including tech, news, entertainment, and blockchain. Known for building strong connections with clients and stakeholders, Abeeb is dedicated to delivering clear, concise, and impactful writing that captivates audiences.
Disclaimer: This article is intended solely for informational purposes and should not be considered trading or investment advice. Nothing herein should be construed as financial, legal, or tax advice. Trading or investing in cryptocurrencies carries a considerable risk of financial loss. Always conduct due diligence before making any trading or investment decisions.


")


