Crypto technical analysis platforms are software tools that provide traders with real-time price charts, technical indicators, and historical market data to evaluate cryptocurrency price action and time their entries and exits. They range from free browser-based charting suites used by casual traders to institutional-grade data terminals that process on-chain activity for hedge funds. As of Q1 2026, the gap between free and paid tiers has narrowed significantly – but the gap between general-purpose tools and specialized ones has grown. Choosing the right platform shapes your ability to read market structure, test strategies, and manage risk with repeatable discipline.
What Features Should You Look for in a Crypto Technical Analysis Platform?
Not every platform serves every trader. A scalper needs sub-second data refreshes and one-click order routing. A swing trader needs clean multi-timeframe charts and a dependable indicator library. Before comparing products, define what your workflow actually requires.
The baseline checklist for any serious platform includes:
Chart types and timeframes- candlestick, Heikin Ashi, Renko, and bar charts across timeframes from 1-minute to monthly
Drawing tools- trendlines, Fibonacci retracements, pitchforks, and annotation layers
Backtesting engine- ability to run strategies against historical price data before committing real capital
Exchange data feeds- real-time or near-real-time connections to spot and derivatives markets
Alert system- price, indicator, and pattern-based notifications so you are not watching charts continuously
Security matters too. Two-factor authentication, encrypted API key storage, and a verifiable uptime track record are non-negotiable if you plan to connect a platform directly to your exchange accounts.
Which Crypto Technical Analysis Platforms Lead the Market in 2026?
As of Q1 2026, TradingView is the most visited investing and charting website globally according to SimilarWeb data, serving over 100 million registered users. Its dominance is not accidental – TradingView combines accessibility with analytical depth in a way that no direct competitor has fully matched. Below is a comparison of leading platforms across key dimensions relevant to crypto traders.
Platform
Best For
Starting Price
Standout Feature
Crypto Coverage
TradingView
All trader types
Free / $12.95/mo
Pine Script custom indicators + social community
Broad – spot, perps, indices
Dex Screener
DeFi / DEX traders
Free
Real-time multi-chain DEX on-chain data
All major DEX chains
Coinigy
Multi-exchange active traders
$18.66/mo
Unified charting across 45+ exchanges
45+ CEX integrations
Messari
Institutions and professionals
$10/mo (Lite)
On-chain data + curated research reports
Deep token-level analytics
Glassnode
On-chain analysts
$29/mo
Bitcoin and Ethereum on-chain metrics
BTC, ETH, select L2s
altFINS
Altcoin traders
Free / $90/yr
Pre-built altcoin pattern screens + signals
Hundreds of altcoins
CoinGecko
Beginners and researchers
Free
Wide token coverage with basic charting
10,000+ tokens
How Does TradingView Work and Why Is It So Widely Used?
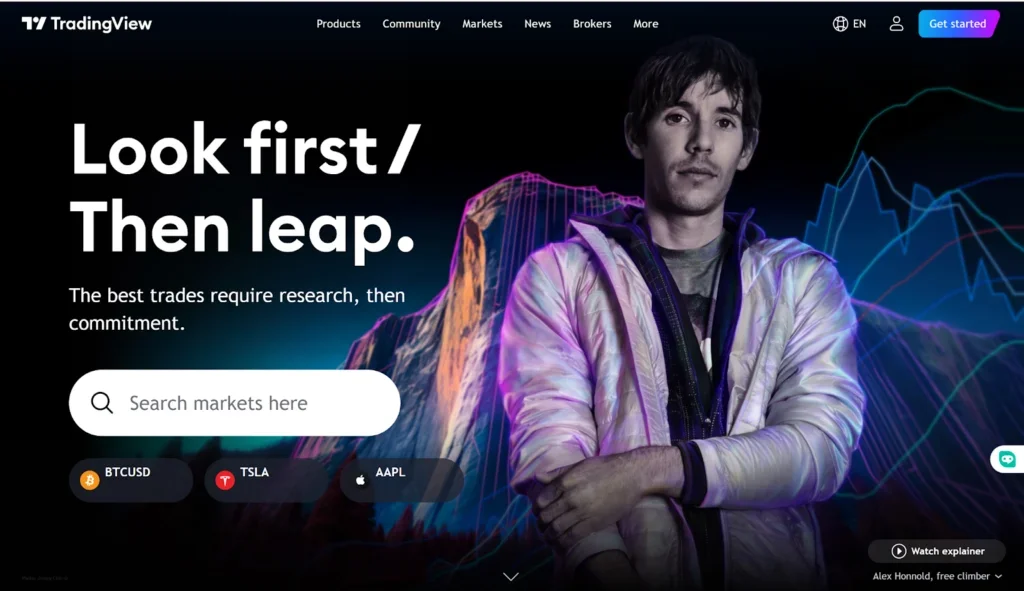
TradingView operates as a browser-based platform with native desktop and mobile apps. Its core strength is Pine Script – a scripting language that lets any user write, share, and publish custom technical indicators or strategy scripts. The community has published hundreds of thousands of open-source scripts, so traders without coding experience can still access sophisticated tools built by others.
Subscription tiers in 2026 run from free (3 indicators per chart) to Essential at $12.95/month, Plus at $24.95/month, and Premium at $49.95/month. Paid tiers unlock more indicators per chart, faster data refresh rates, extended historical data, and server-side strategy alerts. For most retail crypto traders, Essential or Plus covers the full range of practical needs without paying for features reserved for institutional workflows.
TradingView also holds a 4.9-star rating in the Apple App Store finance category – a reflection of how heavily traders rely on it for mobile monitoring of open positions and price alerts.
What Makes Dex Screener Different From Traditional Charting Platforms?
Dex Screener targets a fundamentally different use case. Traditional platforms pull data from centralized exchanges through official APIs. Dex Screener indexes on-chain swap events directly from decentralized protocols across Ethereum, Solana, BNB Chain, Arbitrum, Base, and dozens of other networks.
This distinction matters for DeFi traders. A token might launch on Uniswap hours before it appears on any centralized exchange feed. Dex Screener shows that token’s price action from the first swap, along with liquidity depth, holder concentration, and contract verification status. The entire core feature set is free, making it the default first stop for traders evaluating new token launches and low-cap opportunities that have not yet reached major exchanges.
How Do Institutional Platforms Like Messari and Glassnode Differ From Retail Tools?
Messari and Glassnode aim at professional users who need data beyond price charts. Their value lies in structured on-chain metrics, tokenomics breakdowns, governance activity tracking, and analyst research. In Q1 2026, on-chain analytics became standard workflow for institutional desks managing crypto allocations following the post-ETF approval wave of institutional capital into Bitcoin.
Messari’s Pro tier at $39/month includes API access and full research archives, while enterprise contracts serve funds needing bulk data exports and custom feeds. Glassnode specializes in Bitcoin and Ethereum on-chain data, offering metrics like exchange inflows, long-term holder supply changes, and realized price – data types that price charts alone cannot provide.
The distinction from retail tools like TradingView is not about quality. It is about data type: price chart analysis and on-chain analytics answer different questions, and experienced traders increasingly use both layers together rather than treating them as alternatives.
What Should Beginners Look for When Choosing a Technical Analysis Platform?
The most frequent mistake beginners make is choosing the most feature-rich platform available and getting overwhelmed before they have learned to read basic price structure. Starting with TradingView’s free tier or CoinGecko lets you learn candlestick patterns, draw support and resistance, and apply basic indicators without paying for capabilities you cannot yet use.
Four practical starting steps:
Open a free TradingView account and study Bitcoin’s 4-hour chart with the 20-period and 200-period moving averages applied – nothing else initially
Practice drawing horizontal support and resistance lines at obvious swing highs and lows before adding any indicators
Use TradingView’s paper trading feature to simulate entries and exits without real capital at risk
Add one momentum indicator like RSI only after you are comfortable with price structure basics
Cameron Allen, founder of Digital Whale Club, framed it plainly: “The key features I look for are just good indicators that I know and trust when making my trades.” Familiarity and consistency produce better results than the size of your toolset.
How Do You Safely Connect a Technical Analysis Platform to Your Exchange?
Most platforms connect to exchanges via read-only API keys that allow the platform to pull your portfolio balances and order history without the ability to place or cancel orders. This is the recommended setup for charting and portfolio tracking. TradingView’s broker integration goes further, enabling full order placement directly from the chart interface for supported exchanges.
When setting up API connections:
Generate keys with the minimum permissions required – read-only for charting tools, never withdrawal permissions
Never share API keys with platforms that cannot clearly explain how they store and encrypt credentials
Rotate API keys every 90 days as a baseline security practice
Store API secrets in a password manager, never in plain-text files or browser autofill
What Role Does Backtesting Play in Choosing a Platform?
Backtesting applies a trading strategy to historical price data and measures how it would have performed. A platform without backtesting forces you to evaluate strategies on forward-looking intuition alone – a weak basis for any systematic decision-making process.
TradingView’s Strategy Tester, available on all paid plans, reports net profit, win rate, maximum drawdown, and profit factor for any Pine Script strategy run against historical data. altFINS offers pre-built screens with historical performance metrics for its pattern-based signals, removing the scripting step entirely. When evaluating platforms, check whether the backtesting engine uses point-in-time data or inadvertently introduces look-ahead bias – some simpler implementations include future data in their calculations, inflating apparent performance figures.
Practical Tips for Getting the Most From Your Technical Analysis Platform
Standardize your chart template.Save a default layout with your preferred indicators, colors, and timeframe so every chart opens consistently. Switching between different setups mid-session slows analysis and creates unnecessary decision fatigue.
Set alerts instead of watching charts.Configure price alerts at key technical levels and step away. Watching charts continuously creates emotional pressure that degrades decision quality. Let the alert bring you back when the setup you planned is actually triggering.
Review your trade log weekly.Most platforms allow you to annotate charts with actual entry and exit points. Reviewing those annotations against what indicators were showing at the time builds pattern recognition faster than any tutorial or course.
Test on demo before going live.TradingView’s paper trading feature and most exchange demo accounts let you confirm your platform setup works correctly before real capital is at stake. This step catches configuration errors and unrealistic expectations before they cost money.
Keep your indicator count low.Three well-understood indicators used consistently will outperform ten half-understood ones. Stacking similar indicators creates false confidence without adding analytical value – redundant signals are not confirmation, they are noise.
Frequently Asked Questions About Crypto Technical Analysis Platforms
Q1: Is TradingView’s free plan sufficient for most crypto traders?
TradingView’s free plan supports three indicators per chart, basic alert functionality, and access to the full indicator library. For traders who consistently use two or three core indicators, the free tier is sufficient. The Essential plan at $12.95 per month becomes worth it once you regularly need more than three overlapping indicators or want faster data refresh rates when monitoring volatile markets in real time.
Q2: Can you use multiple technical analysis platforms at once?
Yes, and many professional traders do. A common setup in 2026 pairs TradingView for charting and pattern analysis with a dedicated on-chain platform like Glassnode or Nansen for market intelligence. Running Dex Screener alongside TradingView is standard practice for traders who move between DEX-listed tokens and major exchange pairs within the same session.
Q3: Do these platforms cover DeFi tokens that are not listed on major exchanges?
Centralized charting platforms like TradingView only display tokens with data feeds from exchanges they are connected to. For DeFi-native tokens on decentralized protocols, Dex Screener is the practical choice because it indexes on-chain swap data directly. Many newer tokens appear on Dex Screener hours or days before any centralized platform picks them up.
Q4: What is the difference between a technical analysis platform and a crypto exchange?
A technical analysis platform is a data visualization and analysis tool. It shows price history, indicators, and patterns but in most cases does not hold your funds or execute trades. A crypto exchange is where trades settle and funds are custodied. Some exchanges embed TradingView charts within their interface, which blurs the visual distinction, but the underlying functions remain entirely separate.
Q5: How accurate are technical indicators on crypto charts compared to stock charts?
The calculations are identical – technical indicators are mathematical formulas applied to price and volume data regardless of asset class. Crypto markets operate 24/7, have lower average liquidity than major equity indices, and respond more sharply to social media catalysts and large-holder activity. These factors produce more false signals in crypto than in equities, which is why experienced traders combine indicator readings with volume analysis and on-chain data.
Q6: Is altFINS worth paying for instead of a free alternative?
altFINS is built specifically for altcoin traders who want pre-screened technical setups rather than building their own scans. Paid plans start at $90 per year and include automated pattern detection across hundreds of altcoins, on-chain signal alerts, and a curated watchlist of coins showing actionable setups. For traders focused on altcoin opportunities rather than BTC and ETH, that specialization justifies the cost compared to a general-purpose free tool.
With years of experience in technical and crypto writing, I am a highly skilled writer who enjoys breaking down complex topics into easy-to-understand pieces. My expertise lies in the technology, open-source, blockchain, and cryptocurrency industry, where I strive to deliver engaging and informative content that educates and empowers readers.
Disclaimer: This article is intended solely for informational purposes and should not be considered trading or investment advice. Nothing herein should be construed as financial, legal, or tax advice. Trading or investing in cryptocurrencies carries a considerable risk of financial loss. Always conduct due diligence before making any trading or investment decisions.
Trade with proof of Reserves
UEEx publish monthly audits and third party verification on every listed market.