Crypto market analysis is the process of evaluating cryptocurrency assets using fundamental data, price charts, on-chain blockchain activity, and sentiment indicators to make informed trading and investment decisions. As of Q1 2026, the global crypto market holds a total capitalisation above $2.8 trillion, Bitcoin commands roughly 59% dominance, and thousands of altcoins compete across dozens of sectors. Without a structured analytical framework, separating genuine signal from noise is nearly impossible – and costly.
Key Takeaways
- Effective crypto market analysis combines three pillars: fundamental analysis (evaluating project value), technical analysis (reading price and volume patterns from charts), and on-chain analysis (examining actual blockchain data to understand holder behaviour).
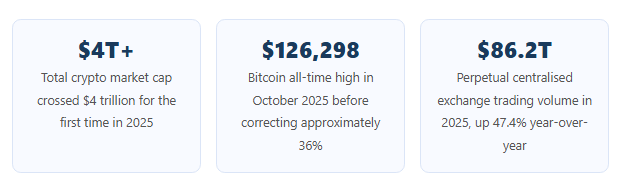
- The total crypto market cap crossed $4 trillion for the first time in 2025. Bitcoin reached $126,298 in October 2025. Perpetual centralised exchanges recorded $86.2 trillion in trading volume in 2025, up 47.4% year-over-year.
- On-chain metrics including MVRV ratio, SOPR, exchange netflows, and HODLer behaviour provide insight into market conditions that price charts alone cannot reveal. These metrics are unique to crypto and have no equivalent in traditional financial analysis.
- Market sentiment tools including the Crypto Fear and Greed Index quantify investor psychology, with extreme fear readings (0 to 20) historically aligning with buying opportunities and extreme greed (80 to 100) with elevated correction risk.
- External factors including Federal Reserve policy, regulatory developments, and macro risk appetite increasingly dominate crypto price action. Bitcoin’s 6-month correlation with the NASDAQ reached 92% in 2025, making macro analysis as important as crypto-specific analysis.
- Analytical tools essential for a complete market analysis framework include TradingView for technical analysis, Glassnode or CryptoQuant for on-chain data, CoinGecko for fundamental metrics, and reputable news sources for regulatory and project developments.
What Is Crypto Market Analysis?

What Is Crypto Market Analysis and Why Does It Matter?
Crypto market analysis is the structured examination of factors that drive cryptocurrency prices. Unlike traditional equity markets, crypto operates 24 hours a day, seven days a week, across global exchanges with minimal regulatory uniformity. This makes disciplined analysis more important, not less. Traders and investors apply three broad categories – fundamental, technical, and on-chain analysis – often alongside sentiment tools, to build a picture of where an asset or the broader market is heading.
Each method answers a different question. Fundamental analysis asks whether an asset has real underlying value. Technical analysis asks what the price is doing right now and where it is likely to go next. On-chain analysis asks what network participants are actually doing with their assets. Sentiment analysis asks how the market feels. Used together, they provide a view that no single method can match.
Also Read: How to do On-Chain Analysis and Why It Gives You a Real Edge?
How Do the Main Methods of Crypto Market Analysis Compare?
| Method | What It Examines | Best For | Key Limitation |
| Fundamental Analysis | Project utility, team, tokenomics, adoption rate, partnerships | Long-term investors evaluating asset quality | Cannot predict short-term price moves; project data can be opaque |
| Technical Analysis | Price charts, volume, moving averages, support/resistance | Short-to-medium term traders identifying entries and exits | Lagging by nature; false signals common in low-liquidity markets |
| On-Chain Analysis | Wallet flows, exchange inflows/outflows, active addresses, miner data | Spotting accumulation phases, whale behaviour, exchange sell pressure | Requires specialist tools; data interpretation has a learning curve |
| Sentiment Analysis | Social media volume, Fear & Greed Index, search trends, news flow | Gauging market psychology around news events and macro announcements | Highly reactive; can be manipulated by coordinated campaigns |
What Are the Best Tools for Crypto Market Analysis in 2026?
A Bloomberg Digital Assets survey found that 78% of professional crypto traders use at least three different research tools, with top performers averaging 5.7 tools regularly. The good news is that most essential tools have free tiers sufficient for individual investors.
| Category | Tool | What It Does | Cost |
| Charting / Technical | TradingView | Industry-standard charting, 100+ indicators, multi-exchange data, community scripts | Free tier available; Pro from ~$15/mo |
| Charting / Technical | Coinigy | Multi-exchange charting and portfolio tracking in one dashboard | Free trial; paid plans from $18.66/mo |
| Price & Market Data | CoinGecko | Real-time prices, market cap, volume, developer activity scores, exchange rankings | Free; API paid |
| Price & Market Data | CoinMarketCap | Prices, market cap, dominance charts, news aggregation | Free; API paid |
| On-Chain Analysis | Glassnode | Exchange flows, long-term holder supply, miner activity, SOPR, MVRV ratios | Free basic tier; Advanced from $29/mo |
| On-Chain Analysis | CryptoQuant | Exchange reserve data, funding rates, liquidation maps, BTC miner outflows | Free tier; Pro from $29/mo |
| On-Chain Analysis | Santiment | On-chain metrics combined with social sentiment signals; good for altcoin analysis | Free limited; paid plans available |
| Research & Fundamentals | Messari | Token profiles, sector reports, fundraising data, governance tracking | Free tier; Pro from $24.99/mo |
| AI-Powered Analysis | Arkham Intelligence | AI-labeled wallet tracking, entity identification, transaction flow visualisation | Free with ARKM tokens for some data |
| Sentiment | Alternative.me Fear & Greed Index | Daily composite sentiment score combining volatility, volume, social data, surveys | Free |
What Drives the Crypto Market and How Do You Read Those Signals?
How Do Macroeconomic Conditions Affect Crypto Prices?
Interest rate decisions by central banks remain one of the most direct external forces on crypto valuations. When rates are high, capital moves toward yield-bearing instruments like bonds, reducing appetite for higher-risk assets. When monetary policy loosens, liquidity flows back into growth and speculative assets. As of Q1 2026, the Federal Reserve’s rate trajectory continues to be one of the most closely tracked variables across crypto analyst desks.
Bitcoin is frequently cited as a hedge against currency debasement, which means periods of high inflation can generate buying interest – though actual correlation with inflation data has been inconsistent across market cycles. Analysts generally treat macro as a directional tailwind or headwind rather than a precise price predictor.
What Role Does Technology Development Play in Market Direction?
The crypto market is not purely speculative – technological progress directly affects which projects hold or gain value. Three areas drew significant analyst attention heading into 2026:
- Layer 2 scaling solutions- Networks built on top of base-layer blockchains, such as Ethereum’s Optimism and Arbitrum, that reduce transaction costs and expand practical use cases.
- Cross-chain interoperability- Bridges and messaging protocols that let assets and data move between separate blockchains, reducing ecosystem fragmentation.
- Zero-knowledge proofs– Privacy-preserving cryptographic techniques that also improve scalability by allowing large batches of transactions to be verified with minimal on-chain footprint.
Projects that ship meaningful upgrades attract sustained developer activity – a measurable on-chain signal that analysts monitor via active developer commit counts on platforms like GitHub and CoinGecko’s developer score.
How Does Regulation Shape Market Behaviour?
Regulatory announcements have caused some of the sharpest single-day price moves in crypto history. Clarity is generally positive for markets – institutional capital that has been waiting for defined rules often enters once a jurisdiction sets them. Ambiguity or enforcement actions, by contrast, can trigger rapid sell-offs. In Q1 2026, Bitcoin approached $109,000 before pulling back as macroeconomic uncertainty and mixed regulatory signals in several jurisdictions weighed on sentiment.
What Is Market Sentiment and How Do You Measure It?
Crypto markets are deeply influenced by collective psychology. The Crypto Fear and Greed Index aggregates social media volume, market momentum, volatility, and survey data into a single daily score from 0 (extreme fear) to 100 (extreme greed). Extreme fear readings have historically coincided with market bottoms; extreme greed readings have often preceded corrections. Sentiment does not replace price or on-chain analysis, but it adds useful context, particularly around major news events.
How Do You Apply Technical Analysis to Crypto Markets?
Technical analysis assumes all available information is already reflected in the price. Analysts therefore focus on price and volume patterns rather than external fundamentals.
What Are Moving Averages and How Are They Used in Crypto?
Moving averages smooth out price data over a defined period, making trends easier to read. The 50-day and 200-day simple moving averages (SMAs) serve as reference points for most analysts. When the 50-day crosses above the 200-day – the Golden Cross – it reads as a bullish signal. The reverse, the Death Cross, signals bearish momentum. These crossovers work best in trending markets; in low-volume, sideways conditions they produce frequent false signals that experienced traders learn to filter.
How Do Support and Resistance Levels Work in Crypto Trading?
Support is a price level where historical buying interest has stopped downward moves. Resistance is the ceiling where selling pressure has outweighed buying. These levels form from historical price action: previous highs become resistance, previous lows become support. When resistance breaks convincingly, it often flips to become the new support – a concept traders use to set entry points on price retracements.
What Does Trading Volume Reveal About Price Moves?
Volume confirms or questions price moves. A breakout accompanied by high volume is more reliable than one on thin volume, which can easily reverse. Analysts also watch for divergences: if price makes new highs while volume declines, it can indicate weakening buying conviction and a potential reversal. Volume-price divergence is one of the more actionable signals in technical analysis.
What Is On-Chain Analysis and What Are Its Most Useful Metrics?
On-chain analysis gives analysts a view inside the blockchain itself. Unlike price charts, which show market behaviour, on-chain data shows what network participants are actually doing with their holdings.
The most widely followed metrics include:
- Exchange inflows and outflows- Large inflows to exchanges often signal that holders are preparing to sell. Large outflows to private wallets suggest accumulation, which is generally read as bullish.
- Active addresses- Rising active address counts indicate growing network usage, which has historically preceded or accompanied price appreciation.
- Long-term holder supply- The proportion of Bitcoin unmoved for over a year is a proxy for investor conviction. Rising long-term holder supply typically signals an accumulation phase.
- Miner behaviour- When miners transfer significant amounts to exchanges, it can signal near-term sell pressure. Historical miner capitulation events have marked price floors in prior Bitcoin bear markets.
- MVRV ratio- Market Value to Realised Value compares current market cap against the aggregate cost basis of all Bitcoin holders. Readings above 3.5 have historically indicated overheated markets; readings below 1 have coincided with bear market bottoms.
What Investment Strategies Match Different Analytical Approaches?
What Is the Hodling Strategy and When Does It Work?
Holding assets through market cycles regardless of short-term price swings suits investors with high risk tolerance and long time horizons. It reduces trading costs and removes the need to time entries and exits precisely. The trade-off is that it requires genuine conviction and the discipline to hold through drawdowns that have historically exceeded 70–80% during bear markets.
How Does Dollar-Cost Averaging Reduce the Impact of Bad Timing?
Dollar-cost averaging (DCA) means investing a fixed amount at regular intervals – weekly or monthly – regardless of current price. Over time, this produces a lower average cost basis than a single lump-sum purchase made at a market peak. DCA suits investors who want crypto exposure without attempting to predict tops and bottoms, and it pairs well with fundamental analysis to confirm the assets are worth holding through dips.
What Does Active Trading Actually Require?
Active trading – taking frequent positions based on technical signals – can generate returns in both bull and bear markets through long and short positions. It demands significant time, emotional discipline, and rigorous risk management. Most active traders set stop-loss orders and position-sizing rules to limit damage from losing trades, because even experienced traders maintain win rates below 60% in volatile conditions.
How Should You Manage Risk Alongside Your Market Analysis?
Analysis identifies opportunities; risk management determines whether you stay in the market long enough to benefit from them. Four practices form the foundation:
- Portfolio diversification- Spreading capital across assets with different use cases and risk profiles reduces the impact of any single project failing or underperforming its sector.
- Position sizing- Many traders cap individual positions at 2–5% of total portfolio value, so no single losing trade causes significant damage to overall capital.
- Stop-loss orders- Pre-set orders that close a position at a specified loss threshold remove emotion from exit decisions and cap downside exposure automatically.
- Capital allocation discipline- Only allocating funds you can afford to lose entirely without affecting financial stability. Crypto’s volatility makes this a practical rule, not a disclaimer.
Which Crypto Sectors Are Worth Watching for Analysis Purposes in 2026?
Not all crypto assets move in step. Sector-level analysis helps identify areas of outperformance within broader market moves. As of Q1 2026, three areas have attracted consistent institutional and retail attention:
Decentralised finance (DeFi) – Protocols enabling lending, borrowing, and trading without intermediaries. Total Value Locked (TVL) across DeFi protocols is a widely tracked sector health metric available on DeFi Llama for free.
Real-world asset tokenisation (RWA) – Representing physical assets like real estate, bonds, and commodities as blockchain tokens. Institutional interest grew substantially as regulatory frameworks in multiple jurisdictions provided clearer pathways for compliant tokenisation projects in 2026.
Web3 infrastructure – Storage networks, oracle services, and identity protocols that underpin decentralised applications. Developer activity in this sector is measurable on-chain and serves as a forward-looking indicator of ecosystem health.
Practical Tips for Better Crypto Market Analysis
- Use at least three information sources before entering any position. Price charts, one on-chain metric, and a sentiment check take under ten minutes and catch conflicting signals that single-source analysis misses.
- Set your exit conditions before you enter. Define both a profit target and a stop-loss level in advance. Markets move fast, and decisions made under pressure are rarely your best ones.
- Track Bitcoin dominance weekly. It is one of the fastest reads on whether the market is rotating toward risk or away from it, and it costs nothing to monitor on CoinMarketCap.
- Keep a trading journal. Recording your entry rationale and outcome for each position is the fastest way to identify which analytical signals are actually working for your style and time horizon.
- Start with free tools before paying for premium tiers. Glassnode, CryptoQuant, and Santiment all offer meaningful free data. Build familiarity before upgrading.
- Separate your analytical timeframe from your emotional timeframe. If your analysis is built on weekly charts, do not let hourly candle movements change your conviction. Mismatched timeframes account for a large share of avoidable trading errors.
UEEx Tip: Before entering any position, define your exit conditions – both profit targets and stop-loss levels – in advance. Markets move fast, and decisions made under price pressure are rarely your best ones.
This article is for informational purposes only and does not constitute financial or investment advice. Cryptocurrency markets carry significant risk. Always conduct your own research before making investment decisions.
Frequently Asked Questions About Crypto Market Analysis
What is the most reliable method for analysing the crypto market?
No single method is universally superior. Most experienced analysts combine technical analysis for timing, fundamental analysis for asset selection, and on-chain data for confirmation. According to a Bloomberg Digital Assets survey, top-performing crypto traders use an average of 5.7 tools. The right weighting depends on your time horizon – long-term investors lean on fundamentals, while active traders prioritise charts and volume signals.
How does Bitcoin dominance affect altcoin performance?
Bitcoin dominance – its share of total crypto market capitalisation – tends to rise during risk-off periods and fall during altcoin seasons. As of Q1 2026, Bitcoin’s dominance stood near 59%. When dominance rises sharply, capital typically rotates out of altcoins into Bitcoin. When it falls, altcoins tend to outperform. Tracking this single metric can give investors an early read on rotation trends across the broader market.
Which on-chain metrics should beginners start with?
Exchange inflows and outflows are the most accessible starting point. High inflows signal potential sell pressure; high outflows to private wallets suggest accumulation. Active address counts and total transaction volume are equally straightforward measures of whether a network is growing in real usage. Glassnode’s free public dashboard and CryptoQuant’s basic tier are good entry points that require no paid subscription.
How do interest rate decisions affect the crypto market?
Higher interest rates raise the opportunity cost of holding non-yielding assets like most cryptocurrencies. When central banks tighten policy, capital typically moves toward bonds and yield-bearing instruments, reducing demand for crypto. Rate cuts have the opposite effect, loosening financial conditions and increasing appetite for higher-risk assets. Federal Reserve decisions have had demonstrable, often same-day price impact on Bitcoin and the broader market through multiple cycles.
Is it possible to predict crypto market crashes?
No method predicts crashes with certainty. Analysts watch for clusters of warning signals: extreme greed readings on sentiment indexes, large exchange inflows from long-term holders who rarely move their coins, declining volume during price advances, and macro triggers such as surprise rate hikes or major enforcement actions. These signals raise the probability of a correction but cannot confirm timing or depth in advance.
What is the difference between a bull market and a bear market in crypto?
A bull market is a sustained period of rising prices, growing adoption, positive sentiment, and increasing volume. A bear market features declining prices – historically by 70–80% from peak levels in crypto’s prior cycles – along with reduced network activity and pervasive negative sentiment. Identifying the current phase shapes nearly every analytical and strategic decision, from which assets to hold to how large a position to take.