Two traders can look at the exact same asset and reach opposite conclusions. One pulls up a chart and sees a breakout. The other opens a balance sheet and sees a bargain. Both can be right, and both can make money, because they’re answering two different questions.
That’s the core of the technical analysis vs fundamental analysis debate. Technical analysis studies price and volume to guess where an asset is headed next. Fundamental analysis studies the business or economy behind the asset to work out what it’s actually worth.
In 2026, with AI tools reading earnings calls in seconds and on-chain dashboards tracking crypto wallets in real time, the two methods are closer together than ever, but the core logic hasn’t changed.
This guide walks through both methods in plain language, shows you how they apply differently to stocks, crypto, and forex, and gives you a practical framework for using them together.
Key Takeaways
- Technical analysis reads charts to time entries and exits. Fundamental analysis studies value to decide what to buy in the first place. Most experienced traders use both, just in different amounts.
- Your time horizon should decide the mix. Day and swing trades lean technical. Long-term investing leans fundamental.
- Crypto needs a different fundamental toolkit. There are no earnings or P/E ratios, so traders use on-chain data, tokenomics, and network growth instead.
- Forex is driven mainly by macro fundamentals, especially interest rate differences between countries, with technicals used for timing entries.
- No amount of analysis fixes bad risk management. Position sizing and stop-losses matter more than which method you prefer.
Technical Analysis
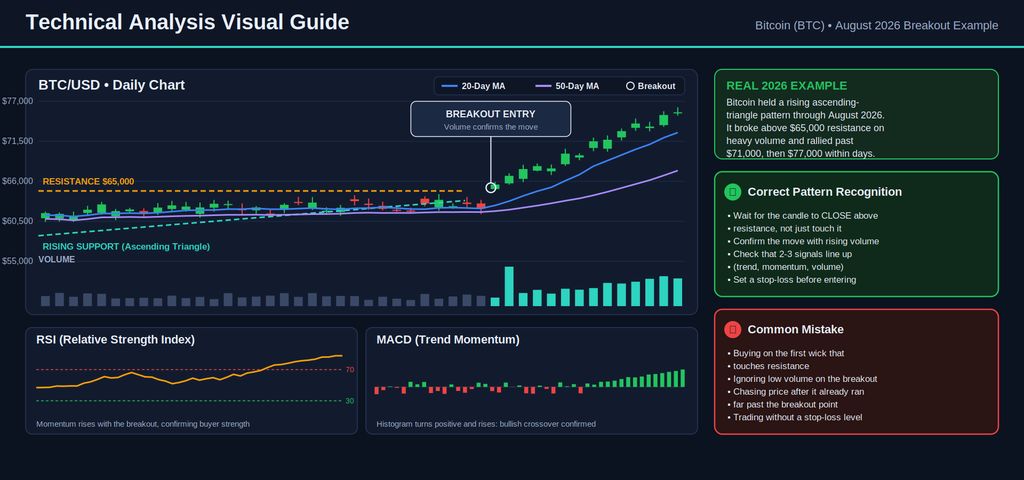
Technical analysis is the study of past price and volume data to predict future price movement. It uses charts, patterns, and indicators instead of financial statements, and it works on the idea that price already reflects all known information.
It rests on three ideas:
1. Price reflects everything: News, earnings, sentiment, and rumors are all supposedly already baked into the current price.
2. Prices move in trends: Once a trend starts, it tends to continue until something meaningfully changes.
3. History tends to repeat: Because crowds of people react to fear and greed in similar ways, chart patterns show up again and again.
The Main Tools
- Chart patterns: head and shoulders, double tops and bottoms, triangles, flags
- Indicators: moving averages, Relative Strength Index (RSI), Moving Average Convergence Divergence (MACD), Bollinger Bands, stochastic oscillator
- Volume analysis: confirms whether a move has real conviction behind it
- Support and resistance: price levels where buyers or sellers repeatedly show up
- Candlestick patterns: doji, hammer, engulfing candles, morning star
You can build and test these setups for free on TradingView, which has become the default charting tool for retail traders in 2026, and Investopedia’s technical analysis section is a solid reference if you want plain-English definitions of any indicator you come across.
Who Actually Uses It
Day traders, scalpers, and swing traders lean on technical analysis the most, simply because they don’t have time to wait for a business thesis to play out. Algorithmic trading desks and market makers also rely on it heavily, since price action is the only input their systems need.
Real Example
In August 2026, Bitcoin spent several sessions holding a floor near $62,600 while trading below its 50-day and 200-day moving averages, a setup that pointed to a corrective, sideways trend.
Then, in the space of two days, Bitcoin jumped from around $64,300 to above $71,900 and kept climbing past $77,000 after renewed political momentum behind U.S. crypto market-structure legislation and a pullback in long-term Treasury yields.
A trader watching price action alone would have seen the break above the 50-day and 100-day moving averages and treated it as confirmation that the corrective phase was over, all without reading a single whitepaper or economic report.
Quick rule of thumb: Technical analysis tells you what the crowd is doing right now. It doesn’t tell you if the crowd is right.
Fundamental Analysis
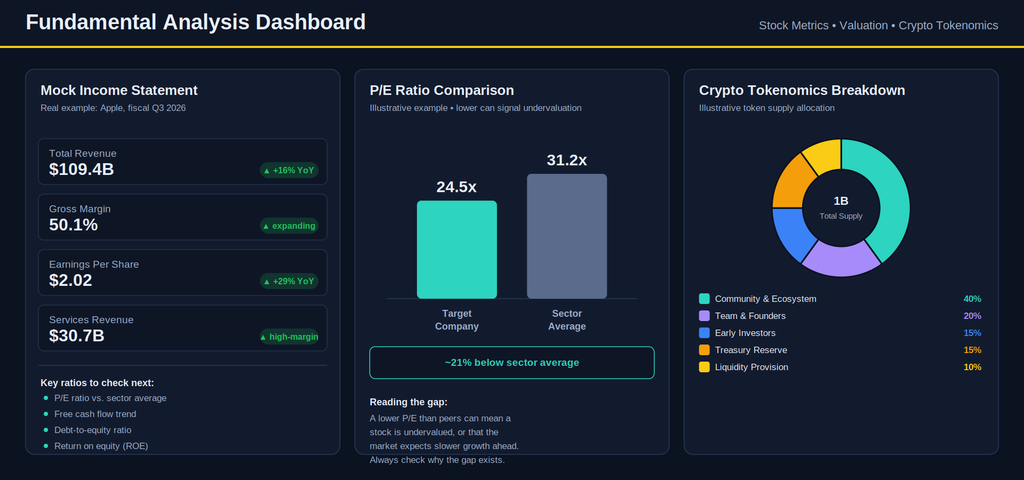
Fundamental analysis is the process of working out an asset’s true worth by studying the business, economy, or system behind it, rather than its price chart. The goal is to find a gap between the market price and the real value, then trade on the assumption that price eventually catches up.
It rests on a few core beliefs:
- Every asset has an intrinsic value that can be estimated
- Markets misprice assets in the short run, but tend to correct over time
- Buying below intrinsic value, and selling above it, is the path to long-term returns
Core Components by Asset Type
For stocks:
- Financial statements (income statement, balance sheet, cash flow)
- Valuation ratios: P/E, PEG, price-to-book, EV/EBITDA
- Profitability: ROE, ROA, margins, earnings growth
- Competitive advantage, or “moat”
- Management quality and capital allocation
You can pull raw company filings straight from SEC EDGAR, which is the primary source for U.S. 10-K and 10-Q reports, and cross-check broader economic conditions on the Federal Reserve’s FRED database.
For crypto:
- Tokenomics: total supply, inflation schedule, staking rate
- Network activity: active addresses, transaction volume, developer commits
- Adoption: DeFi total value locked, real-world partnerships
- Governance and decentralization
For forex:
- GDP growth, inflation (CPI), and employment data
- Central bank policy and interest rate decisions
- Political stability and trade balance
Who Actually Uses It
Long-term investors, pension funds, and value-focused portfolio managers lean almost entirely on fundamentals. This is the school of thinking Warren Buffett has built his career on: buying quality businesses below their intrinsic worth and holding for years, an approach he lays out regularly in Berkshire Hathaway’s shareholder letters.
Real Example
In late July 2026, Apple briefly overtook Nvidia as the world’s most valuable company, with a market cap near $4.95 trillion against Nvidia’s roughly $4.75 trillion. The case for Apple wasn’t built on chart patterns. Its fiscal third-quarter revenue had jumped 16% to $109.4 billion, gross margin expanded to 50.1%, earnings per share rose 29%, and services revenue, its highest-margin segment, hit $30.7 billion.
Investors also rewarded Apple for avoiding the heavy AI infrastructure spending that has pressured other tech giants’ margins. None of that shows up on a five-minute chart. It shows up in the income statement.
A company’s stock price can stay wrong for months. It rarely stays wrong forever.
Technical Analysis vs Fundamental Analysis
Technical analysis studies price charts and patterns to time trades, while fundamental analysis studies financial statements and economic data to judge what an asset is worth. Technical analysis suits short-term trading.
Meanwhile, fundamental analysis suits long-term investing. Combining both, using fundamentals to pick assets and technicals to time entries, is the approach most experienced traders eventually land on.
| Category | Technical Analysis | Fundamental Analysis |
| Focus | Price, volume, patterns | Value, financial health, economics |
| Time horizon | Days to weeks | Months to years |
| Core tools | Charts, indicators, patterns | Financial statements, ratios, economic data |
| Typical users | Day traders, scalpers, swing traders | Investors, position traders, institutions |
| Data source | Historical price and volume | Company and economic fundamentals |
| Decision speed | Minutes to hours | Days to weeks of research |
| Works well across | Stocks, crypto, forex, commodities | Best for stocks, harder for crypto and forex |
| Entry precision | Sharp (breakouts, support levels) | Broad (value zones, not exact prices) |
| Feedback loop | Fast, often same day | Slow, sometimes months or years |
| AI role in 2026 | Pattern recognition, automated alerts | Faster data synthesis, sentiment scoring |
Time Horizon Changes Everything
The single biggest factor in choosing an approach is how long you plan to hold a position. A day trader who spends two hours reading 10-Q filings before a same-day trade is wasting time, because none of that research will move the price in the next four hours.
Likewise, a long-term investor who sells a stock because its 20-day moving average dipped is ignoring the whole reason they bought it in the first place.
As a rough guide:
- Holding under a week: about 80% technical, 20% fundamental awareness (know when earnings or major data drop)
- Holding one to six months: closer to 50/50
- Holding over a year: about 75% fundamental, 25% technical, mostly for entry timing
Data Needs and Speed
Technical analysis can be done in fifteen minutes on any liquid chart. Fundamental analysis, done properly, takes hours per company, since you’re reading filings, checking competitor positioning, and modeling growth.
In 2026, AI tools have compressed this gap somewhat. Analysts now use large language models to summarize earnings call transcripts and flag tone shifts in management commentary in seconds rather than hours, but the underlying judgment about what those numbers mean still takes a human analyst.
Market Conditions
Technical analysis tends to perform best in strongly trending, high-volume markets, since momentum is easier to follow when it’s already established. Fundamental analysis tends to shine in range-bound or post-selloff conditions, where mispriced assets have time to be identified and accumulated before the crowd catches on.
Which One Is Better?
There is no clear winner between technical and fundamental analysis. Recent research shows that both can provide useful signals, but their strengths depend on the market and investment horizon.
A 2025 study found that technical signals were stronger for short-term forecasts, while accounting-based signals worked better over longer periods. A 2026 review also found that combining fundamental factors with technical and momentum signals can improve risk-adjusted performance.
The practical takeaway is simple: fundamentals can help identify what to buy, while technical analysis can help decide when to enter or exit. Rather than choosing one, investors can combine both to make more informed decisions.
Choose Technical Analysis If
- You’re trading intraday or holding for days, not months
- You’re active in forex, commodities, or crypto, where price data is abundant
- You can monitor markets during active hours
- You prefer fast decisions over long research sessions
Choose Fundamental Analysis If
- You’re investing for months or years, not days
- You’re focused on stocks, ETFs, or bonds with rich financial disclosures
- You have a research-heavy schedule rather than an active-monitoring one
- You’re comfortable holding through short-term volatility if the thesis is intact
Choose a Combined Approach If
- You want fundamentals to narrow your universe and technicals to time entries
- You’re swing trading or position trading (holding days to months)
- You have the time to do a lighter version of each per week
How to Combine Technical and Fundamental Analysis
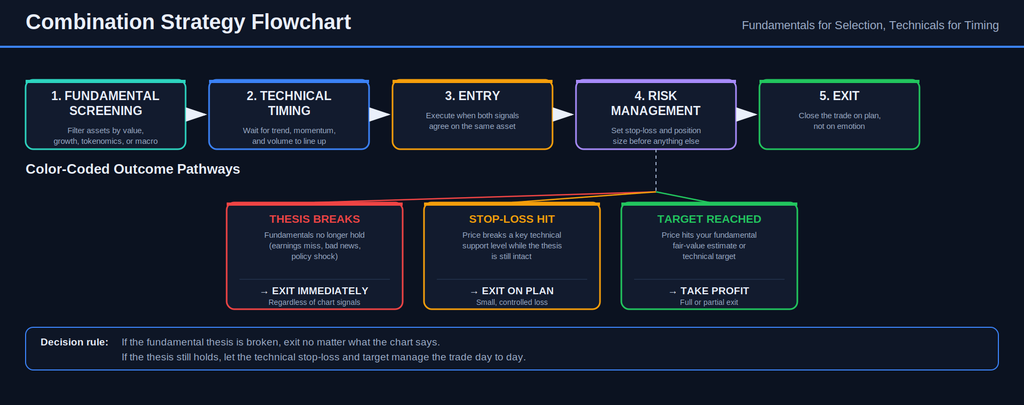
The most reliable workflow professional traders use follows three phases: fundamentals for selection, technicals for timing, and both together for risk management.
Phase 1: Fundamental Selection
Step 1: Narrow your universe
Pick a sector, market cap range, or asset category you understand well.
Step 2: Apply fundamental filters
For stocks: positive net income, revenue growth above 10% year over year, a P/E below the sector average, manageable debt, and healthy free cash flow.
For crypto: growing active addresses, real developer activity (check commit history on the project’s GitHub), a clear token supply schedule, and a genuine use case beyond speculation.
For forex: improving GDP growth, a favorable interest rate differential against other major currencies, and political stability.
Step 3: Go deeper on your shortlist
Read the latest earnings call or project update, estimate a fair value using a comparable-company or discounted cash flow approach, and note any upcoming drivers.
Phase 2: Technical Timing
Once you have a shortlist of fundamentally sound assets, wait for a technical setup before entering rather than buying immediately. Look for two or three of the following to line up:
- Trend confirmation: price trading above both the 50-day and 200-day moving averages
- Momentum: RSI sitting between 40 and 60, not overbought or oversold, with a rising MACD histogram
- Volume confirmation: rising volume on up days, a breakout accompanied by clearly above-average volume
- A support or resistance break: price clearing a level that’s held for weeks, ideally on strong volume
Phase 3: Risk Management
This is the step that gets skipped most often, and it’s the one that actually protects your account.
- Set your initial stop-loss below a real technical support level, not an arbitrary percentage
- As a position moves in your favor, trail your stop below a rising moving average to lock in gains
- Set a fundamental exit trigger too: if the thesis breaks (an earnings miss, a failed product launch, a policy shock), exit even if the chart still looks fine
If your fundamental thesis breaks, exit. A chart that still looks good doesn’t repair a broken thesis.
A simple decision tree: if the fundamental case is no longer intact, exit regardless of what the chart shows. If the fundamental case still holds, let the technical stop-loss and profit target manage the trade day to day.
For a deeper dive into position sizing and stop-loss placement, see our guide on risk management in trading.
Asset-Specific Strategies
Let’s explore how you can apply these strategies to specific assets
Stock Trading
Stocks are well suited to combining fundamental and technical analysis because they offer detailed financial data alongside deep, liquid price histories. Company filings, earnings, cash flow, and valuation metrics help answer what to buy, while price and volume data help determine when to buy or sell.
A practical approach:
- Long-term investing: Give fundamentals more weight and use technicals to improve entry points.
- Swing trading: Balance both methods. Fundamentals establish the thesis, while technicals guide entries and exits.
- Day trading: Technical analysis usually takes priority because short-term price movements are less tied to a company’s intrinsic value.
Stock trading workflow
1. Fundamental screening
- Screen for revenue and earnings growth, margins, valuation, and balance-sheet strength.
- Review recent earnings and company filings.
- Estimate fair value using DCF or comparable-company analysis.
- Build a focused watchlist.
2. Technical timing
- Look for breakouts, pullbacks, support and resistance, and moving-average setups.
- Confirm entries with price action and volume rather than relying on a single indicator.
3. Position management
- Place stops below meaningful technical support.
- Set profit targets using valuation and market structure.
- Exit when the original fundamental thesis breaks or price action confirms a major deterioration.
Stock Trading Example
NVIDIA illustrates why the two approaches work well together. Its fiscal 2025 revenue reached $130.5 billion, up 114% year over year, while Data Center revenue increased 142% and gross margin reached 75%. Those figures provided a strong fundamental case for the AI infrastructure story.
A trader could then use a breakout, pullback, or moving-average setup to time the entry rather than buying solely because the fundamentals looked attractive. NVIDIA’s latest filings are available through its investor relations page and the SEC EDGAR database.
You can also check out our related guide on how to read stock market charts if the technical side is newer to you.
Crypto Trading
Crypto requires a different definition of fundamental analysis. Most tokens do not have earnings or traditional cash flows, so investors must examine network activity, token economics, adoption, and development instead.
Key fundamental metrics include:
- On-chain activity: Active addresses, transaction volume, and network fees.
- Tokenomics: Supply, issuance, burns, staking, and unlock schedules.
- Development: Developer activity, upgrades, and protocol progress.
- Adoption: TVL, stablecoin activity, users, and ecosystem growth.
- Competitive position: Technology, liquidity, network effects, and real-world use.
Technical analysis is particularly useful for crypto because markets trade 24/7 and often experience large price swings. However, technical patterns should support a broader thesis rather than replace risk management.
Crypto trading workflow
1. Fundamental screening
Narrow the market by checking tokenomics, development activity, network usage, adoption, and competitive strength.
2. Technical timing
Use market structure, support and resistance, moving averages, volume, and momentum to identify entries and exits. Pay close attention to Bitcoin because major altcoins often respond strongly to broader BTC market conditions.
3. On-chain confirmation
Track exchange balances, whale activity, active addresses, staking, and network flows using tools such as Glassnode, CryptoQuant, Nansen, and Dune.
Example of Crypto Trading
Ethereum shows why crypto fundamentals need to go beyond price. Dencun introduced blob transactions to reduce rollup data costs, while later upgrades, including Pectra and Fusaka, continued to improve the network’s scaling and account capabilities.
Ethereum’s supply also remains dynamic: proof-of-stake creates new ETH, while EIP-1559 burns the base fee, meaning ETH can be inflationary or deflationary depending on network activity.
As of September 2026, Ethereum’s DeFi ecosystem holds close to $50 billion in TVL, making TVL, active addresses, fees, and stablecoin activity useful metrics alongside price and volume.
Platforms like CoinMarketCap and CoinGecko are useful for basic token data, while Glassnode and Nansen go deeper into on-chain flows and wallet behavior.
Our guide on long-term crypto value investing strategies covers how to build a full plan around this asset class.
Forex Trading
Forex is heavily influenced by macroeconomic conditions, so fundamental analysis often provides the broader direction while technical analysis helps with execution.
Key fundamental drivers:
- Interest-rate expectations and monetary policy
- Inflation, employment, and economic growth
- Central-bank guidance
- Bond-yield differentials
- Trade and capital flows
- Political and geopolitical developments
Interest-rate differentials remain particularly important because they influence capital flows and carry-trade strategies. Recent Bank for International Settlements (BIS) research also shows that monetary policy changes and carry-trade positioning can amplify exchange-rate moves.
Forex trading workflow
1. Build the macro view
Monitor the economic calendar, inflation, employment data, GDP, central bank meetings, and interest rate expectations.
2. Compare currencies
Ask which economy has the stronger growth outlook, monetary policy path, and yield advantage.
3. Use technicals for execution
Identify the prevailing trend, then wait for pullbacks, breakouts, or reactions at important support and resistance levels. Use multiple timeframes to avoid trading against the larger trend.
4. Manage event risk
Major releases such as CPI, employment data, and central-bank decisions can produce sharp moves. Avoid entering solely because an economic result beats or misses expectations. Wait to see how price reacts.
The scale of the market also matters. BIS data shows global FX turnover averaged $9.5 trillion per day in April 2025, up 27% from 2022, highlighting the depth and liquidity available to traders.
Example of Forex Trading
Suppose the Federal Reserve is expected to maintain tighter policy than the ECB while US yields rise relative to European yields. That creates a fundamental case for a stronger dollar. A trader can then wait for EUR/USD to break below support or retest the broken level before entering.
The key lesson across all three markets is simple: fundamental analysis helps you understand the asset, while technical analysis helps you decide when to act. The right balance depends on the asset, timeframe, and trading objective rather than a fixed percentage split.
Common Mistakes to Avoid
Here are the common mistakes to avoid with both technical and fundamental analysis
Using the Wrong Method for Your Time Horizon
The error: Day traders spending too much time on company fundamentals, while long-term investors react to every short-term chart signal.
Why it fails: Technical analysis focuses mainly on price and volume, while fundamental analysis evaluates economic, industry, and company factors. Using the wrong approach for your timeframe can lead to poor decisions.
The fix:
- Under 1 week: Prioritize technical analysis while staying aware of major news and events.
- 1–6 months: Combine technical and fundamental analysis.
- Over 1 year: Prioritize fundamentals and use technicals mainly to improve entry timing.
Example: An investor buys a stock because its earnings outlook and valuation support long-term growth, then sells two weeks later because a short-term moving average breaks. The problem is not the analysis. It is using a short-term signal to invalidate a long-term thesis.
Ignoring Risk Management
The error: Having a strong trade setup but risking too much capital on it.
Why it fails: Even a high-conviction trade can fail. Oversizing can turn one bad trade into a major portfolio loss. Stop orders can help manage risk, but they do not guarantee execution at the exact stop price, especially in volatile markets.
The fix:
- Set a maximum risk per trade based on your overall strategy and account size.
- Define your exit level before entering.
- Size the position according to the distance between your entry and stop.
Position size = (Account size × Risk per trade) ÷ (Entry price − Stop price)
For example, with a $100,000 account, 2% risk, a $100 entry, and a $95 stop:
$2,000 ÷ $5 = 400 shares
Key lesson: good analysis cannot compensate for poor position sizing.
Paralysis by Analysis
The error: Using dozens of indicators and ratios until every trade produces conflicting signals.
Why it fails: More information does not automatically produce better decisions. Excessive complexity can slow execution and encourage overfitting.
The fix:
- Use 3 to 5 technical tools that serve a clear purpose.
- Track 5 to 8 fundamental metrics that matter to the asset.
- Look for 2 to 3 strong confirmations, rather than waiting for everything to align.
A simple strategy you can apply consistently is usually more useful than a complicated system you rarely execute.
Recency Bias and Chasing Performance
The error: Abandoning your strategy because another approach recently performed better.
Why it fails: Markets move through different conditions. A strategy that works well in a strong trend may struggle in a range-bound market, while value-focused approaches may become more attractive after major sell-offs.
The fix: Test your strategy across different market conditions and evaluate it over a meaningful period before changing it. Do not switch methods simply because another strategy had a better recent run.
Ignoring Asset-Specific Characteristics
The error: Applying the same analysis to stocks, crypto, forex, and commodities.
Why it fails: Different assets have different valuation drivers. Equity analysis can rely heavily on earnings, cash flow, balance sheets, and valuation multiples. Digital assets may require network activity, token economics, adoption, fees, and on-chain data. Forex analysis relies heavily on macroeconomic factors such as interest rates and economic growth.
The fix: Match your toolkit to the asset.
- Stocks: Earnings, cash flow, margins, valuation, and growth
- Crypto: Tokenomics, network activity, adoption, fees, and on-chain metrics
- Forex: Interest rates, inflation, GDP, and central-bank policy
- Commodities: Supply, demand, inventories, and production
For example, a P/E ratio has little relevance when valuing Bitcoin, while network and on-chain metrics can provide more useful information. CFA Institute also cautions that no single crypto valuation model should be used in isolation.
Letting Emotions Override Your Plan
The error: Having a sound strategy but allowing fear, greed, or fear of missing out (FOMO) to change the decision.
Why it fails: Emotional trading often leads to selling winners too early, holding losing positions too long or entering trades without a valid setup.
The fix:
- Define your entry, exit, and risk level before trading.
- Keep a trading journal to identify recurring emotional mistakes.
- Use limit orders and other order types where appropriate to reduce impulsive decisions.
- Do not change the plan simply because the market moves against you.
The rule: If a trade does not meet your predefined criteria, do not take it.
Tools & Resources
The right tools can make market research faster and more systematic. Use charting platforms for technical analysis, research databases for fundamentals, and AI tools to speed up analysis rather than replace your own judgment.
Technical Analysis Tools
Below are some examples of technical analysis tools for trading
TradingView
A leading all-in-one charting platform for stocks, crypto, forex, and other markets. It offers hundreds of indicators, drawing tools, alerts, screeners, and Pine Script for custom indicators and strategies.
Best for: Most traders and investors.
Thinkorswim
A professional-grade platform with advanced scanners, options analysis, charting, paper trading, and strategy tools.
Best for: Active stock and options traders.
MetaTrader ⅘
Widely used for forex and CFD trading, with expert advisors for automated strategies and extensive customization.
Best for: Forex traders and algorithm developers.
Other useful tools
- Finviz: Fast stock screening and market visualization.
- Autochartist: Automated chart and pattern recognition.
- TradingView and broker apps: Useful for mobile charts, watchlists, and price alerts.
Fundamental Analysis Tools
Below are some examples of fundamental analysis tools for trading
Yahoo Finance
Provides financial statements, valuation ratios, earnings data, analyst estimates, and market news.
Best for: Basic fundamental research.
Seeking Alpha
Combines financial data with earnings transcripts, analyst research, and investor commentary.
Best for: Long-term investors who want multiple viewpoints.
Simply Wall St
Turns company fundamentals into easy-to-read visual reports covering valuation, growth, risks, and financial health.
Best for: Visual learners and value investors.
Crypto Fundamental & On-Chain Tools
Messari
Provides crypto research, token data, protocol metrics, and market intelligence.
Best for: Serious crypto research.
Glassnode
Tracks on-chain metrics such as exchange flows, realized profit and loss, long-term holder activity, and market cycles.
Best for: Advanced crypto and on-chain analysis.
DeFiLlama
Tracks DeFi TVL, stablecoins, DEX volumes, fees, yields, and protocol activity across multiple chains.
Best for: DeFi investors and researchers.
Forex & Macro Tools
Forex Factory
Offers an economic calendar, central-bank updates, market news, and event impact ratings.
Best for: Forex traders following economic events.
Trading Economics
Provides economic indicators, historical data, forecasts, and macroeconomic information covering countries worldwide.
Best for: Forex and macro traders.
AI-Powered Analysis Tools in 2026
AI is now useful for speeding up research, screening markets, analyzing documents, and building trading tools. It should support your process, not make decisions for you.
ChatGPT
Can analyze uploaded financial documents and datasets, summarize filings, compare companies, explain financial metrics, and help develop or test trading ideas.
Example prompt: “Analyze Apple’s latest 10-Q and explain whether gross margins are improving.”
TrendSpider
Combines automated technical analysis, chart pattern recognition, multi-timeframe analysis, backtesting, market scanning, and AI assistance. Its Sidekick AI can analyze charts and market data, build custom indicators, create scans, and help test strategies.
Best for: Traders who want to automate technical analysis.
Educational Resources
- Books: Technical Analysis of the Financial Markets by John Murphy; The Intelligent Investor by Benjamin Graham.
- YouTube: The Trading Channel and Rayner Teo for technical analysis; Aswath Damodaran’s NYU lectures for valuation.
- Courses: CME Group Education for free trading and market education, plus reputable technical-analysis courses and the CFA curriculum for deeper fundamental analysis.
Conclusion
The technical vs. fundamental analysis debate is less useful than combining the strengths of both. In 2026, the strongest approach is a hybrid framework: fundamentals help determine what to trade, while technical analysis helps determine when and how to trade.
Fundamentals can assess an asset’s value, growth, financial health, and broader market conditions, while technicals can identify trends, momentum, entries, exits, and risk levels.
The right balance also depends on the asset. Stocks often benefit from deeper fundamental research, crypto demands greater attention to price action, liquidity, and on-chain data, while forex requires close monitoring of macroeconomic factors alongside technical signals.
The goal is not to choose one method, but to combine them into a disciplined strategy that improves decision-making and manages risk.
Frequently Asked Questions
What is the main difference between technical and fundamental analysis?
Technical analysis studies price charts and volume to predict short-term price movement. Fundamental analysis studies financial statements and economic data to estimate an asset’s true value. One focuses on timing, the other on worth.
Which is better for beginners, technical or fundamental analysis?
Most beginners find fundamental analysis more intuitive for stocks, since it’s based on concepts like revenue and profit that don’t require chart-reading experience. That said, technical analysis is often easier to test quickly on a demo account, which makes it a common starting point too. There’s no wrong door in, as long as you eventually learn both.
Can you use technical analysis for long-term investing?
Yes, but as a timing tool rather than the main decision driver. Long-term investors typically use fundamentals to decide what to buy and technicals to decide when to enter, for example, waiting for a pullback to a key support level before adding to a position they already believe in.
Do professional traders use both methods together?
Yes, institutional research desks typically build a valuation model to decide what’s worth owning, then hand execution to a trading desk that uses technical analysis to time the actual entry and exit. Very few professional strategies rely on one method in isolation.