Bollinger Bands are a technical analysis indicator that places two dynamic price bands above and below a simple moving average (SMA), with band width automatically expanding or contracting based on market volatility. Developed by John Bollinger in the 1980s and formally introduced in his 2001 book Bollinger on Bollinger Bands, they remain one of the most widely used indicators in crypto trading as of 2026. The standard configuration uses a 20-period SMA as the center line, with upper and lower bands set two standard deviations away – a range that statistically contains roughly 95% of price action under normal market conditions.
What Are Bollinger Bands and How Do They Work?
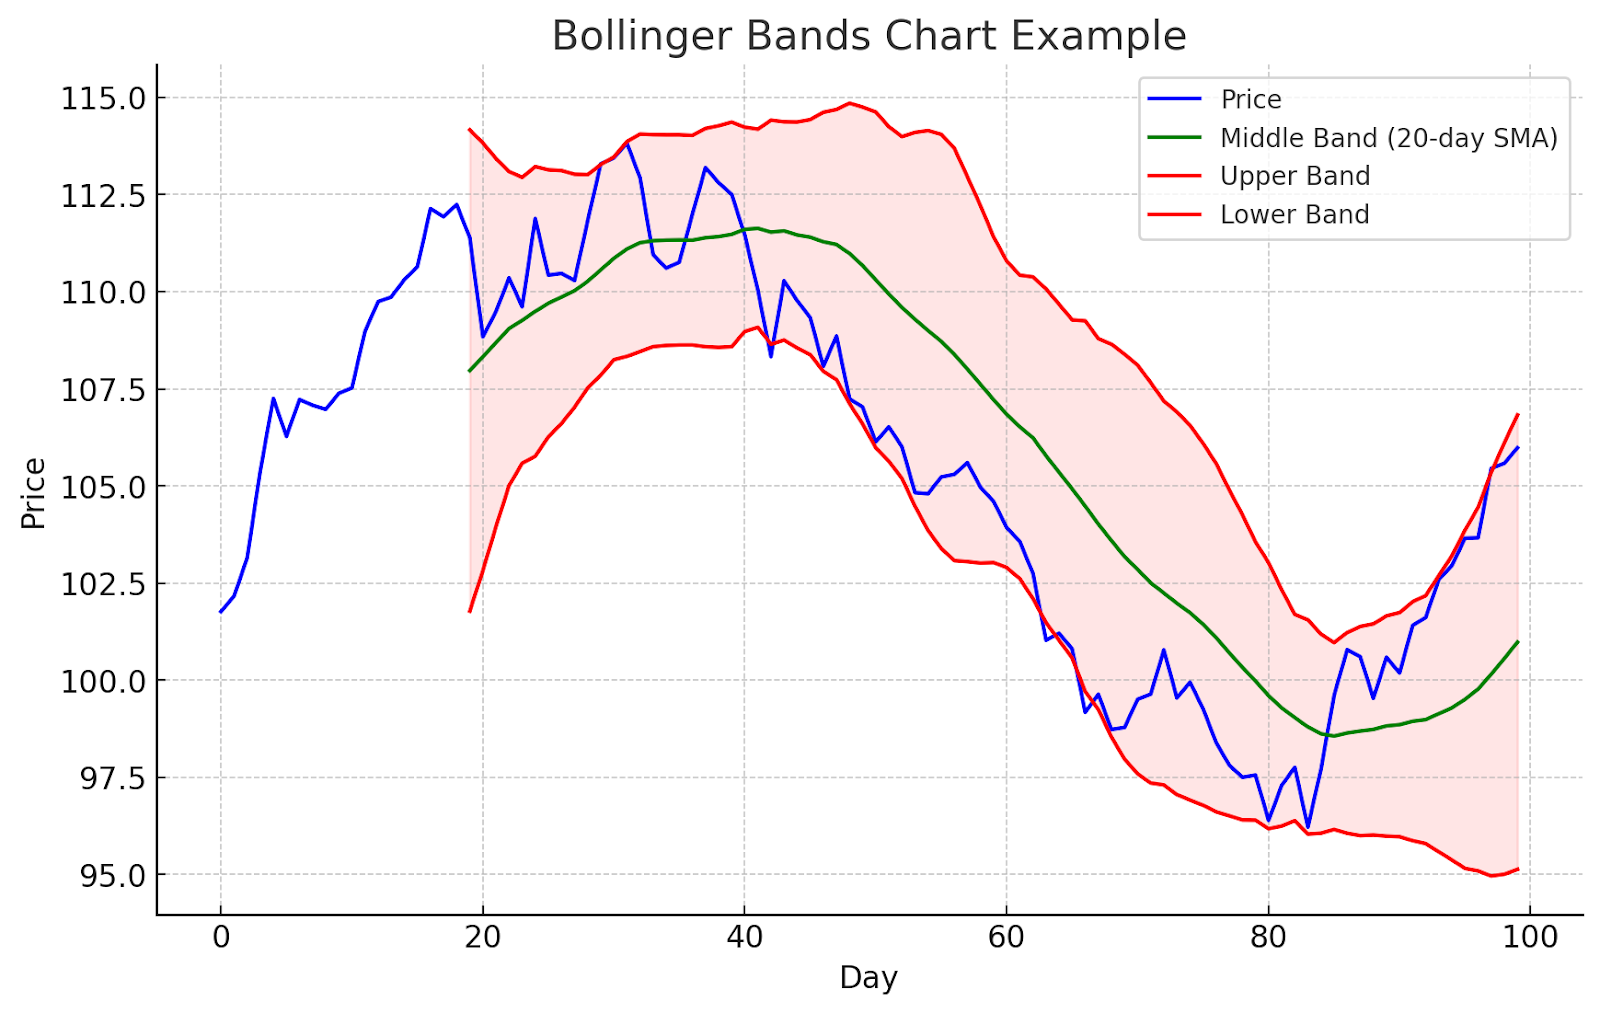
Every Bollinger Band setup has three components: a middle band (the SMA), an upper band, and a lower band. The upper and lower bands are not fixed distances from the center – they stretch and shrink as price volatility rises and falls. When the market is calm and prices move within a tight range, the bands pull close together. When price action becomes erratic, the bands widen to accommodate the larger swings.
The calculation is straightforward:
- Middle Band= Simple Moving Average over N periods (default: 20)
- Upper Band= Middle Band + (K × Standard Deviation of price over N periods)
- Lower Band= Middle Band − (K × Standard Deviation of price over N periods)
The default values are N = 20 periods and K = 2 standard deviations. In crypto markets, these often need adjustment – digital assets trade 24 hours a day, 7 days a week, which changes what “one period” represents compared to traditional stock markets. Because a trading month in crypto is continuous rather than the roughly 20 trading days of equities, some traders shift the default period from 20 to 28 or 30 to better approximate a calendar month of data.
Key Takeaway
- Bollinger Bands act as a gauge for market volatility (band width) and suggest support/resistance zones (upper & lower bands).
- Bollinger Bands can help identify trends (price & band direction) and potential trend shifts (“Bollinger Squeezes”).
- Bollinger Bands can hint at overbought/oversold conditions (price at bands) and offer “Bollinger Bounce” entry opportunities.
- Bollinger Bands require other indicators for confirmation, and their default settings might need adjustments for specific cryptocurrencies.
How Do Crypto Traders Actually Use Bollinger Bands?
Bollinger Bands give traders information on two dimensions simultaneously: where price stands relative to its recent average, and how volatile the market currently is. These two data streams support several distinct strategies.
What Is the Bollinger Bounce Strategy?
Alt text: The chart illustrates the “Bollinger Bounce” strategy, which is based on the idea that prices tend to revert to the middle band in a ranging market. The Price Movements are shown in blue, the Middle Band (SMA) in green, and the Upper and Lower Bands in red. You’ll notice points where the price touches the Upper Band (marked in dark red) and the Lower Band (marked in dark green). According to the Bollinger Bounce strategy, these points are potential signals for trading decisions: a touch on the Upper Band could be interpreted as a sell signal, indicating the price may revert back towards the SMA, while a touch on the Lower Band could be seen as a buy signal, suggesting the price may rise back towards the SMA. This visualization helps traders understand potential entry and exit points in a market that is oscillating between the upper and lower bands of the Bollinger Bands.
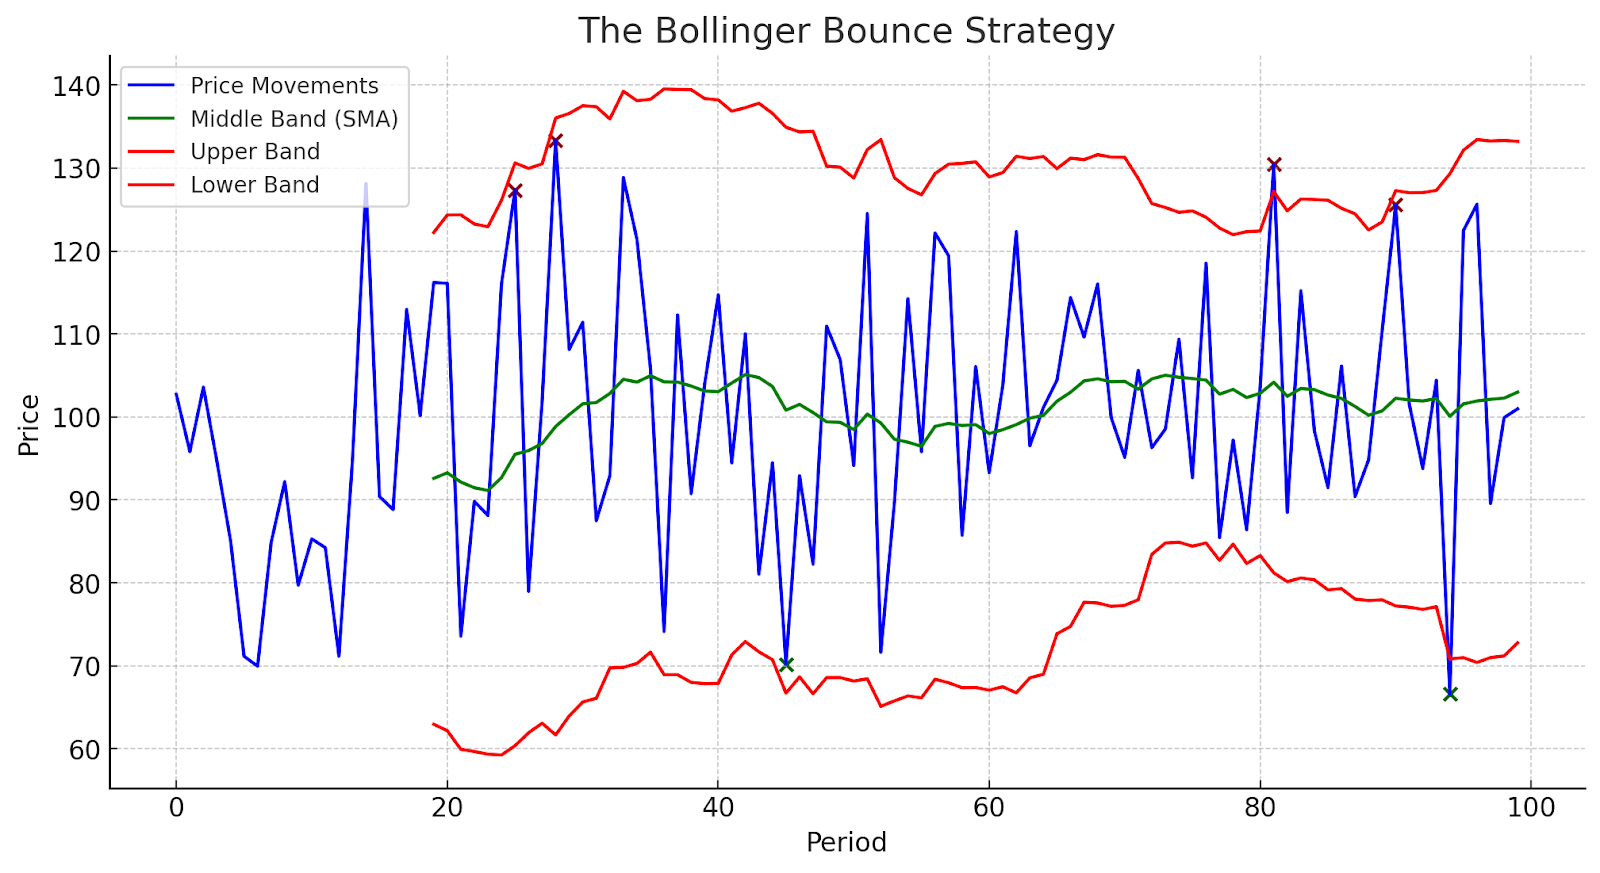
In a ranging, sideways market, prices tend to revert toward the middle band after touching either the upper or lower band. Traders who recognize this pattern buy when price approaches the lower band and sell near the upper band. The key word is “approaches” – a touch of the lower band is not automatically a buy signal, especially in a strong downtrend where prices can ride the lower band for extended periods without reversing.
A reliable Bollinger Bounce setup typically requires a confirming signal alongside the band touch: a bullish candlestick pattern (such as a hammer or engulfing candle), an RSI reading below 30, or a MACD crossover in the same direction. Backtests of the Bollinger Bounce in ranging markets show win rates of approximately 60–65% when confirmation indicators are included, versus 40–50% without them.
Read Also: Crypto Market Analysis: Key Insights for 2026
What Is the Bollinger Squeeze and Why Does It Matter?
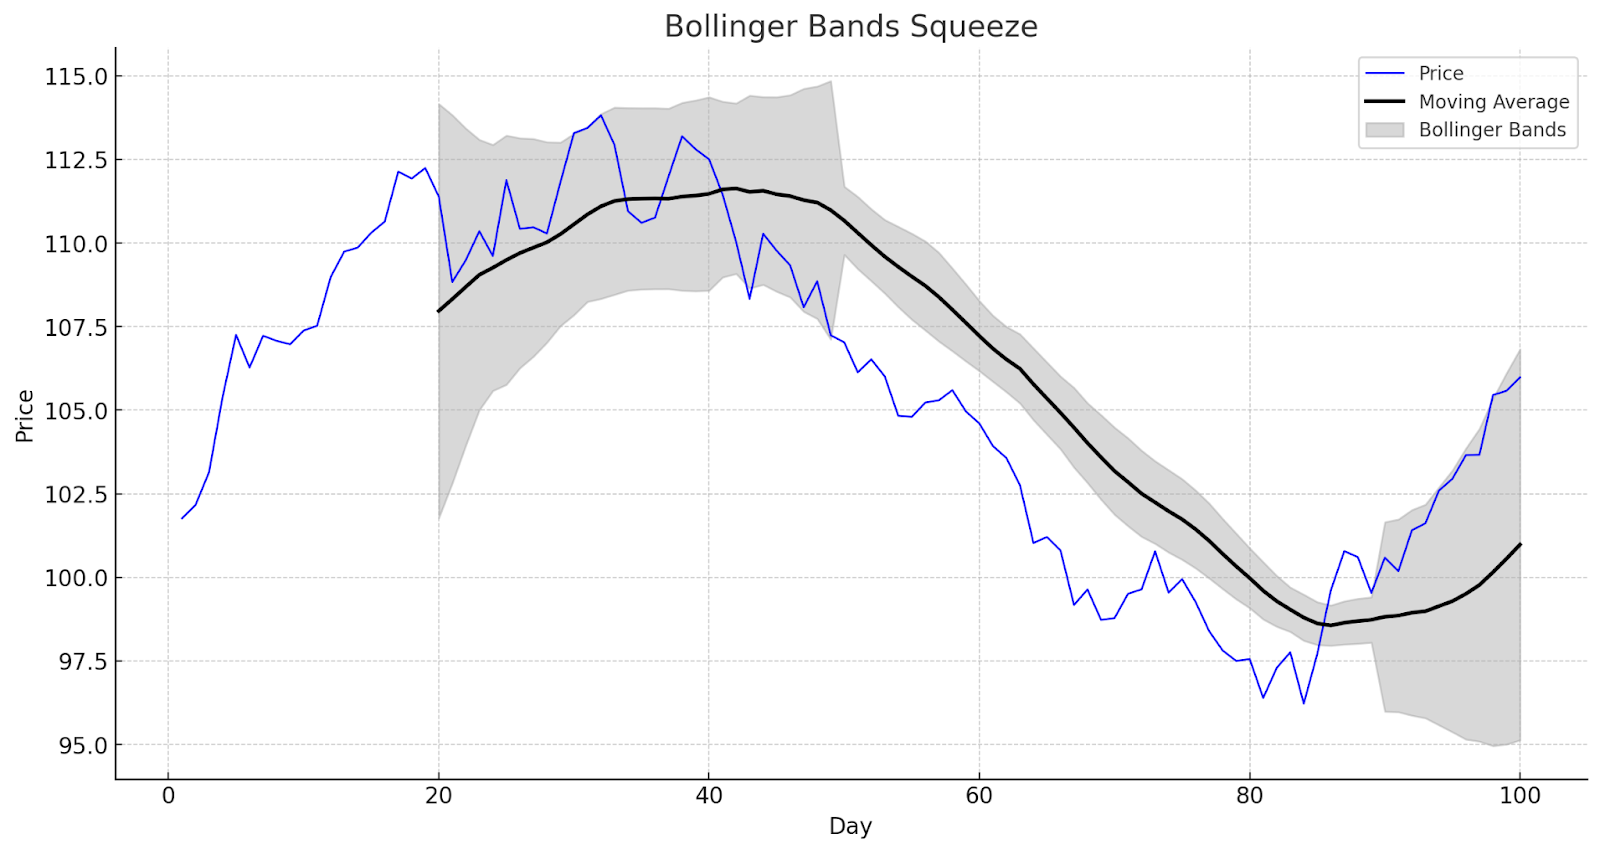
The Bollinger Squeeze happens when the upper and lower bands contract to an unusually narrow range, signaling that volatility has compressed. Low volatility phases tend to precede high volatility phases – the market is coiling before a significant move. Traders watch for squeezes as early warning signs that a breakout is building.
One technique for identifying an especially strong squeeze: overlay Keltner Channels on the same chart. When Bollinger Bands move inside the Keltner Channels entirely, you have an ultra-tight squeeze. When Bollinger Bands expand back outside the Keltner Channels, the breakout that follows tends to have substantial momentum behind it.
The critical limitation: a Bollinger Squeeze tells you a move is coming, not which direction. Confirmation from trend indicators, volume data, or a decisive candle close outside the bands is required before entering a position. On a BTC/USDT 4-hour chart in late 2024, for example, Bitcoin consolidated in a narrow range between $103,695 and $106,635 for multiple candles as bands contracted. When BTC finally closed below the lower band near $103,695, it confirmed the bearish breakout, and price accelerated to roughly $100,627 before stabilizing.
How Do M-Tops and W-Bottoms Signal Reversals?
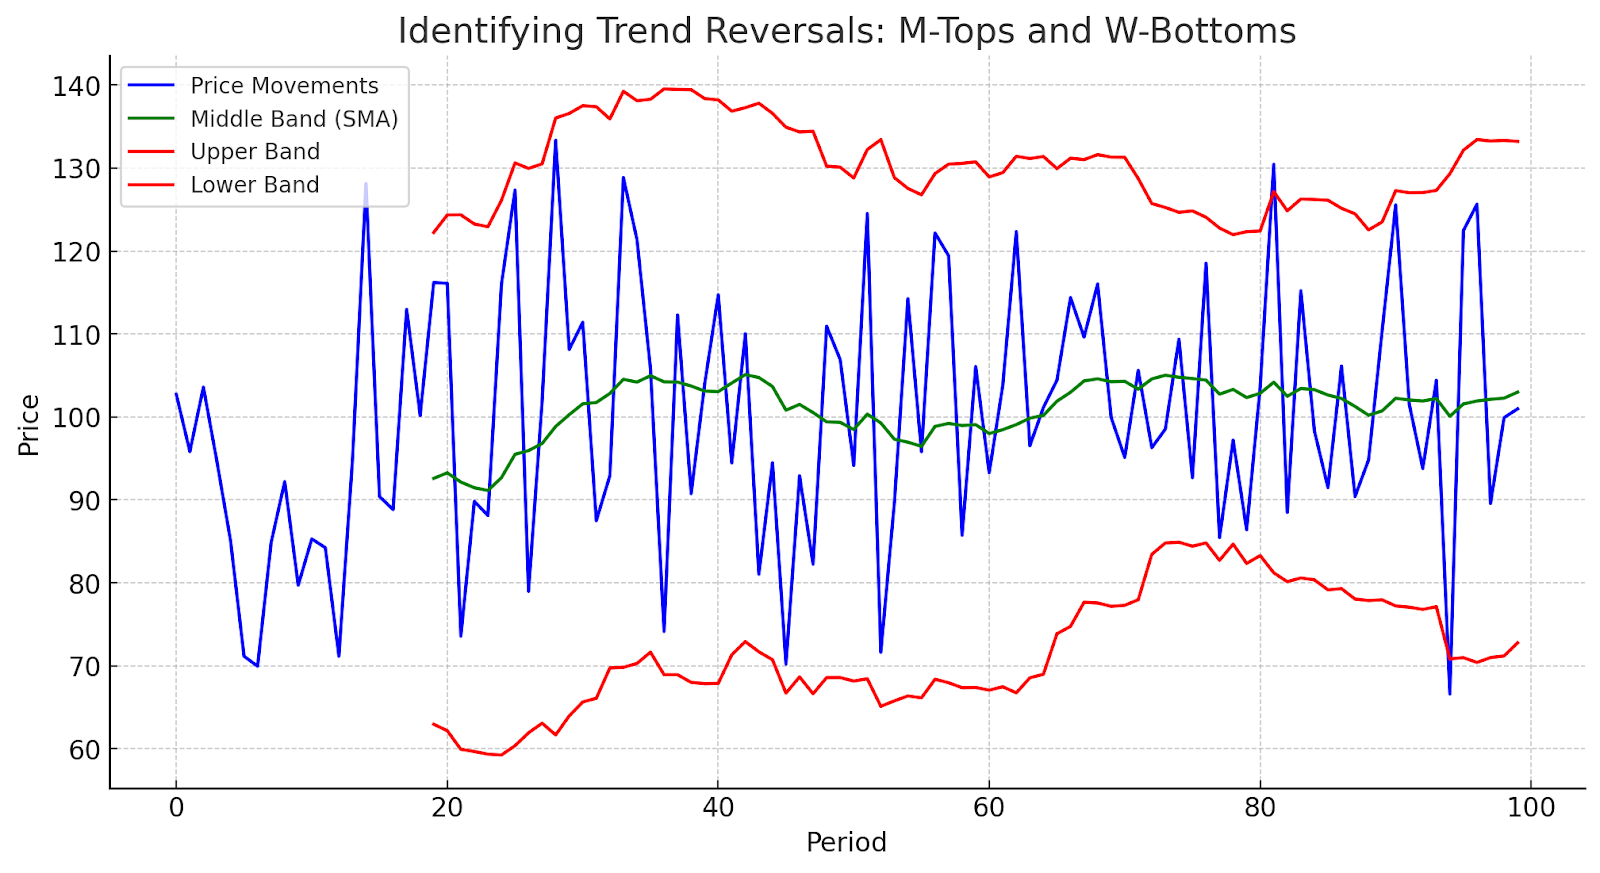
M-Tops and W-Bottoms are pattern-based signals that John Bollinger himself highlighted as among the most reliable setups the indicator produces.
An M-Top forms when price makes a first high near or above the upper band, pulls back to the middle band, then makes a second high that fails to reach the upper band. This lower second peak, despite occurring in an uptrend, suggests weakening buying pressure. A break below the middle band after the second peak confirms the reversal signal.
A W-Bottom is the mirror image: two lows near the lower band where the second low stays above the first, followed by a move above the middle band. The pattern signals that selling pressure is exhausting and a bullish reversal is likely. Both patterns work best on the 4-hour or daily chart, where noise is lower and pattern formation is more meaningful.
How Do Bollinger Bands Perform Compared to Other Indicators?
No single indicator tells the whole story. Bollinger Bands perform best when combined with indicators that measure different aspects of price behavior.
| Indicator | What It Measures | Strongest Use Case | Typical Win Rate (standalone) |
| Bollinger Bands | Volatility + relative price position | Ranging markets, squeeze detection | 40–65% |
| RSI (Relative Strength Index) | Momentum speed and change | Identifying overbought/oversold extremes | 50–60% |
| MACD | Trend direction and momentum | Trending markets, crossover signals | 45–60% |
| Volume | Buying/selling conviction | Confirming breakouts, filtering fakes | N/A (confirmation tool) |
| Bollinger Bands + RSI + MACD | Volatility + momentum + trend | Multi-confirmation setups | ~77–78% |
The win rate data tells the story clearly. Used alone, Bollinger Bands produce win rates ranging from 40% to 65% depending on market conditions – not reliably profitable after fees. Combined with RSI and MACD, backtested win rates in 2026 data reached approximately 77–78%. That improvement is substantial enough to materially change the risk profile of a strategy.
How Should Traders Customize Bollinger Band Settings for Crypto?
The default settings (20 periods, 2 standard deviations) were designed with traditional stock markets in mind. Crypto markets operate differently, and the parameters often need adjustment.
What Period Setting Works Best for Different Trading Styles?
Shorter periods react faster to price changes but generate more false signals. Longer periods produce smoother bands that filter out noise but respond slowly to genuine trend shifts. As of 2026, practitioner recommendations by trading style break down roughly like this:
- Scalpers and day traders:10-period SMA with 1.5 standard deviations – faster signals suited to 15-minute or 1-hour charts
- Swing traders:20-period SMA with 2 standard deviations – the standard setting, appropriate for 4-hour or daily charts
- Position traders:30–50 period SMA with 2–2.5 standard deviations – slower, more deliberate signals suited to weekly chart analysis
Why Do High-Volatility Cryptos Need Wider Bands?
A highly volatile asset like a small-cap altcoin will trigger the upper or lower bands far more often than Bitcoin or Ethereum at the default 2 standard deviation setting. Every band touch becomes a potential signal, and the resulting noise makes it hard to distinguish genuine setups from random fluctuations. Widening the bands to 2.5 or 3 standard deviations for highly volatile assets reduces false triggers while still capturing meaningful extremes.
Ethereum, which is more volatile than Bitcoin over equivalent periods, is a common example where shifting the standard deviation from 2 to 2.5 produces cleaner signals on shorter timeframes without losing the core trading logic.
How Do Traders Combine Bollinger Bands With Other Tools?
How Does the RSI Combination Work in Practice?
RSI measures momentum by comparing recent gains to recent losses on a 0–100 scale. When RSI exceeds 70, the asset is generally considered overbought; below 30, oversold. Combining RSI with Bollinger Bands creates a two-condition filter that rejects weaker signals:
- Strong sell signal: price touches the upper Bollinger Band AND RSI is above 70
- Strong buy signal: price touches the lower Bollinger Band, AND RSI is below 30
Either condition alone is tradeable, but both conditions together in the same candle significantly increase the probability of a genuine reversal. Many traders use a slightly looser filter – RSI above 60 for short entries, RSI below 40 for long entries – to capture more setups without accepting every band touch as a signal.
How Does Volume Confirm Bollinger Band Breakouts?
A price breakout above the upper Bollinger Band on high volume suggests genuine buying pressure behind the move. The same breakout on low volume is suspect – it may be a false breakout that reverses quickly. Volume confirmation is especially important for Bollinger Squeeze breakouts, where the initial direction of the move after a squeeze can be misleading without strong volume backing. If Bitcoin breaks above the upper band on volume well above its 20-day average, that’s a signal worth acting on. A breakout on below-average volume deserves skepticism before any entry.
What Timeframe Should Beginners Start With?
Beginners are better served starting on the 4-hour or daily chart rather than minute-by-minute data. Lower timeframes amplify noise, generate more signals, and leave less time to think through each trade decision. The 4-hour chart provides enough signal frequency to stay engaged while filtering out the most erratic intraday swings. Once a trader has consistent results on that timeframe, moving to shorter charts for specific strategies becomes more manageable.
Paper trading – simulating trades without real money – on the daily chart for 50 to 100 trades before going live is the standard recommendation across most educational resources. The goal is not to prove a strategy is perfect; it’s to understand how it behaves across different market conditions before real capital is at risk.
What Are the Most Common Bollinger Band Mistakes in Crypto Trading?
Understanding the tool includes understanding where it breaks down.
Treating every band touch as a reversal signal is the most frequent error. In a strong trend, prices can ride along the upper or lower band for extended periods without reversing. A band touch is a note of interest, not an automatic trade trigger.
Skipping the middle band check removes a key piece of context. The 20-period SMA is a genuine trend indicator. Price consistently above the middle band signals an uptrend; consistently below signals a downtrend. Many Bollinger Bounce traders ignore the middle band and then take counter-trend trades against a strong directional move.
Trading squeezes without directional confirmation is particularly costly. A squeeze signals compressed volatility, not which direction price will break. Entering a position based on the squeeze alone, without waiting for a confirming candle close outside the bands, is closer to a coin flip than a structured strategy.
Using identical settings across all cryptocurrencies is a subtler mistake. A 20-period, 2 standard deviation setup that works well for Bitcoin on the daily chart may produce poor results on a volatile altcoin on the 1-hour chart. Each asset and timeframe combination needs its own verification through backtesting.
How Do Algorithmic Traders Use Bollinger Bands?
Automated systems apply Bollinger Bands with precision that manual traders cannot consistently replicate. In algorithmic setups, the bands serve several functions:
- Generating automated buy/sell triggers when price crosses band thresholds alongside other defined signal conditions
- Dynamic position sizing – allocating larger positions when bands are narrow (lower volatility, more predictable range) and smaller positions when bands are wide (higher volatility, larger potential drawdowns)
- Adaptive parameter adjustment, where the algorithm modifies the period or standard deviation multiplier based on detected market regime changes
As of 2026, machine learning models trained on multi-indicator datasets – Bollinger Bands alongside RSI, volume, and on-chain metrics – show improved predictive accuracy compared to single-indicator rule-based systems. The improvement comes from the model learning context that static rules cannot encode.
Frequently Asked Questions About Bollinger Bands in Crypto
What do Bollinger Bands tell you about a cryptocurrency’s price?
Bollinger Bands tell you two things simultaneously: where price stands relative to its recent average (high or low relative to history), and how volatile the market currently is (reflected in band width). A price near the upper band suggests the asset is trading high relative to recent history; narrow bands signal a low-volatility period that may precede a significant move. Neither reading is a trade signal on its own – both are context for making better-informed decisions.
Are Bollinger Bands accurate for crypto trading?
Their accuracy depends heavily on how they’re used. Standalone Bollinger Band strategies produce win rates of 40–65% depending on market conditions, which is not reliably profitable after fees. When combined with RSI, MACD, and volume confirmation, backtested win rates in 2026 data reached approximately 77–78%. Bollinger Bands are most accurate as part of a multi-indicator system – the indicator is a starting point, not a complete strategy.
What is the best Bollinger Band setting for Bitcoin?
For Bitcoin on the daily chart, the standard 20-period SMA with 2 standard deviations is widely used and performs reasonably well, given Bitcoin’s relatively lower volatility compared to altcoins. On shorter timeframes like 1-hour or 4-hour charts, shifting to a 20-period SMA with 2.5 standard deviations reduces false signals during Bitcoin’s periodic high-volatility episodes. There is no universal best setting – the right parameters depend on the timeframe, the specific trading strategy, and the volatility profile of the asset being traded.
What is a Bollinger Squeeze in crypto markets?
A Bollinger Squeeze occurs when the upper and lower bands converge to an unusually narrow width, indicating that volatility has dropped significantly. In crypto markets, squeezes frequently precede sharp directional moves in either direction. The squeeze itself gives no indication of which way price will break, so traders wait for a confirming signal – typically a candle closing decisively above or below the bands as they begin to widen – before entering a position. Adding Keltner Channels can help identify the tightest, most actionable squeeze setups.
Can beginners learn to trade using Bollinger Bands?
Yes. Bollinger Bands are visually intuitive and one of the more accessible technical tools for beginners. The concepts of overbought, oversold, and volatility compression are straightforward to grasp. Beginners should start by paper trading on a daily chart, focusing on the Bollinger Bounce strategy in sideways markets where the tool performs most consistently. Live trading with real capital should wait until the strategy shows consistent results over at least 50–100 simulated trades.
How do Bollinger Bands work differently in trending vs. ranging markets?
In ranging markets, price oscillates between the upper and lower bands, making the Bollinger Bounce strategy effective. In trending markets, price rides along one band – the upper band in an uptrend, the lower band in a downtrend – without reversing, which makes Bounce trades risky. The practical rule: check the slope of the middle band. A flat middle band suggests a range; a steeply angled middle band suggests a trend where Bounce trades should be avoided and breakout or trend-following strategies are more appropriate.
Practical Tips for Trading Crypto With Bollinger Bands
- Always check the middle band slope before taking a Bounce trade.If the 20-period SMA is angled sharply up or down, you’re in a trend, not a range. Bounce trades in trending markets carry poor win rates and can result in large losses if price continues riding the band.
- Add RSI as a mandatory filter.Only take long trades at the lower band when RSI is below 40, and only take short trades at the upper band when RSI is above 60. This single rule eliminates a significant portion of false signals without complicating your setup.
- Use band width as a volatility alert.Set a platform alert when band width drops below its 6-month average. This flags potential squeeze setups before they become obvious, giving you time to form a directional thesis before the breakout occurs.
- Backtest on each crypto you plan to trade, not just Bitcoin.Different assets behave differently with the same settings. A parameter set that works well for BTC may produce poor results on a highly speculative altcoin. Most major charting platforms offer built-in backtesting tools at no cost.
- Set stop-losses just beyond the band, not far from it.For long entries near the lower band, a stop-loss placed just below the lower band keeps your maximum loss small if the setup fails. Stops placed too loosely “to avoid noise” defeat the risk management benefit the indicator provides – keep initial risk at 1–2% of position value.
- Confirm squeeze breakouts with volume.Before entering a squeeze breakout trade, verify that the breakout candle is accompanied by volume above its recent average. Low-volume breakouts from squeezes fail far more often than high-volume ones, and this check alone can meaningfully improve your breakout trade results.