Technical analysis in cryptocurrency is the practice of using historical price data, trading volume, and chart patterns to forecast future market movements. Unlike fundamental analysis – which evaluates a project’s underlying value – technical analysis focuses entirely on what the market has already done and what that behavior suggests comes next. Used by retail traders and institutional desks alike, these methods apply across Bitcoin, altcoins, and crypto derivatives markets. As of Q1 2026, the global crypto market capitalization has surpassed $4 trillion, and monthly derivatives trading volume reached $8.94 trillion – a 47.4% year-over-year increase – making chart-reading skills more relevant than ever.
Why Do Crypto Traders Rely on Technical Analysis?
Cryptocurrency markets run 24 hours a day, seven days a week, across hundreds of exchanges simultaneously. That constant activity generates enormous volumes of price data that technical analysis tools are specifically built to interpret. Research published through 2024 and 2026 confirms that combining multiple technical indicators – rather than relying on any single one – improves signal accuracy substantially. Studies show MACD and RSI divergences together successfully predicted approximately 75% of major trend reversals when applied together. This multi-tool approach is the foundation of effective technical analysis in crypto.
What Are the 9 Types of Technical Analysis in Cryptocurrency?
1. What Is Trend Analysis and How Do Traders Use It?
Trend analysis identifies the dominant direction of price movement over a given timeframe. An uptrend shows a series of higher highs and higher lows. A downtrend shows lower highs and lower lows. A sideways market produces neither.
Traders draw trendlines connecting successive price peaks or troughs. When price breaks through a well-established trendline with strong volume, it signals a potential reversal. Moving averages – particularly the 50-day and 200-day – smooth short-term noise and confirm the broader directional bias. The 200-day moving average crossing below the 50-day (a “death cross”) is one of the most-watched bearish signals in crypto markets.
Trend analysis works best on higher timeframes (daily, weekly) where noise is reduced and signals carry more statistical weight. Shorter timeframes produce more signals – but also more false positives.
2. How Do Support and Resistance Levels Guide Trading Decisions?
Support is a price level where buying interest is strong enough to prevent further decline. Resistance is a level where selling pressure caps upward movement. These zones form because traders remember past price reactions and respond similarly when price returns to those levels.
Once a support level breaks convincingly, it frequently becomes new resistance – and vice versa. This “polarity flip” gives traders reliable reference points for entries and stop-losses. In 2026, Bitcoin’s $60,000 and $50,000 levels acted as major psychological support zones during broader market corrections, drawing institutional buying interest each time price tested them.
Key support and resistance zones come from:
- Previous swing highs and lows
- Round number price levels ($10,000, $50,000, $100,000)
- High-volume price nodes from volume profile analysis
- Fibonacci retracement levels
3. What Are Chart Patterns and What Do They Predict?
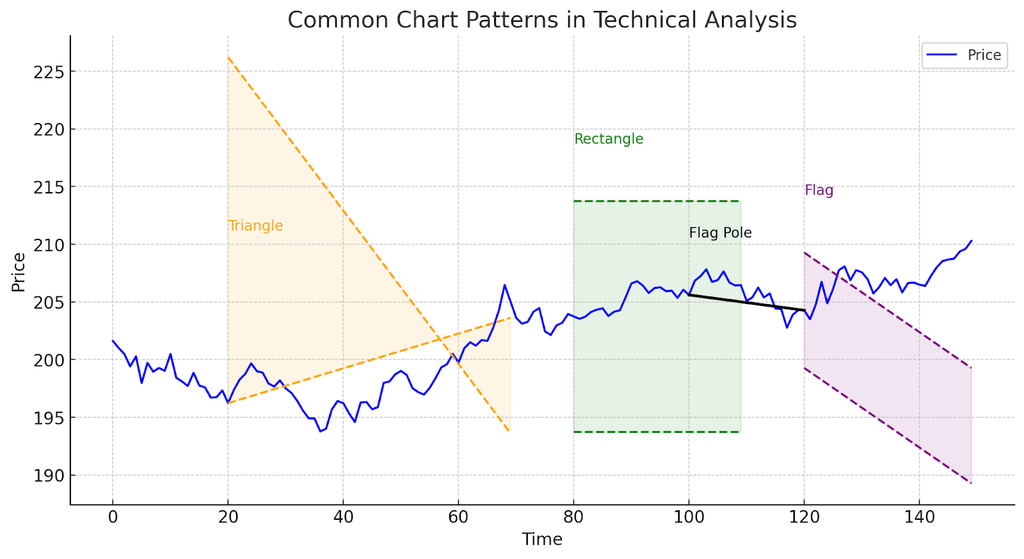
Chart patterns are recurring geometric shapes formed by price action that carry predictive implications based on market psychology. They fall into two categories: continuation patterns (suggesting the existing trend will resume) and reversal patterns (suggesting a change is coming).
| Pattern | Type | Signal | Target Method |
| Head and Shoulders | Reversal | Bearish | Head-to-neckline height projected downward |
| Inverse Head and Shoulders | Reversal | Bullish | Head-to-neckline height projected upward |
| Ascending Triangle | Continuation | Bullish | Base width projected from breakout point |
| Descending Triangle | Continuation | Bearish | Base width projected from breakdown point |
| Bull Flag | Continuation | Bullish | Flagpole length projected from breakout |
| Double Top | Reversal | Bearish | Distance from tops to neckline projected down |
| Cup and Handle | Continuation | Bullish | Cup depth projected upward from breakout |
Chart patterns are most reliable on higher timeframes (4-hour, daily, weekly) and when breakouts are accompanied by above-average volume.
4. How Do Technical Indicators Help Filter Market Noise?
Technical indicators are mathematical calculations applied to price and volume data to extract signals from noisy markets. They fall into four broad categories: trend-following, momentum, volatility, and volume indicators.
The most widely used in crypto include:
- Moving Average Convergence Divergence (MACD)- measures momentum and trend direction by comparing two exponential moving averages. A bullish crossover (MACD line crossing above the signal line) is one of the most-followed buy signals in crypto.
- Relative Strength Index (RSI)- a momentum oscillator on a 0–100 scale that flags overbought conditions above 70 and oversold conditions below 30.
- Bollinger Bands- volatility bands placed above and below a moving average that expand during turbulent periods and contract during quiet ones.
- Average Directional Index (ADX)- measures the strength (not direction) of a trend. Readings above 25 suggest a strong trend is underway.
No indicator generates reliable signals in isolation. Confirmation from two or more independent tools cuts false positives substantially.
5. What Does the Stochastic Oscillator Measure?
The Stochastic Oscillator is a momentum indicator that compares a cryptocurrency’s closing price to its price range over a specified period – typically 14 periods. It produces two lines: %K (the main line) and %D (a 3-period moving average of %K), both plotted on a 0–100 scale.
Readings above 80 indicate overbought conditions; readings below 20 indicate oversold conditions. The most actionable signal is a crossover between %K and %D while in extreme territory. A %K crossing above %D below 20 is a buy signal; a %K crossing below %D above 80 is a sell signal.
In trending markets the Stochastic Oscillator can stay in overbought or oversold territory for extended periods – making it more useful in ranging markets than in strong directional moves. Traders commonly apply a “slow stochastic” setting of (14, 3, 3) to reduce noise.
6. How Do Candlestick Patterns Reveal Market Psychology?
Candlestick charting originated in 18th-century Japan, where rice traders used it to track market sentiment. Each candle represents a defined time period and shows four data points: open, close, period high, and period low. The candle body (open to close) is colored to distinguish bullish periods (green) from bearish ones (red).
Key single-candle patterns:
- Doji- open and close are nearly equal, signaling indecision and a potential reversal
- Hammer- small body with a long lower wick appearing after a decline; signals bullish reversal
- Shooting Star- small body with a long upper wick appearing after an advance; signals bearish reversal
- Marubozu- full-bodied candle with no wicks; signals strong directional conviction
Multi-candle formations include the Engulfing pattern (a large candle completely engulfing the prior candle’s body), the Morning Star (three-candle bullish reversal), and the Evening Star (three-candle bearish reversal). These carry the most weight when they form at established support or resistance zones, not in the middle of a range.
7. Why Does Volume Analysis Matter in Crypto Technical Analysis?
Volume is the number of units traded during a given period. It is the most direct measure of market participation and conviction. Price moves backed by high volume are considered more significant and more likely to sustain than low-volume moves of the same magnitude.
Core volume principles traders apply:
- A breakout above resistance on rising volume confirms the move
- A breakout on declining volume is suspect and often fails quickly
- Price falling on shrinking volume during a downtrend suggests selling pressure is exhausting
- Volume spikes at market extremes – price peaks or troughs – often mark turning points
In Q1 2026, Bitcoin’s volume profile showed a pattern that technical analysts tracked in real time: periods of range compression on declining volume, followed by volume-spike breakouts – a classic accumulation-then-expansion sequence visible across major exchanges.
8. How Is Fibonacci Retracement Applied to Crypto Price Charts?
Fibonacci retracement uses ratios derived from the Fibonacci sequence – 23.6%, 38.2%, 50%, 61.8%, and 78.6% – to identify potential support and resistance within a price pullback. The 61.8% level (the “golden ratio”) is regarded as the most significant.
To apply the tool, a trader identifies a significant swing low and swing high (or high to low in a downtrend) and plots it across that range. Price frequently stalls, reverses, or accelerates at these levels because large numbers of market participants place orders there, creating a degree of self-fulfilling behavior.
The 61.8% retracement level has demonstrated consistent relevance in Bitcoin’s price history. During multiple bull market corrections between 2020 and 2026, BTC held or bounced near this level before resuming higher. Pairing Fibonacci levels with candlestick reversal signals or oscillator readings at those same levels tightens entry timing considerably.
9. What Is Elliott Wave Theory and How Does It Work?
Elliott Wave Theory, developed by Ralph Nelson Elliott in the 1930s, proposes that market prices move in predictable, repeating wave patterns driven by crowd psychology. The core structure consists of five impulse waves (moving with the main trend) followed by three corrective waves (moving against it), labeled with numbers (1–5) and letters (A-B-C) respectively.
Each wave contains its own smaller wave patterns – a fractal quality that applies across all timeframes simultaneously. Wave 3 is typically the longest and strongest impulse wave; Wave 5 often shows divergence with momentum indicators like RSI, signaling the move is losing steam even as price makes new highs.
In practice, Elliott Wave is most effective when combined with RSI, MACD, and volume to confirm wave counts. As of 2026, institutional crypto desks use Elliott Wave as a macro positioning framework – identifying where a market sits within a larger impulse or corrective cycle – rather than as a precise entry-timing tool.
Related: Top Crypto Technical Analysis Tools for Beginners
Technical Analysis vs. Fundamental Analysis: What Is the Difference?
| Factor | Technical Analysis | Fundamental Analysis |
| Focus | Price action, volume, chart patterns | Project value, team, tokenomics, adoption |
| Time horizon | Minutes to weeks | Months to years |
| Primary tools | RSI, MACD, trendlines, Fibonacci | Whitepaper, on-chain metrics, revenue |
| Works best for | Short- to medium-term trading entries | Long-term investment decisions |
| Weakness | Cannot predict news-driven shocks | Cannot time entries and exits precisely |
| Used by | Day traders, swing traders | Investors, funds, long-term holders |
Many professional crypto traders use both in combination: fundamental analysis selects which asset to trade, while technical analysis determines when and at what price to enter or exit.
How Should Traders Combine These Nine Approaches?
The nine types of technical analysis covered above are not competing methods – they are complementary tools that address different aspects of price behavior. Trend analysis identifies direction. Support and resistance define key price zones. Chart patterns signal potential moves. Indicators measure momentum. Volume confirms conviction. Candlesticks reveal psychology. Fibonacci and Elliott Wave provide structural frameworks.
A practical multi-tool workflow: identify the trend on the daily chart, locate key support and resistance zones, look for a candlestick reversal pattern at a Fibonacci retracement level inside that zone, confirm with RSI and volume, then execute on the 4-hour chart. Each tool confirms or invalidates what the others suggest.
As of 2026, moving average crossovers combined with RSI and MACD volume confirmation successfully predicted approximately 70% of major price movements in backtesting studies – well above any single indicator in isolation.
What Are the Limitations of Technical Analysis in Crypto?
Technical analysis has real limitations that every trader should understand before committing capital. Cryptocurrency markets are especially prone to sudden, large moves driven by regulatory announcements, exchange hacks, macroeconomic data releases, or whale activity – events that do not appear on a price chart until after they happen.
Key limitations to keep in mind:
- Technical signals are based on historical data and carry no guarantee about future behavior
- Crypto assets can sustain RSI readings above 70 for weeks during strong bull markets, making overbought signals unreliable in isolation
- Low-liquidity altcoins are easily manipulated, making chart patterns on them less dependable than those on Bitcoin or Ethereum
- Conflicting signals across timeframes are common and require judgment calls that pure indicator logic cannot resolve
- No technical setup has a 100% success rate – position sizing and stop-losses are what determine long-term profitability, not win rate alone
Practical Tips for Applying Technical Analysis to Crypto Trading
- Start with the higher timeframe.Identify the dominant trend on the weekly or daily chart before zooming into the 4-hour or 1-hour for entries. Trading against the higher-timeframe trend substantially lowers your probability of success – the most common beginner mistake.
- Require confluence before entering.Wait for at least two independent signals to align – for example, a Fibonacci retracement level coinciding with a prior support zone and a bullish RSI divergence. One signal alone is rarely enough.
- Use volume as your truth detector.Any price break – out of a range, through resistance, or from a chart pattern – is more trustworthy when volume expands on the move. Low-volume breakouts fail at a high rate in crypto markets.
- Keep a trading journal.Record which setups and indicator combinations work best for your specific timeframe and asset class. Markets change, and your records will tell you when your approach needs adjusting.
- Define your stop-loss before your entry.Knowing where your analysis is invalidated before you open the trade removes emotional decision-making when the position moves against you.
- Backtest new indicator combinationson historical data before risking live capital. A setup that looks compelling on a handful of recent charts may not hold up across different market conditions or volatility regimes.
- Track on-chain data alongside chart signals.Metrics like exchange inflows, whale wallet activity, and open interest often confirm or contradict what price charts suggest – particularly useful when a technical breakout lacks on-chain backing.
FAQ
Q1: Which type of technical analysis is best for beginners?
Trend analysis and support/resistance identification are the best starting points. These two approaches build the foundational skill of reading price structure – understanding where a market has been and identifying zones where price has repeatedly reacted. Once those concepts are solid, adding RSI and volume analysis provides confirmation signals without overwhelming complexity.
Q2: Can technical analysis predict crypto prices accurately?
Technical analysis cannot predict prices with certainty – it identifies statistical probabilities based on historical patterns. A well-constructed setup might carry a 60–70% historical success rate, but every individual trade still carries the possibility of being a loser. Risk management through position sizing, stop-losses, and daily loss limits is what lets traders survive losing streaks and remain profitable over time.
Q3: How many indicators should a crypto trader use at once?
Most professional traders use two to four indicators simultaneously, chosen from different categories: one trend-following, one momentum, one volume-based. Using too many creates conflicting readings. More indicators do not produce more accuracy – they typically produce more confusion and slower decision-making.
Q4: Is Fibonacci retracement reliable in crypto markets?
Fibonacci retracement levels carry self-fulfilling properties because a large number of traders watch the same levels and place orders at them. The 61.8% and 38.2% levels have shown consistent relevance in Bitcoin’s price history across multiple market cycles from 2020 through 2026. They are most reliable when they align with other technical factors – prior support/resistance, volume nodes, or candlestick reversal signals.
Q5: Does Elliott Wave Theory work in cryptocurrency markets?
Elliott Wave Theory applies to crypto but requires considerable practice to use accurately. Wave counts are subjective – two experienced analysts often arrive at different counts on the same chart. The theory is most useful as a macro framework for understanding where a market sits within a larger cycle. Most practitioners use it alongside RSI, MACD, and volume rather than as a standalone predictive system.
Q6: What is the difference between leading and lagging indicators?
Leading indicators attempt to forecast future price movements before they occur – the Stochastic Oscillator and RSI are examples. Lagging indicators confirm trends that have already begun – moving averages and MACD fall here. A practical approach combines both: use a lagging indicator to confirm trend direction, then use a leading oscillator to time entries at favorable risk-reward points within that established trend.