WordPress database error: [You have an error in your SQL syntax; check the manual that corresponds to your MariaDB server version for the right syntax to use near '' at line 1]SELECT * FROM wp_mica_ecta WHERE cta_id =
WordPress database error: [You have an error in your SQL syntax; check the manual that corresponds to your MariaDB server version for the right syntax to use near '' at line 1]SELECT * FROM wp_mica_ecta WHERE cta_id =
WordPress database error: [You have an error in your SQL syntax; check the manual that corresponds to your MariaDB server version for the right syntax to use near '' at line 1]SELECT * FROM wp_mica_ecta WHERE cta_id =
WordPress database error: [You have an error in your SQL syntax; check the manual that corresponds to your MariaDB server version for the right syntax to use near '' at line 1]SELECT * FROM wp_mica_ecta WHERE cta_id =
WordPress database error: [You have an error in your SQL syntax; check the manual that corresponds to your MariaDB server version for the right syntax to use near '' at line 1]SELECT * FROM wp_mica_ecta WHERE cta_id =
WordPress database error: [You have an error in your SQL syntax; check the manual that corresponds to your MariaDB server version for the right syntax to use near '' at line 1]SELECT * FROM wp_mica_ecta WHERE cta_id =
On October 10, 2025, crypto markets experienced their largest liquidation event on record, with over $19 billion in leveraged positions wiped out and about 1.6 million traders affected within 24 hours.
The sell-off followed fresh U.S. tariff announcements, sending Bitcoin sharply lower from its record highs while volatility surged across financial markets. Events like these highlight why every trader needs a solid volatility plan. Success during turbulent markets depends less on predicting crashes and more on disciplined risk management, position sizing, and emotional control.
This guide explains how to identify volatile market conditions, apply practical trading strategies across different asset classes, and develop the psychological discipline needed to protect your capital when markets become unpredictable.
There's no Call To Action with the ID #0.Key Takeaways
- Position sizing decides who survives. Risking 1-2% per trade got people through the October 2025 crash. Risking 5%+ wiped accounts out, no matter how good the trade idea was.
- Match your strategy to the volatility regime. Quiet markets reward range trading. Rising volatility rewards breakouts and trends. Extreme volatility rewards mean reversion, options, or simply standing aside.
- Stops need more room during volatility. A stop that works in a calm market will get you kicked out of a good trade during a volatile one. Widen it to 2-3 times the average true range (ATR).
- Options cap your downside. During true chaos, options buyers know their maximum loss ahead of time. Traders holding leveraged spot or futures positions do not.
- Discipline beats talent. A 24-hour cooldown after a bad loss, a daily loss limit, and a short pre-trade checklist stop more damage than any indicator ever will.
What Is High Volatility Trading?
Trading during high volatility means adjusting your strategy, position size, and stop-loss placement to match price swings that are much bigger than normal. Big swings create bigger profit potential and bigger risk at the same time. Spreads widen, prices slip past your intended entry or exit, and moves that used to take a week can happen in an hour.
Traders who do this well use smaller positions, wider stops, and strategies built for fast markets, like breakout trading, options, or short-term mean reversion. Common warning signs include the VIX moving above 20, the ATR expanding well past its recent average, and Bollinger Bands stretching wider than usual.
How Volatility Gets Measured
You can’t manage what you don’t measure. Here are the four tools traders actually use:
VIX (S&P 500 volatility index)
Below 15 is calm, 15-20 is normal, 20-30 is elevated, and 30-40 is high stress. Above 40 is a full-blown panic. You can check the current and historical VIX directly through CBOE’s official VIX data page or pull long-run history from FRED, the Federal Reserve’s economic data service.
Bitcoin Volatility Index (BVIV)
This is crypto’s version of the VIX. It stayed above 50% through much of late 2025, even after the VIX had calmed back down, because traders were still pricing in the risk of forced exchange liquidations.
ATR (Average True Range)
This tool tells you how much a specific asset actually moves, in dollars or points, on an average day. Rising ATR means rising volatility for that asset specifically.
Bollinger Bandwidth
These bands stretch apart when volatility increases and squeeze together when the market goes quiet. A sudden widening is often your earliest visual warning.
Where Volatility Comes From
Not all volatility behaves the same way, and knowing the source helps you pick the right response.
- News shocks: Tariff announcements, surprise Fed decisions, and regulatory news can move a market instantly. October 2025 is the textbook example.
- Technical volatility: Price breaks out of a long consolidation or hits a cluster of stop-losses, and the move feeds on itself.
- Thin liquidity: Crypto weekends, holiday sessions in stocks, and after-hours trading all amplify moves because there are fewer buyers and sellers to absorb them.
- Automated selling: Algorithmic trading and automatic deleveraging systems on exchanges can turn a normal drop into a cascade, which is exactly what happened on Binance and other exchanges in October 2025.
Why Volatility Is Not Just a Threat
It’s easy to only see the danger, but volatility is also where the money moves. Bigger swings mean bigger potential profit per trade. Volume increases, so it’s often easier to get in and out of positions.
Options premiums expand, which is good news if you’re selling them. And overshoots- prices moving further than the fundamentals justify- create some of the best mean-reversion setups you’ll see all year.
“The traders who did best in October 2025 weren’t the ones who avoided the crash. They were the ones who had already decided, days before it happened, exactly how much they were willing to lose on any single trade.”
Inside the $19 Billion Crash: What October 2025 Actually Taught Traders
Understanding this event matters because it compressed years of risk-management lessons into about 48 hours.
How It Unfolded
After months of trading sideways, Bitcoin surged to a new all-time high of around $126,000 in early October 2025 during the rally dubbed “Uptober.” However, optimism quickly faded on October 10 when President Trump announced plans for 100% tariffs on Chinese imports, triggering a sharp sell-off across global markets.
Crypto was hit especially hard because it trades around the clock without circuit breakers. Within 24 hours, over $19 billion in leveraged futures positions were liquidated, and open interest plunged by more than 40%. Bitcoin fell to the $102,000–$106,000 range, Ether dropped below $4,000, and many altcoins lost 40–80% of their value. Stocks also declined, with the VIX jumping into the high 20s as tariff uncertainty rattled investors.
What Actually Went Wrong
A few things combined to turn a bad news day into a historic wipeout:
- Extreme leverage going into the move: Traders were heavily positioned long, betting the rally would continue, right before the shock hit.
- Thin real liquidity behind the headline price: A price near $126,000 looked stable, but it didn’t take much real selling to move it sharply because order books were thinner than they appeared.
- Automated deleveraging: As exchanges’ insurance funds came under pressure, some began automatically closing out profitable positions to stay solvent, which added even more selling into an already falling market.
- A feedback loop: Each round of forced liquidations pushed prices lower, which triggered the next round of liquidations, and so on.
- Broken diversification: Around 97% of the top 100 altcoins fell together. Holding a spread of different coins offered almost no protection, because everything was correlated to the same panic.
In the aftermath, Binance acknowledged technical issues that worsened losses for some users and paid out roughly $283 million in initial reimbursements.
Days later, the exchange announced a further $300 million compensation package in token vouchers plus a $100 million low-interest loan fund for institutions, an initiative it branded “Together,” according to reporting from Bloomberg.
It’s one of the largest voluntary compensation efforts an exchange has ever made, and it says a lot about how disruptive the event actually was.
There's no Call To Action with the ID #0.The Lessons That Should Change How You Trade
1. Position sizing is the difference between a bad day and a blown account: Traders risking 1-2% per trade lost money that day, but they had capital left to keep trading. Traders risking 5-10% or using high leverage were often liquidated completely, regardless of whether their long-term thesis on Bitcoin was right.
2. “It won’t happen to me” is not a risk plan: Volatility spikes don’t announce themselves days in advance. The move from calm to chaos took less than an hour.
3. Stops can fail you in fast markets: Some traders reported their stop-loss orders executing 5-10% away from where they were set, simply because the market moved faster than the order book could keep up.
4. Correlation disappears exactly when you need it most: “I’m diversified across ten coins” meant very little when all ten fell together.
5. Prepared traders made real money: Those holding cash bought the dip near the lows and rode the bounce. Traders who longed volatility through options, rather than shorting it, saw some of their best returns of the year.
This wasn’t really a story about Bitcoin. It was a story about leverage, thin liquidity, and what happens when thousands of traders are positioned the same way at the same time.
Understanding Volatility Regimes Before You Trade
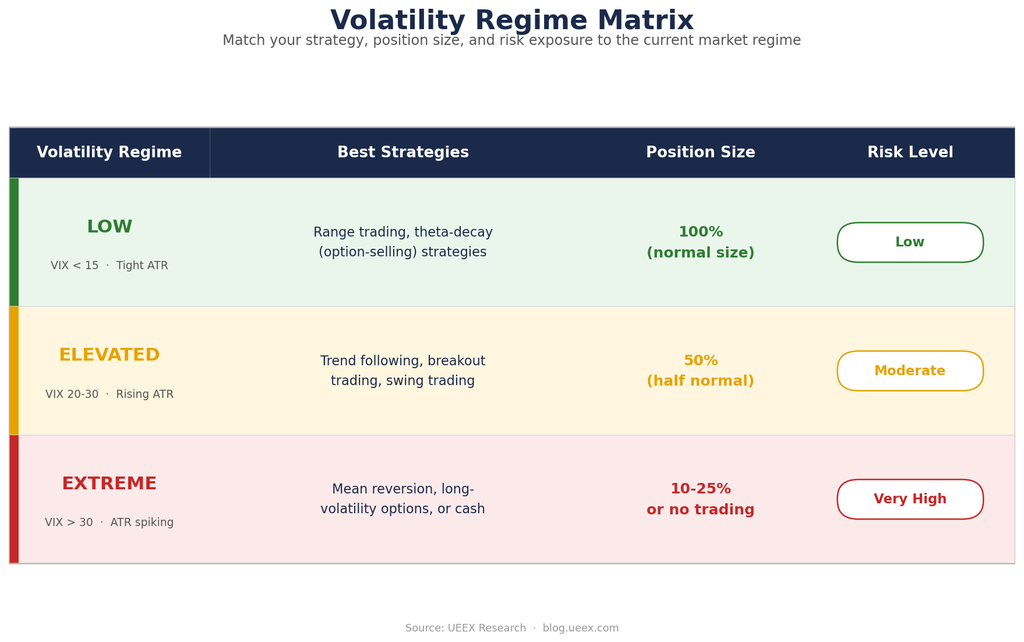
Before picking a strategy, you need to know what kind of market you’re actually in. Traders who ignore this step tend to use the wrong tool at the wrong time, like trying to range-trade a market that’s trending hard or trend-following a market that’s about to snap back.
Regime 1: Low Volatility
VIX under 15, tight ATR, narrow trading ranges. This describes Bitcoin’s summer 2025 consolidation between roughly $107,000 and $126,000 before the crash. In this regime, range trading and options-selling strategies that profit from time decay tend to work best. Breakout trading is risky here because false breakouts are common, and there usually isn’t a strong trend to follow.
Regime 2: Normal to Elevated Volatility
VIX in the 20-30 range, with clearer trends forming and increased volume. This is generally the most profitable regime for active traders, because it offers real trends and real breakouts without the chaos of extreme conditions. Trend following, swing trading, and breakout strategies all have room to work here.
Regime 3: Extreme Volatility
VIX above 30, or a crypto market experiencing something like October 2025. Expect gapping prices, failed breakouts, and highly emotional swings in both directions. This is where mean reversion, short-term scalping, and long-volatility options tend to outperform. Most traders should shrink their position size drastically here or simply step aside and watch.
A Quick Regime Checklist
Before placing a trade, run through this:
- Where is the VIX, and is it rising or falling?
- Is the ATR for this asset well above its normal average?
- Are the Bollinger Bands unusually wide?
- Is there a major news event on the calendar (Fed meeting, earnings, geopolitical news)?
- What is sentiment doing (Fear & Greed Index, put/call ratio)?
The most dangerous moment is the transition itself, when a market flips from calm to extreme. That’s exactly what happened on October 10, 2025. A single-day jump of 20% or more in the VIX, or a sudden doubling of ATR, is your signal to cut position size immediately, before you fully understand why the move is happening.
For a deeper walkthrough of building a personal risk framework around these regimes, our Risk Management Essentials guide breaks the process down step by step.
Strategy 1: Position Sizing Is What Actually Saves Your Account
If you only take one thing from this article, take this section
Why Position Sizing Matters Most
October 2025 proved something simple: position sizing determines whether you survive a crash, not whether you correctly predicted it.
Traders risking 1% per trade came through the $19 billion liquidation event with most of their capital intact. Traders risking 5-10% per trade were wiped out, even in cases where the market eventually moved back in their favor.
There's no Call To Action with the ID #0.Position sizing determines how long you survive in volatile markets:
- Conservative (0.5–1%): Survives 100+ consecutive losses
- Moderate (1–2%): Survives 50+ consecutive losses
- Aggressive (2–3%): Survives only 33 losses; high risk of ruin
The ATR Position Sizing Formula: Position Size = Account Risk Amount ÷ Stop Distance (in dollars)
Example:
- Account size: $100,000
- Risk per trade: 1% = $1,000
- Bitcoin’s ATR during high volatility: roughly $4,000
- Stop distance: 2x ATR = $8,000
- Position size: $1,000 ÷ $8,000 = 0.125 BTC (about $14,000 notional at $115,000/BTC)
How to Adjust Sizing as Volatility Rises
| Volatility Regime | Risk Per Trade | Stop Distance | Position Size vs Normal |
| Low (VIX under 15) | 1-2% | 1-1.5x ATR | 100% (normal) |
| Normal (VIX 15-20) | 1-1.5% | 1.5-2x ATR | 80% (slightly reduced) |
| Elevated (VIX 20-30) | 0.5-1% | 2-2.5x ATR | 50% (half normal) |
| High (VIX 30-40) | 0.25-0.5% | 2.5-3x ATR | 25% (quarter normal) |
| Extreme (VIX above 40) | Under 0.25% or none | 3x+ ATR | 10% or cash (Minimal) |
Drawdown-Based Throttling
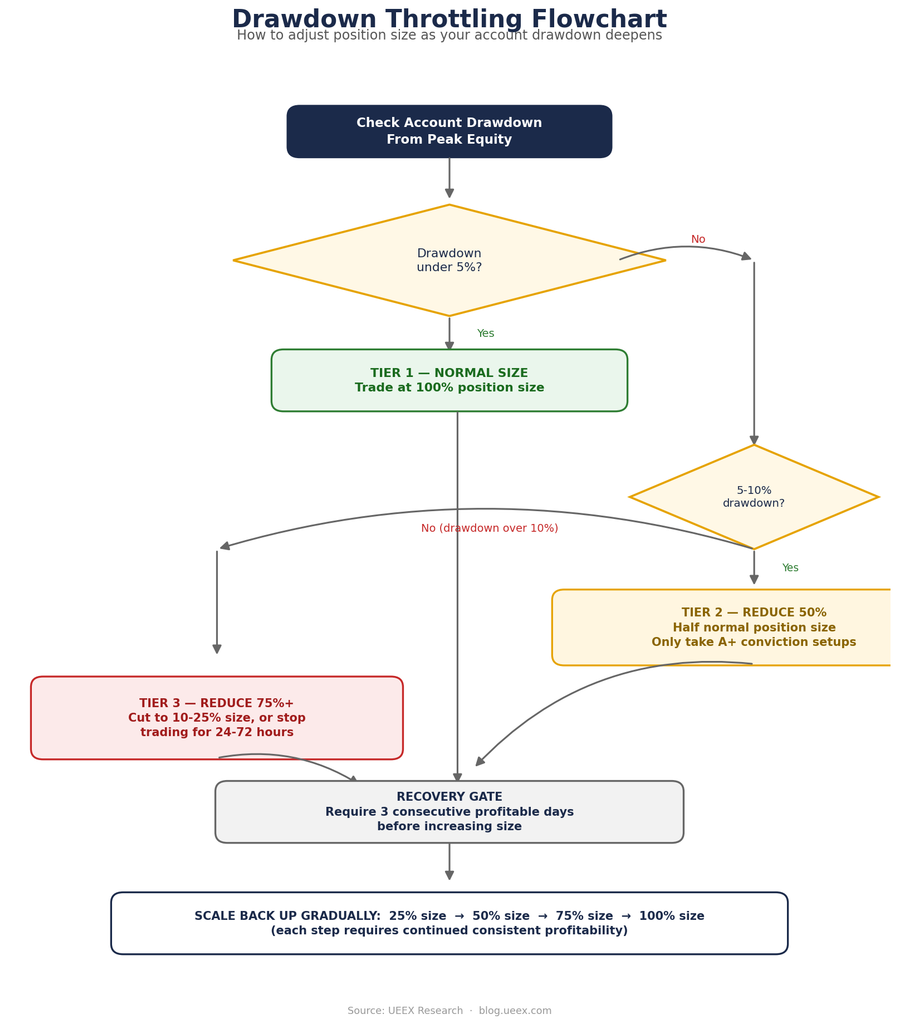
A simple three-tier system prevents you from digging a deeper hole after a rough stretch:
- At peak or under 5% drawdown: Trade at normal size.
- 5-10% drawdown: Cut position size in half, and only take your highest-conviction setups.
- Over 10% drawdown: Cut size by 75%, or stop trading entirely for 24-72 hours.
To rebuild after a drawdown, don’t jump straight back to full size. Move up gradually: 25% of normal, then 50%, then 75%, then back to 100%, requiring a few consecutive profitable days before advancing to the next tier.
Read Also: Historical Volatility Analysis in Cryptocurrency
Leverage Consideration
The math here is brutal and worth sitting with. During the October 2025 crash, Bitcoin fell about 17% in a day. A trader using 5x leverage on a long position would have faced an 86% loss on their margin. At 10x leverage, they’d have been liquidated almost instantly. At 20x or higher, a single 5% adverse move would have wiped the position out completely.
A reasonable rule: never exceed 5x leverage even in calm markets, and drop leverage entirely, or close to it, once volatility starts climbing.
Strategy 2: Trading Breakouts During Volatile Markets
Here’s how trading breakout moves during volatile markets
Why Breakouts Work in Volatility
High volatility often follows a period of tight consolidation, almost like tension building up before it releases. Bitcoin’s move from a months-long range between $107,000 and $126,000 into the October crash is a clear example.
When that kind of range finally breaks, the breakout tends to:
- Move faster and further than low-volatility breakouts
- Attract momentum traders quickly
- Create FOMO that accelerates moves
- Show increased volume confirmation
The Consolidation Breakout Strategy
Spotting a Real Setup
- Price has consolidated in a tight range for at least 3+ days on daily charts, or 10+ bars intraday.
- Volume has been contracting during the consolidation
- ATR has been flat or declining while the range holds
- There’s a clear resistance level above and support level below
Entry Rules
- Wait for a close beyond resistance or support by at least 0.5-1%, rather than jumping in on the first wick through the level.
- Confirm with a volume spike, ideally 1.5x the recent average, on the breakout candle
- For a lower-risk entry, consider waiting for the first pullback to the breakout level before entering.
Setting Your Stop and Target
Place your stop on the opposite side of the consolidation range, or use roughly 2x ATR from your entry. During volatile conditions, resist the urge to use a tight stop. It will just get you shaken out by normal noise.
To set a target, measure the height of the consolidation range and project that same distance from the breakout point. Bitcoin’s own $107,000-$126,000 range (about $19,000 wide) projected a downside target near $88,000 after the October breakdown, and the actual low landed close to $102,000, a reasonable outcome given how fast the move happened.
Filtering Out False Breakouts
Watch out for breakouts on low volume, breakouts during thin-liquidity hours (crypto weekends or pre-market stock sessions), or moves with no clear news trigger behind them. A quick four-point checklist helps:
- Was volume at least 1.5x average on the breakout?
- Was it a clean break, not just a brief spike?
- Is there a news driver or an established trend behind it?
- Do multiple timeframes agree on the direction?
Three or four “yes” answers suggest a valid breakout. Fewer than two suggests you’re probably looking at a trap. For a full walkthrough of chart patterns and confirmation tools, our Technical Analysis Masterclass covers these in more depth.
Strategy 3: Trend Following With Trailing Stops
Here’s how you can follow trends during volatility
Why Trends Extend in Volatility
Volatility doesn’t kill trends. It usually makes them run further and faster than seems reasonable, because fear and greed push prices past what the fundamentals would normally justify. However, you can keep track using a trailing stop, an advanced stop-loss order that automatically moves up or down with the market price, locking in profits and limiting losses if the trend reverses.
Key insight: In extreme volatility, price often moves 30-50% beyond “logical” support/resistance levels due to panic/euphoria.
There's no Call To Action with the ID #0.Reading Trend Strength With Moving Averages
A simple 10/50/200-period moving average setup works well here. When the 10-period average sits above the 50, which sits above the 200, you’re in a strong uptrend, and the reverse signals a strong downtrend. When the averages are tangled together, the trend is weak, so it’s better to reduce size or wait.
Bitcoin was trading above all three averages right before its October 6 all-time high, a clear uptrend signal. By October 10, the price had crashed straight through the 10-day and 50-day averages, an early warning that traders watching moving averages could have used to exit before the worst of the damage.
Simple MA Setup:
- 10-period MA for short-term trend
- 50-period MA for intermediate trend
- 200-period MA for long-term trend
Entry Rules:
- Enter long when price bounces off the 10-MA in an uptrend (10-MA above 50-MA)
- Enter short when price bounces off the 10-MA in a downtrend (10-MA below 50-MA)
An ATR-Based Trailing Stop
Set your trailing stop at 2x ATR below the highest price reached since you entered a long position (or above the lowest price for a short). As price moves in your favor, the stop follows.
Example:
- Enter a Bitcoin long at $110,000
- ATR is $3,000, so your initial trailing stop sits at $104,000
- Price rises to $120,000
- Your trailing stop moves up to $114,000
- You’ve now locked in at least $4,000 of profit even if price reverses
Percentage-Based Trailing Stop
A percentage-based trailing stop is the simplest way to lock in profits while limiting downside. Set the stop a fixed percentage below the highest price reached, typically 5–10% for cryptocurrencies due to their higher volatility and 2–5% for stocks, depending on the asset and your risk tolerance.
As the price rises, the stop automatically moves higher, but it never moves down, helping you protect gains without exiting a strong trend.
There's no Call To Action with the ID #0.Comparing Trailing Stop Methods
| Method | Pros | Cons | Best Used For |
| ATR-based | Adjusts to real volatility | Requires a quick calculation | All conditions |
| Fixed percentage | Simple and fast | Ignores changing volatility | Calmer markets |
| Moving average | Easy visual signal | Can lag in fast-moving markets | Swing and position trades |
Combining Partial Profits with Trailing Stops
A practical approach is to scale out: take 30% of your position off at a 1:1 risk-to-reward ratio, another 30% at 2:1, and let the remaining 40% run with a trailing stop. This guarantees you lock in something even if the trend reverses, while still leaving room to capture an extended move.
Plenty of traders who held their full position through the October reversal, hoping to squeeze out more profit, gave the whole gain back. Partial profit-taking would have protected most of it.
Read Also: Crypto Trading Journal: How to Build One That Actually Improves Your Trading
Timeframe Consideration
The sharp market volatility seen in late 2025 showed that shorter timeframes produced far more false breakouts, while daily and weekly consolidations generated more reliable signals. Regardless of timeframe, wait for a confirmed breakout instead of reacting to the first price move beyond a range.
- Day traders: 5-minute or 15-minute charts.
- Swing traders: 4-hour or daily charts.
- Position traders: Weekly charts.
Intermediate Strategy: Options Plays for Trading High Volatility Markets
Options matter here for one big reason: your maximum loss is defined the moment you buy the contract.
During the chaos of October 2025, futures and spot traders faced losses that could, in theory, run far beyond their initial deposit through liquidation cascades. Options buyers, by contrast, knew from the start that the worst case was losing the premium they paid, nothing more.
Long Straddle: Betting on a Big Move, Either Direction
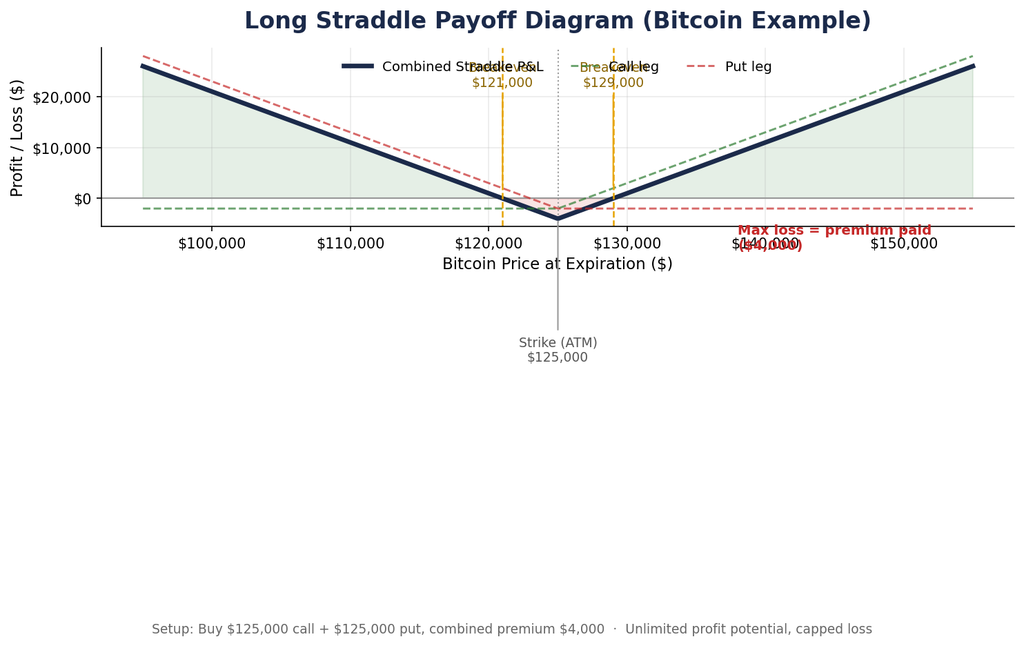
Buy an at-the-money call (a contract where the strike price equals or is very close to the current market price of the underlying stock) and an at-the-money put with the same strike and expiration.
This works well ahead of events where you expect a large move but have no strong view on direction, like a Fed decision or a major tariff announcement.
Example: October 9, 2025
- Bitcoin trades around $125,000 after hitting fresh all-time highs.
- Buy a $125,000 call and a $125,000 put for a combined premium of $4,000.
- October 10, 2025: Bitcoin plunges to about $102,000 following renewed U.S.-China tariff tensions, triggering one of the largest crypto liquidation events on record.
- The put option surges in value to roughly $23,000, while the call expires worthless.
- Net profit: $19,000 ($23,000 − $4,000).
The key is timing: buy straddles before volatility spikes, while options are still cheap, not after the move has already happened and everyone else is bidding up premiums.
Long Strangle: A Cheaper, Wider Bet
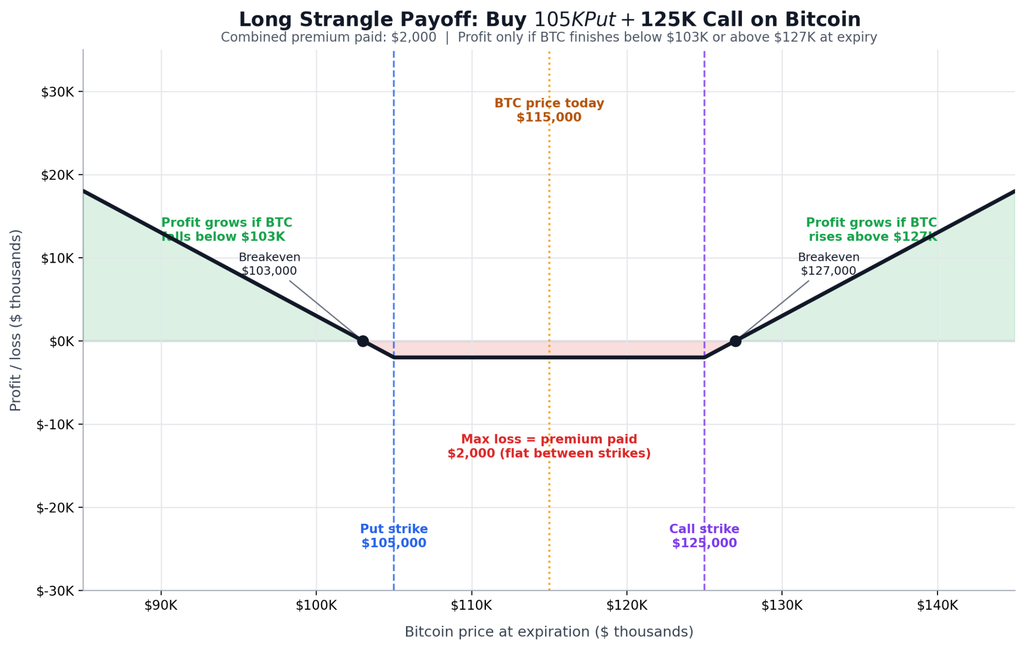
A long strangle is a neutral options strategy where you buy an out-of-the-money (OTM) call option (strike price is higher than the current market price of the underlying asset) and an OTM put option (strike price is below the asset’s current market price) with the same expiration date.
Example:
- Bitcoin at $115,000
- Buy a $125K call and a $105K put for a combined $2,000 premium
- Costs less than a long straddle because both options are out of the money.
- Profits only if BTC finishes above $127K or below $103K at expiry; otherwise, the premium paid is the maximum loss.
It costs less than a straddle but needs a bigger move to turn a profit. This suits a lower-conviction volatility play where you still want your risk capped.
Iron Condor (Neutral Volatility Play)
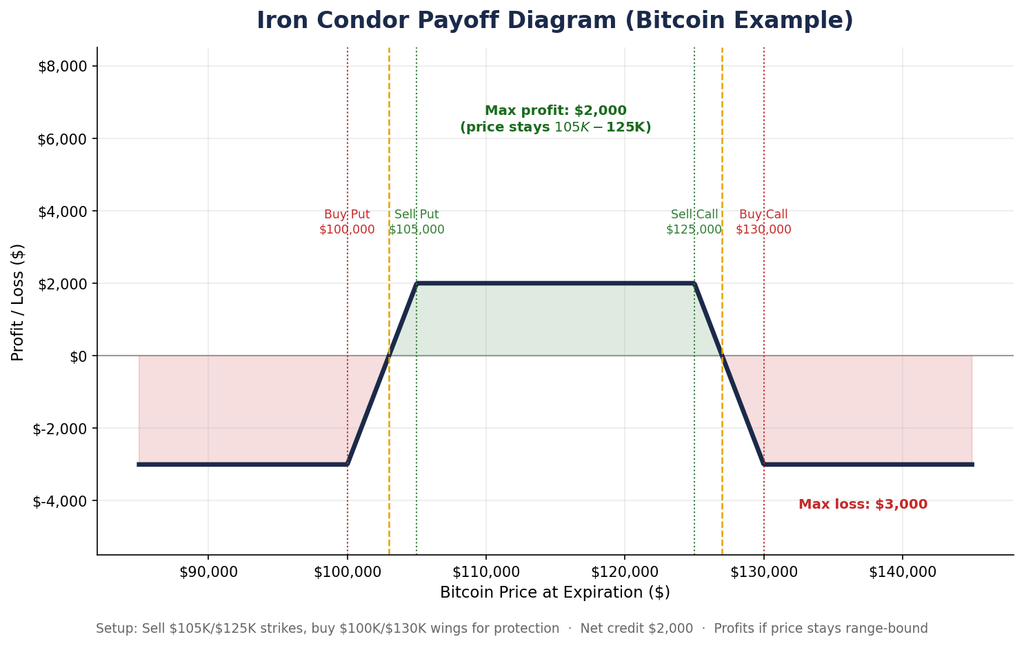
Sell an OTM call spread above the market and a put spread below it, collecting premium up front, and profit if price stays inside that range.
Example:
- Bitcoin at $115,000
- Sell $125K call, buy $130K call (call spread)
- Sell $105K put, buy $100K put (put spread)
- Collect $2,000 premium
- Profit if Bitcoin stays between $105K-$125K
This strategy performs poorly during genuine extreme volatility, since a big enough move blows straight through both sides of the range. A sensible risk rule is to close the position if losses reach 2-3 times the premium collected, rather than letting it run unchecked.
Covered Calls: Income While You Wait
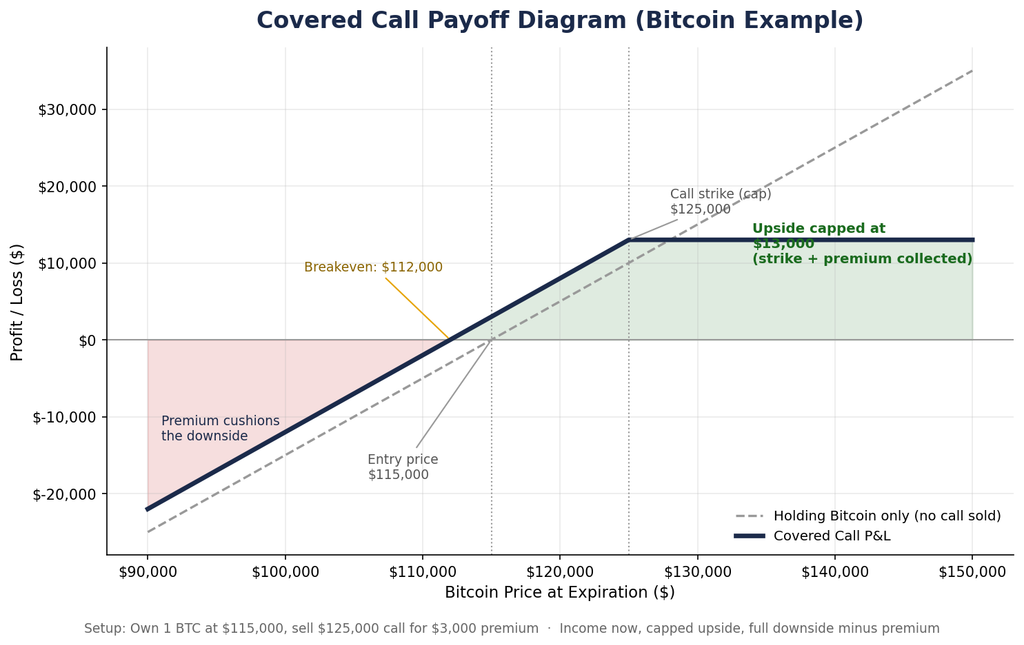
If you already own the underlying asset and expect sideways or modestly volatile price action, selling an out-of-the-money call against your holding brings in premium income. The tradeoff is a capped upside. If the asset rockets past your strike price, you only participate in gains up to that level.
Example:
- Own 1 Bitcoin at $115,000
- Sell a $125K call for a $3,000 premium
- If BTC stays below $125K = keep Bitcoin + $3,000 premium
- If BTC rises above $125K = sell at $125K + keep $3,000 premium (total: $13K profit)
Advanced Strategy: Trading the VIX and Volatility ETFs
Explore how to trade the VIX and volatility ETFs
What the VIX Actually Measures
The VIX reflects the market’s expectation of S&P 500 volatility over the next 30 days, built from options prices. It’s often nicknamed the fear index because it climbs when stocks fall and cools off when things settle down. You can track the official methodology and live data directly on CBOE’s VIX page.
- Below 15: calm, complacent market
- 15-20: normal conditions
- 20-30: elevated fear or uncertainty
- 30-40: high fear, often corrections or crises
- Above 40: extreme fear, the kind seen in genuine crashes
Note: the VIX tends to be mean-reverting. Extreme readings, whether unusually high or unusually low, tend to drift back toward the 15-20 zone over time.
Trading Volatility Through ETFs
Products like ProShares’ UVXY offer leveraged long exposure to short-term VIX futures, useful as a hedge or a speculative bet that volatility is about to spike. VXX offers similar but less leveraged exposure.
On the other hand, products like SVXY bet on volatility falling, which can work well in calm markets but is dangerous to hold through a spike, since a sudden VIX jump can produce sharp, fast losses for anyone positioned short volatility.
A few practical rules: treat long-volatility ETFs as portfolio insurance rather than a core strategy, avoid shorting volatility once the VIX is already above 25, and pay attention to the VIX futures curve.
When near-term futures trade above longer-dated ones (a state called backwardation), it usually signals real market stress. The opposite pattern, called contango, usually signals calm.
Crypto’s Own Volatility Gauge
Bitcoin’s implied volatility index (BVIV) doesn’t always move in step with the VIX. In late October 2025, the VIX had settled back under 20 while BVIV stayed above 50%, largely because crypto options were still pricing in the risk of further automated deleveraging events, a risk that doesn’t really exist in the same way for stocks.
The practical lesson: don’t assume crypto and stock volatility move together. Track each on its own terms. Liquidation and open-interest data from platforms like CoinGlass is a useful way to monitor crypto-specific stress building up in real time.
For crypto-specific volatility playbooks, our Crypto Trading Strategies guide goes deeper into managing exposure across exchanges and derivatives.
Risk Management and Trading Psychology During Volatile Markets
Why Volatility Hijacks Good Decision-Making
Big price swings trigger old, primal responses; for instance, Fear shows up as selling at the bottom, closing winners too early, or freezing and not entering at all.
Greed shows up as oversized positions, revenge trading after a loss, and ignoring your own stop loss, while FOMO (fear of missing out) shows up as chasing a move that’s already extended, jumping in right as it runs out of steam.
During October 2025, traders who panic-sold near the $102,000 low missed the recovery that followed. Others who tried to immediately win back losses through bigger, faster trades often turned one bad day into a genuinely damaging one.
A Pre-Trade Checklist
Before entering any trade in a volatile market, run through these six questions:
- Do I know my exact dollar risk, and is my stop already set?
- Is my position size appropriately reduced for the current volatility regime?
- What regime are we actually in right now (VIX level, ATR versus its recent average)?
- Do I have at least two independent reasons for this trade?
- Do I know exactly where I’ll take profit and where I’ll cut losses, decided before entry?
- Am I calm right now, or am I trading on emotion?
If the answer to any of these is no or I’m not sure, it’s better to skip the trade.
The 24-Hour Rule
After a drawdown of 5% or more in a single day, or after a strong emotional reaction like anger or euphoria, stop trading immediately.
Close the platform, wait at least 24 hours before placing another trade, and use that time to write down what actually happened, not just what you wish had happened. Come back only once you feel emotionally neutral again.
Setting Daily Loss Limits
A simple framework: cap your daily loss at 3-5% of your account, and once you hit it, you’re done for the day, no exceptions. On a $100,000 account, a 3% daily limit means stopping after $3,000 in losses.
Traders without a limit like this often lost 10-20% or more in a single session during the October crash, simply because there was no mechanical stopping point built into their process.
Reading Sentiment as a Contrarian Signal
The Crypto Fear & Greed Index runs from 0 to 100. Readings from 0-25 indicate extreme fear, which has historically marked strong buying opportunities. Readings from 75-100 indicate extreme greed, often a warning sign rather than a reason to chase.
The index plunged into extreme fear territory multiple times during the October 2025 crash, right around the point where Bitcoin found its low near $102,000. A useful contrarian habit: lean cautious when everyone else is greedy and look for opportunity when everyone else is fearful.
There's no Call To Action with the ID #0.How to Trade During High Volatility: A Quick Action Plan
Use this as your working checklist:
- Check the regime first: Look at the VIX, ATR, and Bollinger Bandwidth before deciding what kind of strategy even makes sense today.
- Cut your position size as volatility rises: Use the sizing table above as a starting point, not a suggestion.
- Widen your stops: 2-3x ATR in volatile conditions, versus 1-1.5x ATR in calm ones.
- Match the strategy to the regime: Range trading in calm markets, breakouts and trends in elevated volatility, mean reversion, or options in extreme volatility.
- Consider options when uncertainty is genuinely high: These strategies help cap your downside in a way spot and futures positions cannot.
- Set a daily loss limit before you start trading, not after a bad day.
- Use the 24-hour rule after any serious drawdown or emotional trade.
In 2026, ongoing geopolitical uncertainty, evolving regulations, and around-the-clock markets mean volatility is likely to remain a constant feature. The question is no longer whether another turbulent period will occur, but whether traders will be prepared to manage the risks and capitalize on the opportunities when it does.
Frequently Asked Questions
What’s the difference between trading volatility and trading in a volatile market?
Trading volatility usually means taking a position specifically on how much price will move, often through options or VIX-linked products, regardless of direction. Trading in a volatile market means using your regular strategy, stocks, crypto, or forex, but adjusting your position size, stops, and setups to account for bigger, faster price swings.
Should I increase or decrease my position size during high volatility?
Decrease it. As volatility rises, the same percentage move represents a larger dollar swing, so keeping your position size the same effectively increases your real risk. Cutting size by 50-75% during elevated to extreme volatility is a standard professional adjustment.
What’s the best indicator for measuring volatility?
There isn’t one single best indicator. ATR is the most practical for setting stop distances and position size on a specific asset. The VIX is best for gauging overall market fear in stocks, and Bollinger Bandwidth offers a quick visual read. Most experienced traders combine at least two of these rather than relying on just one.
Disclaimer: This content is for educational purposes only and should not be considered financial advice. Always do your own research, never risk more than you can afford to lose, and consult a qualified financial advisor before acting on any strategy described above. UEEx makes no guarantees about trading outcomes and is not liable for any losses incurred.