In 2021, Solana surged from about $1.60 to nearly $260, while Axie Infinity’s AXS climbed to around $165. Early buyers made huge gains, but those who arrived late often bought the top and suffered the crash that followed.
That is the appeal of altcoin season and why timing matters. Retail traders often notice it only after altcoins have already surged and social media is full of hype.
As of September 2026, the market has not reached that point. Bitcoin dominance is about 57%, while the CoinMarketCap Altcoin Season Index sits around 30-35 out of 100, still in Bitcoin Season. The ETH/BTC ratio is around 0.031, showing Ethereum has yet to establish clear dominance over Bitcoin.
This guide explains the key indicators to watch, what they signal now, and how to prepare before capital rotates into altcoins.
Key Takeaways
- No single indicator works alone. Bitcoin dominance, the Altcoin Season Index, the ETH/BTC ratio, and DeFi TVL need to line up together before you can call it altseason with any confidence.
- Right now, the data says Bitcoin season. As of September 2026, Bitcoin dominance is near 56-59%, the Altcoin Season Index is around 30-35, and ETH/BTC is close to its lowest level in years. None of that says altseason is imminent.
- 2026 is a recovery year, not a mania year. Bitcoin hit an all-time high near $126,000 in October 2025, then corrected hard. DeFi TVL fell close to 40% from its January 2026 level. Altseason, if it comes, is starting from a much weaker base than in 2021.
- Position sizing beats prediction. You don’t need to call the exact top or bottom. You need a plan that keeps you solvent while you wait for confirmation.
- Bitcoin is still the anchor. When Bitcoin drops hard, altcoins usually drop harder. Keeping a meaningful share of a portfolio in Bitcoin and stablecoins isn’t overly cautious; it’s how you stay in the game long enough to catch the next rotation.
Altcoin Season
Altcoin season (or “altseason”) is a stretch of time when most altcoins consistently gain more than Bitcoin does, as capital rotates out of Bitcoin and into smaller, riskier crypto assets. It’s usually confirmed when at least 75% of the top altcoins outperform Bitcoin over a rolling 90-day window, according to BlockchainCenter.
How capital actually moves
Crypto cycles tend to follow a rough order. Bitcoin rallies first because it’s the asset institutions and new money trust the most. Once the Bitcoin price starts to level off, some of those gains look for a new home. That money typically moves in stages:
Bitcoin → large-cap altcoins (Ethereum, Solana) → mid-cap altcoins → small-caps → and, if things get speculative enough, meme coins.
Think of Bitcoin as the front door to crypto. Most new money walks in through Bitcoin because it’s the asset people have actually heard of. Altcoins are the rooms further inside the house, and by the time people are wandering into the back rooms, the party has usually been going for a while.
Three qualities of altseason
Not every rotation looks the same:
1. Broad altseason (most of 2017 and early 2021): Almost everything goes up together. A rising tide, regardless of quality.
2. Selective altseason (late 2021 and the more likely shape for any 2026-27 rotation): only projects with real usage and real revenue get rewarded. Sector rotation instead of blanket euphoria.
3. Failed altseason (multiple false starts in 2019 and again at points in 2025-26): Bitcoin dominance dips, altcoins pop 20-30%, and then Bitcoin dominance snaps back, and altcoins give it all back. These are the ones that trap people who chase the first green candle.
Altcoins carry more risk than Bitcoin, but they also carry more upside in the right window. In the 2021 cycle, the average top-100 altcoin posted gains many multiples larger than Bitcoin’s. The catch is timing. Getting in during the early, boring phase (Phase 1-2 below) usually means a much better entry than getting in once the coin is already trending on social media.
The Four Phases of Altcoin Season
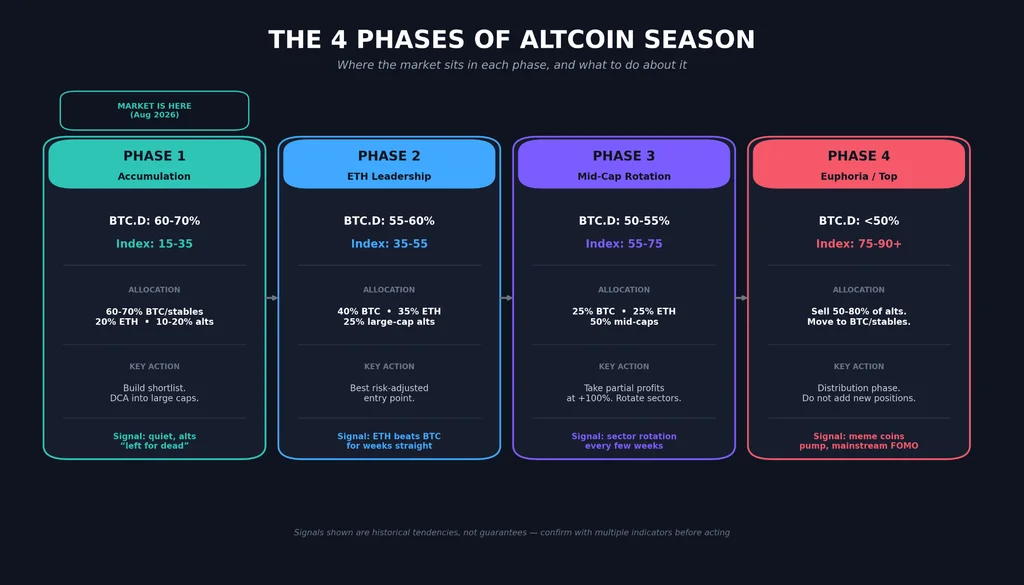
Every altseason (and every attempt at one) tends to move through similar stages. Knowing which phase the market is in tells you how aggressive, or careful, to be.
Phase 1: Bitcoin Season, Quiet Accumulation
Bitcoin dominance is high (60%+) and climbing or holding steady. The Altcoin Season Index sits below 35. Sentiment around altcoins is flat or negative; “alts are dead” is a common line. Underneath the surface, patient buyers are slowly accumulating quality names at depressed prices, and Ethereum may start to firm up against Bitcoin.
This is where the market sits as of September 2026
Strategy: keep most of the portfolio in Bitcoin and stablecoins, research your shortlist of altcoins, and dollar-cost average small amounts into 3-5 large-cap names rather than trying to guess the exact bottom.
Phase 2: Ethereum Leadership
Bitcoin dominance starts to slip (roughly 55-60%), and the Altcoin Season Index climbs into the 35-55 range. Ethereum begins to consistently beat Bitcoin over multi-week stretches, and large-cap altcoins start moving with it.
Strategy: This is historically the best risk-adjusted entry point. Rebalance gradually toward large-cap altcoins, but keep position sizes modest since confirmation is still building.
Phase 3: Mid-Cap Rotation
Bitcoin dominance is falling faster, the Altcoin Season Index pushes into the 55-75 range, and sector narratives (DeFi, then Layer 1s, then whatever theme is hot) rotate every few weeks. Volumes and volatility both spike.
Strategy: This phase rewards active management, not passive holding. Start taking partial profits on anything up 100% or more, and tighten stop-losses since altcoins get more volatile as the crowd piles in.
Phase 4: Euphoria and the Top
The Altcoin Season Index is above 75, Bitcoin dominance is near cycle lows, and small-cap and meme coins are posting triple-digit gains in days. Mainstream media starts covering “which coin to buy next.” This is the most dangerous phase to be adding new money.
Strategy: This is a distribution phase, not an accumulation phase. Take profits aggressively, and rotate winnings back into Bitcoin, Ethereum, and stablecoins before the reversal.
“The Altseason Index is one of the most popular tools for tracking market rotation. A reading below 25 signals Bitcoin season, while values between 25 and 75 suggest a mixed market.”
Altcoin Season Indicators
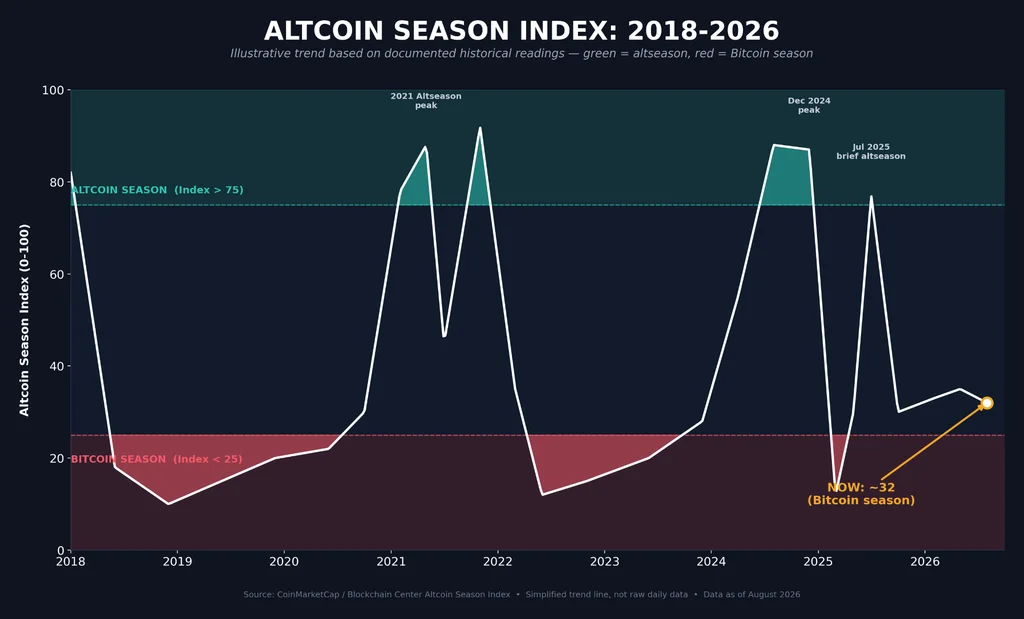
No single number tells the whole story. Professional traders build a scorecard from several signals and look for them to agree before making a real call. Here are the indicators that matter most.
1. Bitcoin Dominance (BTC.D)
Bitcoin’s share of the total crypto market, calculated as Bitcoin’s market cap divided by the market cap of all cryptocurrencies combined. Bitcoin dominance is the closest thing crypto has to a master switch. When it’s rising, money is concentrating in Bitcoin. When it’s falling, money is spreading out into altcoins.
Bitcoin dominance briefly broke above 60% for the first time in 2026 in late April, then settled into a 56-60% range through the summer, according to industry trackers.
That’s down from a peak near 65% in mid-2025 but still a long way from the sub-50% readings that marked the middle of the 2017 and 2021 altseasons. During the 2017 cycle, dominance fell from about 85% in January to roughly 38% by year-end. During 2021, it fell from around 70% in January to about 40% by May.
How to track it: TradingView’s BTC.D chart is free and updates live. Set alerts for a break below 55%, then below 50%, since those levels have historically preceded broader rotations.
2. The Altcoin Season Index
A 0-100 score, popularized by Blockchain Center and tracked on CoinMarketCap’s Altcoin Season Index, measures how many of the top altcoins have beaten Bitcoin’s return over the trailing 90 days. Below 25 is Bitcoin season. Above 75, sustained for a few weeks, is generally accepted as a confirmed altcoin season.
Through September 2026, the index has mostly read in the low 30s to early 40s, firmly inside Bitcoin-season territory. That’s a long way from the 75+ readings altseason requires, and it’s a much weaker starting point than late 2024, when the index touched the high 80s before the correction that followed.
The 90-day lookback matters because it filters out noise. A handful of altcoins pumping for a day doesn’t move this number. Sustained outperformance across dozens of coins does.
3. ETH/BTC Ratio
Ethereum’s price divided by Bitcoin’s price. Ethereum has historically acted as the bridge asset between Bitcoin and the rest of the altcoin market, so a rising ratio tends to lead a broader rotation.
This is one of the more sobering indicators of the current cycle. The ETH/BTC ratio has spent much of 2026 near its weakest levels in years, at points below 0.03, well under both its 2021 peak (around 0.08) and its longer-run historical average (roughly 0.10).
Ethereum’s spot ETFs have drawn far smaller inflows than Bitcoin’s, and Layer 2 networks like Arbitrum and Base have pulled fee revenue away from Ethereum’s base layer, which has weakened one of the mechanisms that used to support ETH’s price relative to Bitcoin.
“A ratio near multi-year lows tells a story: the market, in its current risk-off and Bitcoin-dominated mood, has been choosing Bitcoin over Ether decisively.”
For altseason to build real momentum, this ratio typically needs to reverse and hold above its 200-week moving average on a weekly close, not just bounce for a few days.
Our guide on Bitcoin vs Ethereum expands more on the comparison between these two top assets.
4. Total Altcoin Market Cap (TOTAL2)
The combined market cap of every cryptocurrency except Bitcoin. It’s a simple way to check whether money is genuinely flowing into altcoins as a group, separate from any single coin’s price action.
The altcoin market cap, meaning total crypto market cap excluding Bitcoin, has been oscillating between roughly $1.07 trillion and $1.19 trillion through most of 2026, well below the sector’s 2025 peak. Since altcoins as a group have underperformed Bitcoin for most of the year, TOTAL2 has lagged even that modest range.
A sustained break to new highs in TOTAL2, especially while Bitcoin dominance is falling, is one of the clearest confirmations that a rotation is real rather than a short squeeze.
5. DeFi Total Value Locked (TVL)
The dollar value of crypto assets deposited into DeFi protocols for lending, staking, and trading. Rising TVL usually means fresh capital is entering the ecosystem looking for yield, which tends to support altcoin and DeFi-token prices.
DeFi TVL has actually fallen sharply in 2026, dropping from around $115 billion in January to roughly $80-91 billion by mid-to-late summer, according to DefiLlama data cited by multiple industry trackers.
That’s a decline of close to 40% for the year, driven by weaker token prices, a wave of protocol exploits, and cooling yields. Ethereum still holds a bit over half of all DeFi TVL. For context, DeFi TVL peaked near $177 billion at the top of the 2021 cycle, so the current level is still a fraction of that all-time high.
A falling TVL is not itself proof that altseason is off the table, but it is a sign that speculative capital has been leaving the system rather than rotating within it. Watch for TVL to bottom and start climbing month over month as an early, if noisy, signal.
6. Volume and Exchange Flows
Comparing altcoin trading volume to Bitcoin’s and watching whether coins are flowing onto exchanges (often a precursor to selling) or off exchanges into self-custody (often read as accumulation).
Rising altcoin volume relative to Bitcoin, especially against stablecoin pairs rather than just BTC pairs, suggests fresh capital rather than the same money shuffling between assets.
Tools like CoinGlass and Glassnode track this in detail, and it’s worth checking before committing to a new position, since a price move without volume behind it often fades quickly.
7. Social Sentiment and the Fear & Greed Index
How much attention altcoins are getting on X, Reddit, and search engines, plus the Crypto Fear & Greed Index, which scores overall market mood from 0 (extreme fear) to 100 (extreme greed).
Rising search interest and social buzz around specific altcoins often line up with the middle innings of a rotation. The trap is late-stage euphoria: when mainstream outlets and people who’ve never mentioned crypto before start asking about a specific token, that’s typically closer to a top than a start.
8. Halving Cycle Timing
Bitcoin’s block reward halving events, which occur roughly every four years, have historically been followed by altcoin seasons about 6-9 months later, once Bitcoin’s initial post-halving rally cools off.
The most recent Bitcoin halving happened on April 19, 2024. Using the loose historical pattern (rotation following roughly 6-9 months after the initial post-halving rally peaks), some analysts expected altcoin strength to build through late 2024 and into 2025.
Bitcoin did reach a new all-time high of about $126,000 in October 2025, but the correction that followed pulled the whole market, altcoins included, into the weak, Bitcoin-dominated conditions seen through most of 2026.
The lesson here is that the halving pattern is a rough guide, not a guarantee, and this cycle has not followed the 2017 or 2021 script closely.
9. Macro Liquidity and Regulation
Broader financial conditions, interest rates, and regulatory developments that affect how much risk appetite exists across markets, crypto included.
Two macro threads are worth watching into late 2026. First, Treasury and Federal Reserve policy on rates and liquidity, which investors can track through the Federal Reserve Economic Data (FRED) database, tends to move risk assets broadly, altcoins among the most sensitive.
Second, U.S. crypto market-structure legislation, the CLARITY Act, which would clarify how the SEC and CFTC divide oversight of digital assets, passed the House in mid-2025 but has stalled in the Senate.
A procedural vote was scheduled for September 15, 2026, though prediction markets have been pricing a low probability of the bill becoming law this year. A clear regulatory framework would likely support institutional interest in altcoins beyond Bitcoin and Ethereum; continued delay leaves that driver on hold.
Where 2026 Actually Stands: A Reality Check
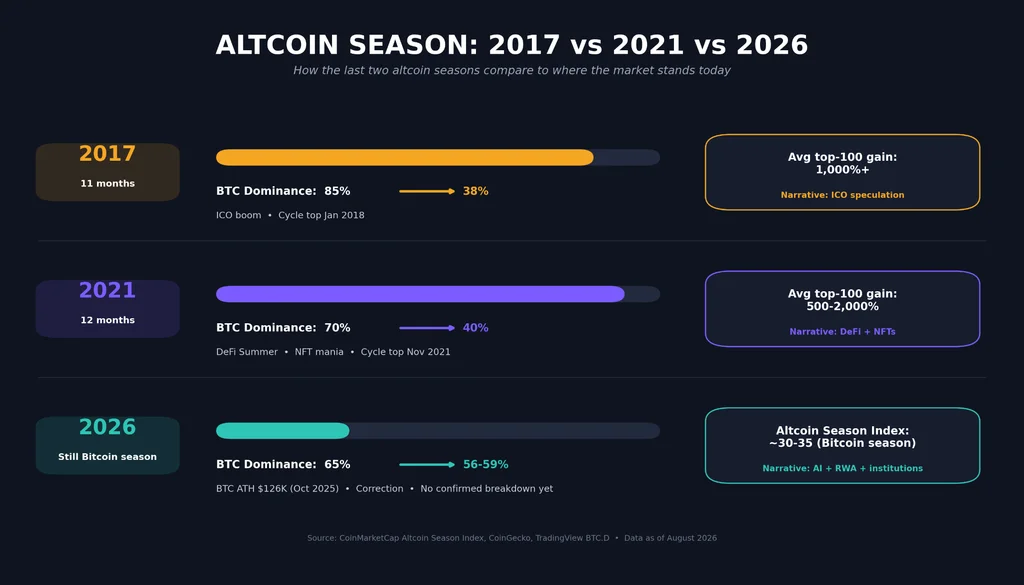
It’s worth being direct about this: the setup many traders hoped for in 2026 (a repeat of 2021’s broad euphoria) has not shown up in the data.
Bitcoin hit its current cycle’s all-time high near $126,000 in October 2025, then corrected by more than 50% at its worst point and spent much of 2026 rebuilding in a lower range. Altcoins, as a group, have underperformed through that entire stretch.
Here’s how the current setup compares with the two most-referenced altseasons in crypto history:
| Factor | 2017 | 2021 | 2026 (current) |
| Bitcoin dominance range | 85% → 38% | 70% → 40% | 65% → 56-60% (no confirmed breakdown yet) |
| Altcoin Season Index | N/A (didn’t exist yet) | Reached 75+ for extended stretches | 30-35, Bitcoin season |
| ETH/BTC ratio | Rose sharply | Peaked near 0.08 | Near multi-year lows, 0.03 |
| DeFi TVL trend | N/A | Grew from roughly $2B to $177B | Fell roughly 40% from January 2026 levels |
| Driving narrative | ICO speculation | DeFi and NFTs | AI, real-world assets, institutional flows |
| Market mood | Broad euphoria | Broad euphoria, then meme-coin mania | Cautious, recovery-focused |
None of that rules out a rotation later in the cycle. It does mean anyone treating altseason as already underway, or imminent on a fixed date, is getting ahead of what the indicators actually show.
How to Position Yourself for Altseason
You don’t need to predict the exact week altseason starts. You need a plan for each phase so you’re not scrambling when the data shifts.
While it’s still Bitcoin season (where things stand now)
- Keep the bulk of the portfolio, somewhere around 60-70%, in Bitcoin and stablecoins.
- Build a shortlist of 10-15 altcoins you’d actually want to own, across a few sectors (Layer 1s, DeFi, AI-linked tokens, and real-world-asset projects), and study their tokenomics and unlock schedules before you need to act quickly.
- Dollar-cost average small amounts into a handful of large-cap altcoins rather than waiting for a “perfect” entry that may not come.
- Set alerts for the indicators above: Bitcoin dominance below 55%, the Altcoin Season Index above 50, and ETH/BTC reclaiming its 200-week average.
If Bitcoin dominance starts falling and Ethereum leads
- Rebalance gradually toward large-cap altcoins, aiming for something like 25-35% of the portfolio, rather than flipping the whole book at once.
- Use limit orders instead of chasing green candles.
- Set stop-losses before you enter, not after the position is already underwater.
If mid-caps start moving and the Altcoin Season Index crosses 55-60
- Take partial profits as positions double, rather than waiting to see how high things go.
- Rotate between sectors as momentum shifts, but don’t hold everything at once; concentration risk gets worse, not better, as volatility rises.
- Tighten stop-losses as prices rise so a sudden reversal doesn’t erase months of gains.
If euphoria sets in (index above 75, small-caps and meme coins exploding)
- Treat this as a selling phase, not a buying phase.
- Move a meaningful share of profits back into Bitcoin, Ethereum, and stablecoins.
- Watch for Bitcoin dominance to bottom and turn upward; historically, this has been one of the more reliable early signs that the top is in.
Learn how to invest smartly and safely with our guide on How to Diversify your Crypto Portfolio.
The Interconnectedness Problem
Explore how the interconnection between altseason and Bitcoin carries risk
Altcoin Correlation With Bitcoin
Altcoin season does not mean altcoins have broken free from Bitcoin. BTC still drives much of the market’s direction. A 2026 CME analysis found one-year correlations between Bitcoin and major crypto assets ranging from about +0.70 to +0.82, while other research shows that correlations can weaken during periods when investors increasingly differentiate between Bitcoin and altcoins.
This creates a simple risk: if Bitcoin suffers a sharp correction, many altcoins can fall much faster. The exact move varies by asset and market conditions, but high-beta tokens typically experience larger drawdowns than BTC. Never treat an altcoin-season indicator as protection against a Bitcoin-led sell-off.
DeFi Interconnectedness
DeFi adds another layer of contagion because protocols, tokens, bridges, collateral, and liquidity pools are closely connected. A problem in one major protocol can quickly affect others.
The April 2026 Kelp exploit showed how this works. Attackers used about $292 million in stolen rsETH as collateral on Aave V3. Although Aave itself was not exploited, the incident contributed to roughly $6.6 billion leaving the protocol and pushed AAVE down 16%, while creating around $196 million in potential bad debt.
The Terra/LUNA collapse in 2022 remains the clearest example of wider crypto contagion. The failure of UST and LUNA triggered a major market-wide sell-off and showed how quickly interconnected positions can unwind.
Leverage Cascade Risk
Leverage can turn a normal correction into a much deeper altcoin crash. When traders use perpetual futures with high leverage, a sharp BTC decline can trigger forced liquidations across leveraged altcoin positions. Those liquidations create additional selling pressure, which can trigger more liquidations.
This makes open interest and funding rates important risk signals. Coinbase’s August 2026 market report showed derivatives open interest rebuilding across major assets, while altcoin open interest dominance remained near its historically low 0.6–0.7 range.
The takeaway is simple: watch Bitcoin, DeFi exposure, and leverage together. Altcoin season signals can identify momentum, but they cannot eliminate systemic market risk.
Risk Management & Position Sizing
A strong altcoin strategy starts with risk management, not return targets. In 2026, institutional investors are placing more emphasis on liquidity, position sizing, and risk controls as crypto volatility remains high. Nearly half of surveyed institutions said they had strengthened these areas.
Position Sizing Framework
Conservative Portfolio
- 70% BTC + ETH
- 20% large-cap altcoins
- 10% mid-caps
- 0% small-caps or meme coins
- Goal: Lower volatility and capital preservation
Moderate Portfolio
- 50% BTC + ETH
- 30% large-caps
- 15% mid-caps
- 5% small-caps with strong conviction
- Goal: Balance growth and risk
Aggressive Portfolio
- 30% BTC + ETH
- 40% large- and mid-caps
- 20% small-caps
- 10% speculative or meme coins
- Goal: Maximize upside while accepting the possibility of severe losses
These allocations are frameworks, not guarantees. Avoid assigning fixed return multiples to each portfolio because altcoin performance depends heavily on market conditions, liquidity, and timing.
As of September 2026, Coinbase Research describes the market as still major-led, with altcoin open-interest dominance near historically low levels rather than showing broad speculative expansion.
Stop Loss Strategies
Set your exit rules before entering a trade.
- Time stop: Exit if the investment thesis fails to develop within 30–60 days.
- Technical stop: Place an exit below a meaningful support level rather than using an arbitrary percentage.
- Mental stop: Define the maximum loss you can accept before entering, such as 20–30%.
- Trailing stop: After a strong move, raise the stop to protect part of the profit instead of waiting for a full reversal.
For volatile small-caps, position size matters as much as the stop itself. A wider stop can make sense for a volatile asset, but the position should be smaller so the potential portfolio loss stays controlled.
Avoid Common Mistakes
Below are common mistakes you should avoid
Overleveraging: Avoid excessive leverage on altcoins. Leverage magnifies both gains and losses and can trigger forced liquidation during sharp moves.
Concentration: Avoid putting too much capital into one altcoin. A 10% maximum allocation can serve as a simple upper limit for high-risk positions.
FOMO: Do not chase a coin after a 500% move. Wait for a setup that offers a better risk-to-reward ratio.
Emotional Attachment: A token is an investment, not a relationship. If the thesis breaks, exit.
Ignoring Bitcoin: BTC remains the market’s main leverage pressure point. When Bitcoin weakens sharply, higher-beta altcoins can suffer even larger moves.
The goal is simple: protect capital first, then pursue upside. A portfolio that survives multiple market cycles gives you more opportunities than one that gets wiped out chasing the biggest winner.
For a deeper walkthrough of position sizing and stop loss frameworks, see our guide on crypto risk management.
Tools for Tracking Altcoin Season
Free:
- CoinMarketCap Altcoin Season Index: daily updated index with historical data
- TradingView BTC.D chart: free real-time Bitcoin dominance charting
- DefiLlama: DeFi TVL across every major chain and protocol
- CoinGecko: market cap, dominance, and altcoin sector data
- Crypto Fear & Greed Index: daily sentiment score
Paid (for deeper on-chain and flow data):
- Glassnode: on-chain analytics and wallet behavior
- CryptoQuant: exchange reserve and institutional flow data
- LunarCrush: social sentiment and influencer-impact tracking
Conclusion
Altcoin season is cyclical, but it is not guaranteed. Bitcoin dominance, the Altcoin Season Index, ETH/BTC strength, liquidity, and market breadth remain key signals to watch.
As of September 2026, the market is still in a transition phase rather than a confirmed altseason. The Altcoin Season Index remains well below the 75 threshold, while Bitcoin dominance is testing the 60% area.
A sustained drop in BTC dominance, stronger ETH/BTC performance, and broader altcoin outperformance would provide stronger confirmation. Q4 could bring another rotation into altcoins, but tighter liquidity and macro uncertainty mean this cycle may reward selective, fundamentally stronger projects rather than broad market speculation.
Frequently Asked Questions
What Bitcoin dominance level usually signals altcoin season?
There’s no single trigger number, but historically, sustained altseasons have needed Bitcoin dominance to fall well below 55%, often into the 40-50% range, alongside a rising altcoin season index. As of September 2026, dominance sits around 56-59%, still short of that threshold.
Is it too late to prepare if the Altcoin Season Index is already at 50?
No, an index reading of 50 is still the transition zone, not confirmed altseason, which requires sustained readings above 75. Entering during the 40-60 range has historically offered a better risk-to-reward setup than waiting until the index is already near its highs.
How long does altcoin season typically last?
Past cycles have run anywhere from about six months (2017) to closer to a year (2020-2021), though not every attempted rotation completes; some fizzle out within weeks. There’s no fixed duration, which is why tracking the indicators in real time matters more than counting calendar months.
Can I just hold Bitcoin and skip altcoin season entirely?
Yes, you can, and it’s a reasonable, lower-stress strategy. Bitcoin has outperformed the vast majority of altcoins over multi-year periods, and skipping altseason means skipping its drawdowns too. The trade-off is giving up the outsized short-term returns that quality altcoins can post during a genuine rotation.